
-52-4-Nagy
19
Arch. Min. Sci., Vol. 52 (2007), No 4, p. 553–571 STANISLAW NAGY*, ANDRZEJ OLAJOSSY* ANALYSIS OF USE OF LOW QUALITY NATURAL GAS TO IMPROVE OIL RECOVERY FACTOR ANALIZA MOŻLIWOŚCI WYKORZYSTANIA GAZU O NISKIEJ JAKOŚCI DO ZWIĘKSZENIA WSPÓŁCZYNNIKA SCZERPANIA ZŁOŻA ROPY NAFTOWEJ Enhanced oil recovery methods are applied more frequently nowadays, mainly because of economic reasons. The classic water flooding methods that aim to maintain the reservoir pressure are substituted or updated by the Water Alternating Gas (WAG) Technology. It involves alternating injection of water and gas, or simultaneous injection of water into the bottom of reservoir and gas into the cap of it. The application of high-nitrogen content gas, residue gases after methane-nitrogen separation processes, carbon dioxide or solutions containing carbon dioxide and nitrogen are considered in terms of the oil recovery efficiency, defined as obtaining of a maximal depletion during twenty years of exploitation. For the selected small oil reservoir in the Polish Lowland, it was performed model research with usage of a pseudo-compositional simulator. Various aspects of gas injection concerning increasing of the reservoir pressure were analyzed, particularly those involving injection into the cap through two wells as well as through four ones. Performed calculations are presented in this paper. The best results were obtained for the injection of the pure carbon dioxide. Other satisfactory solution involves injection of carbon dioxide through two years, and after that injection of nitrogen or the mixture of carbon dioxide and nitrogen. The presented results are promising and show potential possibilities of rising oil recovery by 50-80% with reference to the case without gas injection. Keywords: Enhanced Oil Recovery, EOR, gas injection, lean gas, nitrogen, carbon dioxide sequestration, modeling Metody wtórne w procesach eksploatacji ropy naftowej są stosowane coraz powszechniej w świecie, głównie z przyczyn ekonomicznych. Klasyczne metody nawadniania złoża celem podtrzymania ciśnienia złożowego są zastępowane lub uzupełniane poprzez technologię WAG – naprzemiennego zatłaczania wody i gazu, czy równoczesnego zatłaczania wody do spągu złoża i gazu do czapy. Wykorzystanie gazu ziemnego zaazotowanego, azotu odpadowego po separacji metanu i węglowodorów, dwutlenek węgla lub też roztworów zawierających dwutlenek węgla i azot jest rozważane w aspekcie skuteczności procesu * AGH UNIVERSITY OF SCIENCE & TECHNOLOGY, AL. MICKIEWICZA 30, 30-059 KRAKOW, POLAND; [email protected], [email protected]
-
Upload
stanislaw-nagy -
Category
Documents
-
view
212 -
download
0
Transcript of -52-4-Nagy
553Arch. Min. Sci., Vol. 52 (2007), No 4, p. 553–571
STANISLAW NAGY*, ANDRZEJ OLAJOSSY*
ANALYSIS OF USE OF LOW QUALITY NATURAL GAS TO IMPROVE OIL RECOVERY FACTOR
ANALIZA MOŻLIWOŚCI WYKORZYSTANIA GAZU O NISKIEJ JAKOŚCI DO ZWIĘKSZENIA WSPÓŁCZYNNIKA SCZERPANIA ZŁOŻA ROPY NAFTOWEJ
Enhanced oil recovery methods are applied more frequently nowadays, mainly because of economic reasons. The classic water fl ooding methods that aim to maintain the reservoir pressure are substituted or updated by the Water Alternating Gas (WAG) Technology. It involves alternating injection of water and gas, or simultaneous injection of water into the bottom of reservoir and gas into the cap of it. The application of high-nitrogen content gas, residue gases after methane-nitrogen separation processes, carbon dioxide or solutions containing carbon dioxide and nitrogen are considered in terms of the oil recovery effi ciency, defi ned as obtaining of a maximal depletion during twenty years of exploitation. For the selected small oil reservoir in the Polish Lowland, it was performed model research with usage of a pseudo-compositional simulator. Various aspects of gas injection concerning increasing of the reservoir pressure were analyzed, particularly those involving injection into the cap through two wells as well as through four ones. Performed calculations are presented in this paper. The best results were obtained for the injection of the pure carbon dioxide. Other satisfactory solution involves injection of carbon dioxide through two years, and after that injection of nitrogen or the mixture of carbon dioxide and nitrogen. The presented results are promising and show potential possibilities of rising oil recovery by 50-80% with reference to the case without gas injection.
Keywords: Enhanced Oil Recovery, EOR, gas injection, lean gas, nitrogen, carbon dioxide sequestration, modeling
Metody wtórne w procesach eksploatacji ropy naftowej są stosowane coraz powszechniej w świecie, głównie z przyczyn ekonomicznych. Klasyczne metody nawadniania złoża celem podtrzymania ciśnienia złożowego są zastępowane lub uzupełniane poprzez technologię WAG – naprzemiennego zatłaczania wody i gazu, czy równoczesnego zatłaczania wody do spągu złoża i gazu do czapy. Wykorzystanie gazu ziemnego zaazotowanego, azotu odpadowego po separacji metanu i węglowodorów, dwutlenek węgla lub też roztworów zawierających dwutlenek węgla i azot jest rozważane w aspekcie skuteczności procesu
* AGH UNIVERSITY OF SCIENCE & TECHNOLOGY, AL. MICKIEWICZA 30, 30-059 KRAKOW, POLAND; [email protected], [email protected]
554
czerpania złoża, zdefi niowanego jako uzyskanie maksymalnego sczerpania przez okres dwudziestu lat eksploatacji. Dla wybranego niewielkiego złoża ropy naftowej Niżu Polskiego wykonano badania mo-delowe z wykorzystaniem symulatora pseudo-kompozycyjnego. Analizowano różne aspekty zatłaczania gazu w celu podniesienia ciśnienia złożowego – w szczególności zatłaczanie do czapy zarówno poprzez dwa odwierty, a także poprzez cztery odwierty. Wykonane obliczenia zaprezentowano w niniejszej pracy. Najlepsze wyniki uzyskano dla zatłaczania czystego dwutlenku węgla. Innym dobrym rozwiązaniem jest zatłaczanie dwutlenku węgla przez okres dwóch lat a następnie zatłaczanie azotu lub azotu z dwu-tlenkiem węgla do złoża. Zaprezentowane wyniki są obiecujące i pokazują potencjalne możliwości zwiększenia o 50-80% wydobycia ropy naftowej ze złoża w porównaniu do przypadku eksploatacji pierwotnej złoża.
Słowa kluczowe: wtórne metody eksploatacji ropy naftowej, EOR, gaz zaazotowany, zatłaczanie gazu, azot, sekwestracja dwutlenku węgla, modelowanie
1. Introduction
Displacing of oil from porous medium through the fl uids mixing with oil found application in the technologies of secondary oil reservoir exploitation methods (EOR) and new projects related to EOR with carbon dioxide sequestration (Nagy et al., 2006; Krzystolik et al., 2007; Siemek et al., 2006; Nagy, 2006). Those methods include: injection of gases like CO2, N2 or the natural gas. The gas injection reduces the pressure decline connected with the production of oil from the reservoir. However, the gas injected affects the equilibrium composition of the gas/oil system in the reservoir. Selective reduction of ingredients in oil phase (VGD – Vaporising Gas Drive) is observed. It may also occur the inverse phenomenon which involves condensation of some ingredients from the gas phase (CGD – Condensing Gas Drive) or gas and oil may also have inclination to mi-xing with each other at the fi rst contact (FCM – First Contact Miscibility). The research state concerning displacing is described in Stalkup’s works (1983) and Johns (1992). Miscibility at the fi rst contact occurs in the reservoir if the original reservoir fl uid and injected gas are miscible. This means that all possible mixtures for initial compositions lead to forming of a single-phase system.
In case of condensing-drive process (CGD) the original reservoir fl uid and the in-jected gas are not miscible; later the miscibility could be obtained near the injection well. In this process intermediate components selectively may condensate from the gas injected to oil.
To illustrate the mixing process the triangle diagrams are used, dividing mixture composition into three component groups (Laciak & Nagy, 1995):
1) light components: C1 + CO2 + N22) intermediate components: C2 – C6 3) heavy components: C7+
Each vertex represents 100% content of component group. The arbitrary concentration between 0-100% is represented in the diagram in the form of an appropriate segment.
555
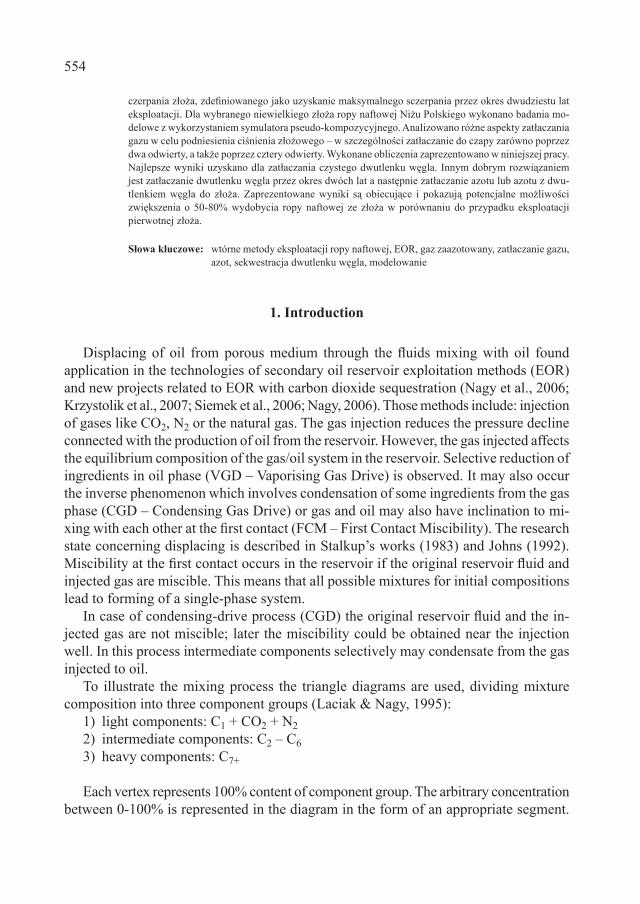
Bubble and dew curves for the specifi ed pressure and temperature values determine two-phase area, marked in the picture by the thick line, point C is the critical point of the pseudo-mixture.
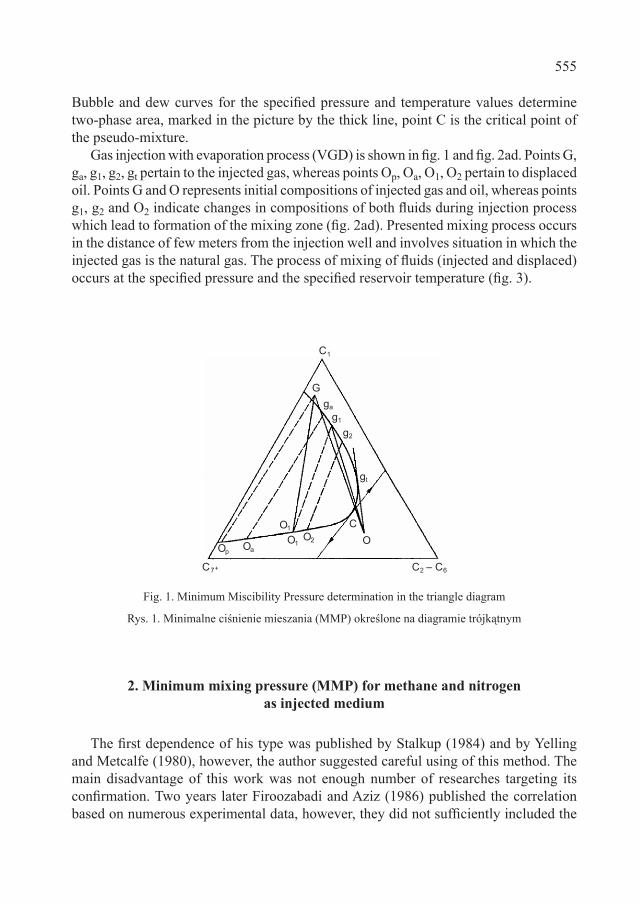
Gas injection with evaporation process (VGD) is shown in fi g. 1 and fi g. 2ad. Points G, ga, g1, g2, gt pertain to the injected gas, whereas points Op, Oa, O1, O2 pertain to displaced oil. Points G and O represents initial compositions of injected gas and oil, whereas points g1, g2 and O2 indicate changes in compositions of both fl uids during injection process which lead to formation of the mixing zone (fi g. 2ad). Presented mixing process occurs in the distance of few meters from the injection well and involves situation in which the injected gas is the natural gas. The process of mixing of fl uids (injected and displaced) occurs at the specifi ed pressure and the specifi ed reservoir temperature (fi g. 3).
Fig. 1. Minimum Miscibility Pressure determination in the triangle diagram
Rys. 1. Minimalne ciśnienie mieszania (MMP) określone na diagramie trójkątnym
2. Minimum mixing pressure (MMP) for methane and nitrogen as injected medium
The fi rst dependence of his type was published by Stalkup (1984) and by Yelling and Metcalfe (1980), however, the author suggested careful using of this method. The main disadvantage of this work was not enough number of researches targeting its confi rmation. Two years later Firoozabadi and Aziz (1986) published the correlation based on numerous experimental data, however, they did not suffi ciently included the
C1
C7+ C – C2 6
G
ga
g1
g2
gt
OOp
Oa
O1O2
O1C
556
Fig. 3. Minimum Miscibility Pressure as a function of oil and injection of gas compositions in the reservoir temperature
Rys. 3. Minimalne ciśnienie mieszania, jako funkcja własności ropy i zatłaczanego składu gazu dla temperatury złożowej
Fig. 2. Forming of mixing zone a. start of injection, b. start of mixing zone, c. continue of process, d. origin of mixing zones (Laciak, Nagy, 1995)
Rys. 2. Tworzenie strefy mieszania a. początek zatłaczania, b. początek tworzenia strefy mieszania, c. c.d. tworzenia strefy mieszania, d. utworzona strefa mieszania
G
G
O
O1
OO
O
a)
b)
c)
d)
O
g1
G
O1O
g2 Og1
O1
G g1 g2
g1
O
C1
C7+ C – C2 6
P1
PmP2
P > Pm > P1 2
O
557
temperature infl uence on MMP. Meanwhile Glaso (1985, 1988) and Emanuel et al. (1986) have proposed a number of MMP correlations for the natural gas, CO2 and N2. His work is based on the Benham et al. (1960) data. Unfortunately this correlation is not very accurate.
Numerous works involving MMP, nitrogen and natural gas as an injecting medium were published by Glaso (1988) and Hudgins et al. (1988) for nitrogen as a displacing fl uid, Nouar and Flock (1988) for the natural gas and Eakin and Mitch (1988) for all types of gases and mixing processes (CO2, N2 and natural gas). The work of Nouar and Flock (1988) differs widely from the other ones. The authors performed the very precise interpretation of three-component diagram for methane as the displacing gas. It is the graphical correlation, based on the numerous experimental data. Obtained results are convergent with those given by Hudgins et al. (1988).
The most important parameters having direct infl uence on mixing of the reservoir fl uid with nitrogen or the natural gas are: content of intermediate pseudo-components (hydrocarbons C2 – C6, CO2, H2S), molecular weight of heavy fractions MC7+ and temperature.
3. Problem of specifi cation of minima mixing pressure for oil reservoirs with gas cap and compositional grading reservoir fl uid
The extensive considerations according to the variation of the minimal mixing pressure are included in the Hoeier & Whitson (2001). Analysing MMP variation for the depth function, the variation of MMP reaches 10 MPa and is the depth function and MME (Minimum Miscibility Enrichment – see Zick (1986)). Such analysis could be performed after obtaining full and reliable thermodynamic data regarding the total composition of the reservoir fl uid attributed to the specifi ed depth.
4. Minimum mixing pressure for nitrogen for the hypothetical oil reservoir
Hanssen’s correlation was used for estimation of the minimal mixing pressure of the oil (light) and nitrogen system. Because of lack of total composition of the system, calculations should be treated with appropriate carefulness. In case of a Polish reservoir those values varies between 56 and 70 MPa (see Tab.1).
558
TABLE 1
Estimated minimal miscibility MMP pressure for the typical Polish reservoir from the Polish Lowland
TABLICA 1
Oszacowana minimalna wartość ciśnienia mieszania (MMP) dla typowego złoża ropy Niżu Polskiego
% of C2 – C6
Molecular mass C7+
MMP[MPa]
8.2 160 56.28 200 64.0
7.5 220 69.6
5. Negative and positive aspects of injecting nitrogen into reservoir
Numerous negative phenomenon’s were observed during injection of nitrogen into gas-condensate and light oil reservoirs (both in the laboratory scale and in the industry). The most important factors are following:
a) Increase of the minima mixing pressure in comparison with carbon dioxide, com-bustion gases or buffer injection of LPG with methane (see Hanssen, 1988);
b) Signifi cant decrease of effi ciency of the heaviest hydrocarbons in the reservoir re-covery; supplying nitrogen causes increase of constants of the lightest equilibrium and decrease of the heaviest components of the hydrocarbon system (Hagoort et. al., 1988; Boersma & Hagoort, 1994; Evison & Gilchrist, 1992).
The one of benefi t of nitrogen usage for injection (leading to increase of the reservoir pressure) is its availability. The second possibilities for source of nitrogen is separation from “nitrogen high content“ natural gas the cryogenic installations or adsorption me-thods.
In the possible EOR project development – case of injection of with CO2 may be useful. In the fi rst stage CO2 is injected and in the later phase classical nitrogen injection process may be consider (Donohoe & Buchanan, 1981; Eckles et al., 1981; Huang et al., 1986; Metcalfe at al., 1987, 1988; Peterson, 1978; Sanger et al., 1994; Sanger & Hagoort, 1998; Siregar et al., 1992).
6. Example of possible use of pure nitrogen, nitrogen-methane or nitrogen-carbon dioxide mixtures
The relatively high initial reservoir pressure encourages also to inject CO2-N2 mixture as an alternative to the basic case. In order to visualize these problems the numerical
559
model of one of Polish Lowland’s oil reservoirs which is located close to the potential high-nitrogen gas source was created.
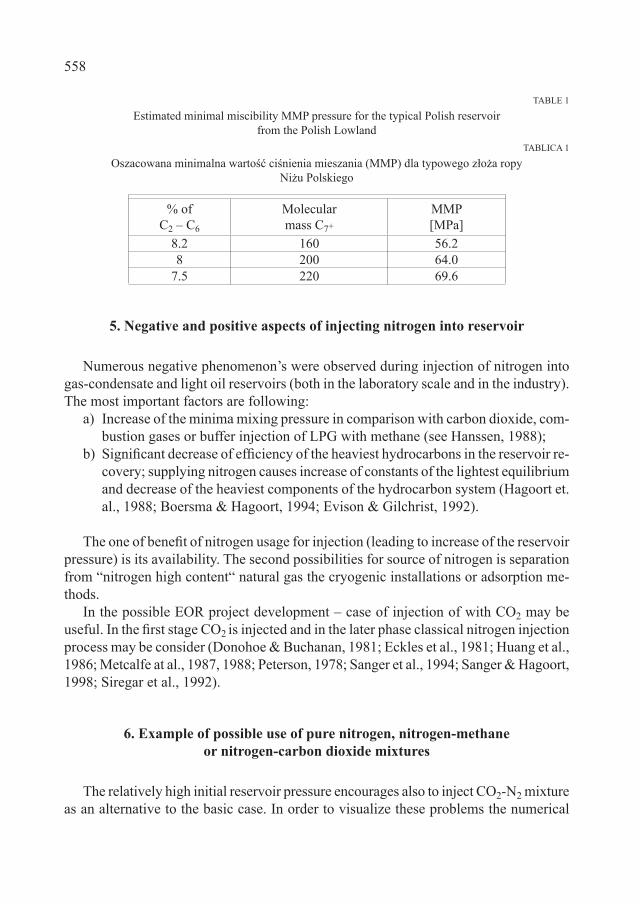
PVT Properties. The PVT properties were based on laboratory research and using the Peng-Robinson’s equation of state (modifi ed by Tsai-Chen.) was applied (Nagy, 2002). The saturation pressure and PVT properties of separated oil were matched. It was created a simplifi ed PVT model for 8 pseudo-components for use of Merlin simulator (Merlin, 2006).
TABLE 1
Modeled oil composition and fl ash composition (1 atm, 15°C) of liquid and gas composition of oil
TABLICA 2
Modelowany skład ropy naftowej i składy ropy i gazu po separacji (1 atm, 15°C)
Component Total composition (%)
Liquid composition (%)
Vapor composition (%)
CO2 0.588 0.017 0.857 N2 12.188 0.042 17.881 C1 35.905 0.272 52.605 C2 8.760 0.551 12.607 C3 4.879 0.183 7.080 C4-6 3.975 4.306 3.819 C7+1 8.411 15.501 5.088 C7+2 11.775 36.771 0.060 C7+3 13.515 42.353 4.4E-07
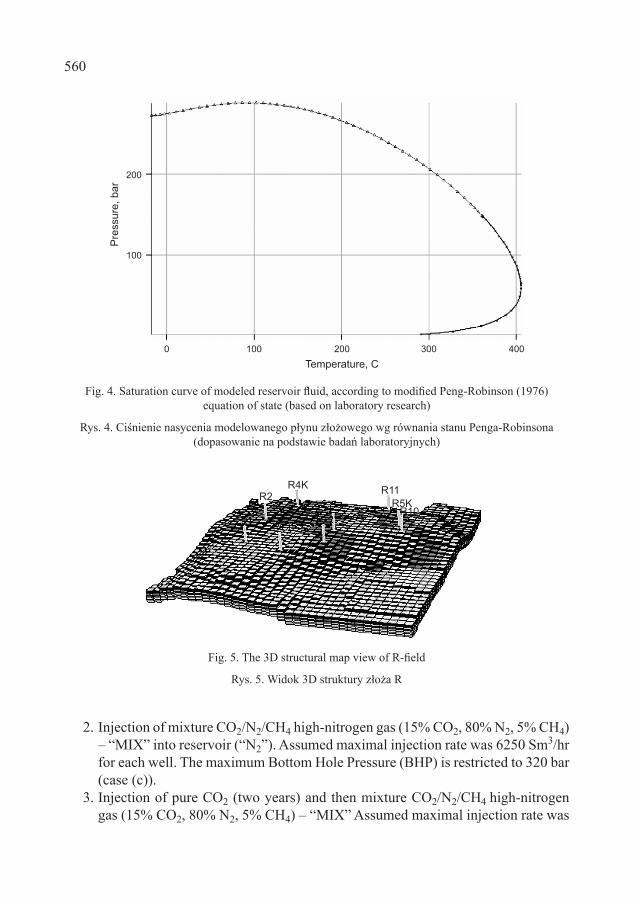
Geological data. The model was designed basing on seismic data, geological data, drilling data and exploitation data. The anticline reservoir was modeled by a 10-layer set. These layers have various hydrodynamics properties. Simplifi ed 3D anticline view is presented in fi g. 5 and cross-section of structure map passing through well R-3 is presented in fi g. 6. The hydrodynamic properties, as well as porosity and saturation of oil and water were introduced into the model. Static data related to the reserves are fi tted in the model. Available date from the past has been used to made history match in the project.
Simulation models used in this study. Basic case (a) – no secondary method in oil reservoir exploitation process: This case was created the model of reservoir simulation that was exploited by 4 wells with an total initial rate of 290 Sm3/day* and Gas-Oil-Ratio (GOR) of approx. 180 Sm3/mn
3** through the period of 20 years. Cases with two injection wells for injection into gas-cap:1. Injection of high-nitrogen gas (95% N2, 5% CH4) into reservoir (“N2”). Assumed
maximal injection rate was 6250 Sm3/hr for each well. The maximum Bottom Hole Pressure (BHP) is restricted to 320 bar (case (b)).
* Sm3 – cubuc meter measured at 1.01325 bar and 15°C** mn
3 – normal cubuc meter measured at 1.01325 bar and 0°C
560
2. Injection of mixture CO2/N2/CH4 high-nitrogen gas (15% CO2, 80% N2, 5% CH4) – “MIX” into reservoir (“N2”). Assumed maximal injection rate was 6250 Sm3/hr for each well. The maximum Bottom Hole Pressure (BHP) is restricted to 320 bar (case (c)).
3. Injection of pure CO2 (two years) and then mixture CO2/N2/CH4 high-nitrogen gas (15% CO2, 80% N2, 5% CH4) – “MIX” Assumed maximal injection rate was
Fig. 5. The 3D structural map view of R-fi eld
Rys. 5. Widok 3D struktury złoża R
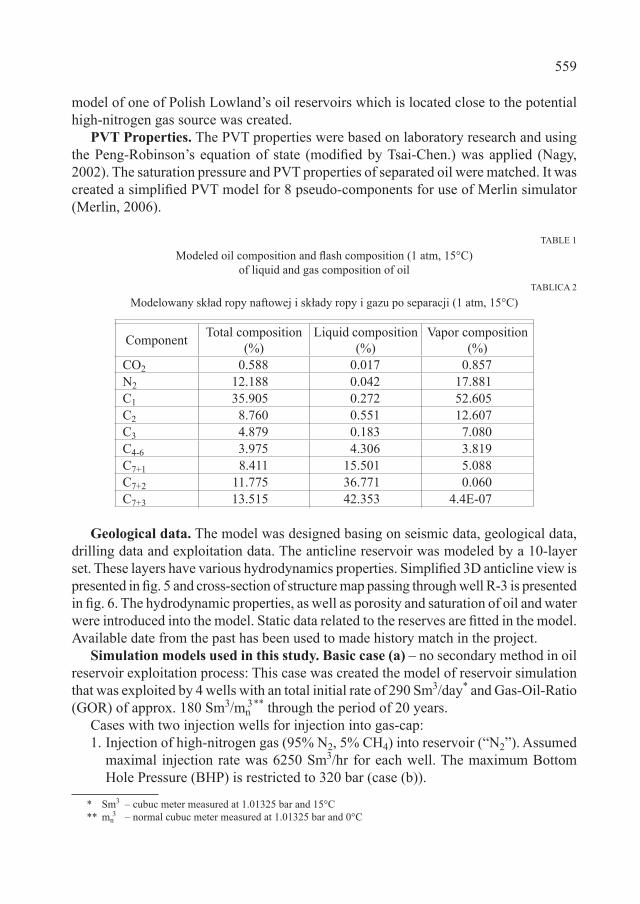
Fig. 4. Saturation curve of modeled reservoir fl uid, according to modifi ed Peng-Robinson (1976) equation of state (based on laboratory research)
Rys. 4. Ciśnienie nasycenia modelowanego płynu złożowego wg równania stanu Penga-Robinsona (dopasowanie na podstawie badań laboratoryjnych)
200
100
0 100 200 300 400
Temperature, C
Pre
ssure
,bar
R2R4K
R11
R5KR10
561
6250 Sm3/hr for each well. The maximum Bottom Hole Pressure (BHP) is restricted to 320 bar (case (d)).
The calculation has been applied also to cases with four injection wells for injection into gas-cap:
1. Injection of pure carbon dioxide into reservoir (“CO2”). Assumed maximal injection rate was 6250 Sm3/hr for each well. The maximum Bottom Hole Pressure (BHP) is restricted to 320 bar (case (b)).
2. Injection of mixture CO2/N2/CH4 high-nitrogen gas (15% CO2, 80% N2, 5% CH4) – “MIX” into reservoir (“N2”). Assumed maximal injection rate was 6250. Sm3/hr for each well. The maximum Bottom Hole Pressure (BHP) is restricted to 320 bar (case (c)).
3. Injection of pure CO2 (two years) and then mixture of high-nitrogen gas (95% N2, 5% CH4) – “N2” Assumed maximal injection rate was 6250 Sm3/hr for each well. The maximum Bottom Hole Pressure (BHP) is restricted to 320 bar (case (d)).
4. Injection of pure CO2 (two years) and then mixture CO2/N2/CH4 high-nitrogen gas (15% CO2, 80% N2, 5% CH4) – “MIX” Assumed maximal injection rate was 6250 Sm3/hr for each well. The maximum Bottom Hole Pressure (BHP) is restricted to 320 bar (case (e)).
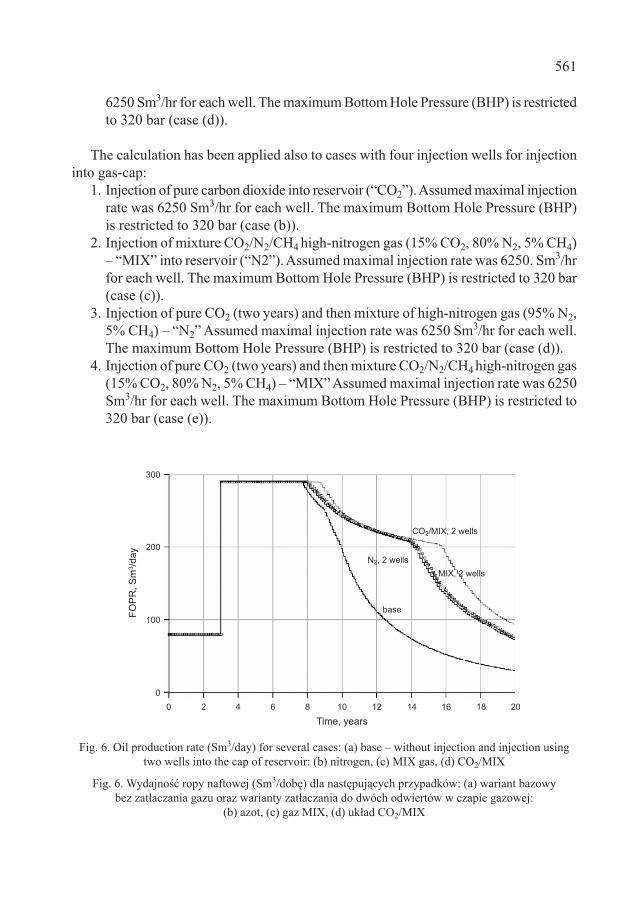
Fig. 6. Oil production rate (Sm3/day) for several cases: (a) base – without injection and injection using two wells into the cap of reservoir: (b) nitrogen, (c) MIX gas, (d) CO2/MIX
Fig. 6. Wydajność ropy naftowej (Sm3/dobę) dla następujących przypadków: (a) wariant bazowy bez zatłaczania gazu oraz warianty zatłaczania do dwóch odwiertów w czapie gazowej:
(b) azot, (c) gaz MIX, (d) układ CO2/MIX
0
100
200
300
0 2 4 6 8 10 12 14 16 18 20
Time, years
FO
PR
,S
m/d
ay
3
CO /MIX, 2 wells2
N , 2 wells2
MIX, 2 wells
base
562
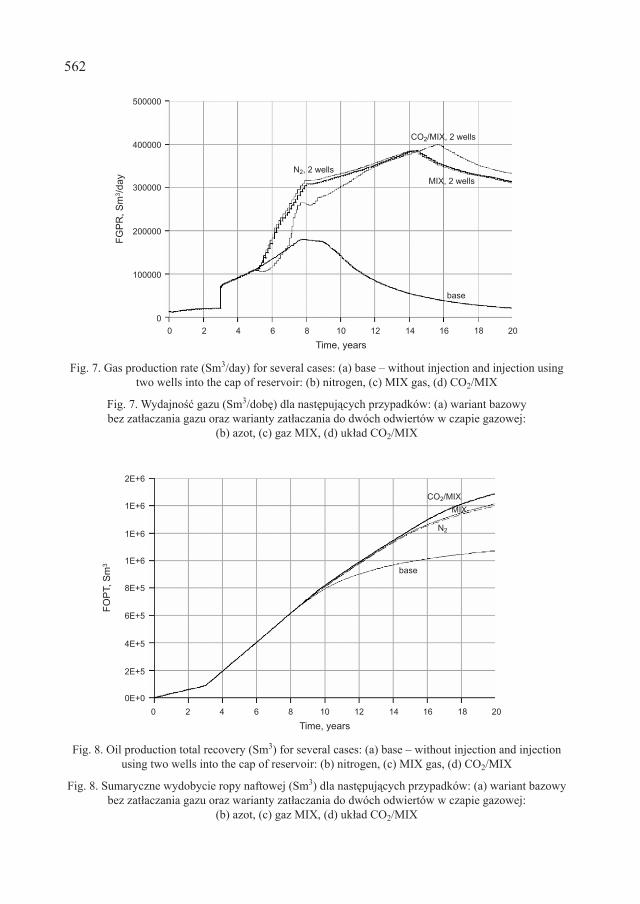
Fig. 8. Oil production total recovery (Sm3) for several cases: (a) base – without injection and injection using two wells into the cap of reservoir: (b) nitrogen, (c) MIX gas, (d) CO2/MIX
Fig. 8. Sumaryczne wydobycie ropy naftowej (Sm3) dla następujących przypadków: (a) wariant bazowy bez zatłaczania gazu oraz warianty zatłaczania do dwóch odwiertów w czapie gazowej:
(b) azot, (c) gaz MIX, (d) układ CO2/MIX
Fig. 7. Gas production rate (Sm3/day) for several cases: (a) base – without injection and injection using two wells into the cap of reservoir: (b) nitrogen, (c) MIX gas, (d) CO2/MIX
Fig. 7. Wydajność gazu (Sm3/dobę) dla następujących przypadków: (a) wariant bazowy bez zatłaczania gazu oraz warianty zatłaczania do dwóch odwiertów w czapie gazowej:
(b) azot, (c) gaz MIX, (d) układ CO2/MIX
0 2 4 6 8 10 12 14 16 18 20
Time, years
CO /MIX, 2 wells2
N , 2 wells2
MIX, 2 wells
base
FG
PR
,S
m/d
ay
3
0
100000
200000
300000
400000
500000
0 2 4 6 8 10 12 14 16 18 20
Time, years
CO /MIX2
N2
MIX
base
2E+6
1E+6
1E+6
1E+6
8E+5
6E+5
4E+5
2E+5
0E+0
FO
PT,
Sm
3
563
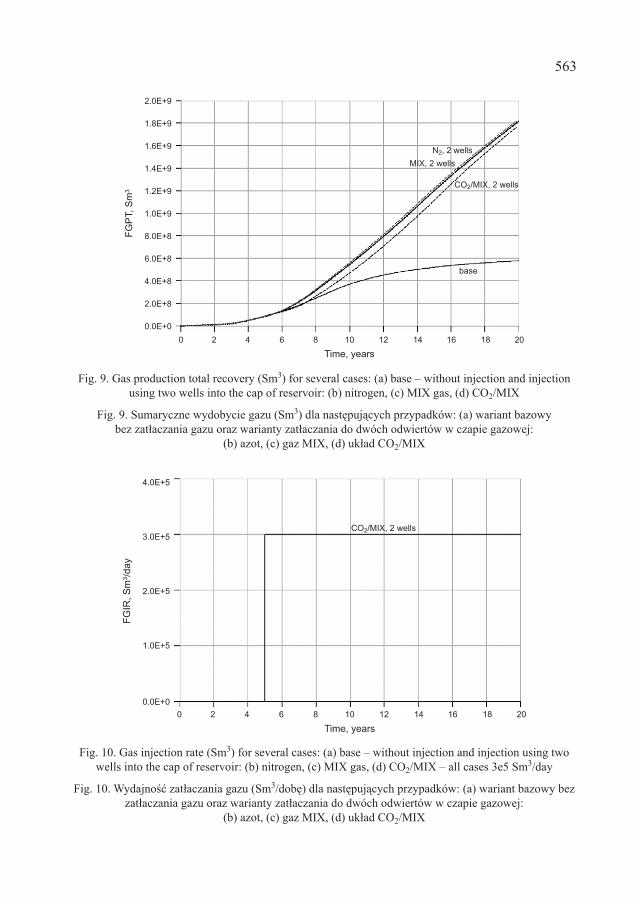
Fig. 10. Gas injection rate (Sm3) for several cases: (a) base – without injection and injection using two wells into the cap of reservoir: (b) nitrogen, (c) MIX gas, (d) CO2/MIX – all cases 3e5 Sm3/day
Fig. 10. Wydajność zatłaczania gazu (Sm3/dobę) dla następujących przypadków: (a) wariant bazowy bez zatłaczania gazu oraz warianty zatłaczania do dwóch odwiertów w czapie gazowej:
(b) azot, (c) gaz MIX, (d) układ CO2/MIX
Fig. 9. Gas production total recovery (Sm3) for several cases: (a) base – without injection and injection using two wells into the cap of reservoir: (b) nitrogen, (c) MIX gas, (d) CO2/MIX
Fig. 9. Sumaryczne wydobycie gazu (Sm3) dla następujących przypadków: (a) wariant bazowy bez zatłaczania gazu oraz warianty zatłaczania do dwóch odwiertów w czapie gazowej:
(b) azot, (c) gaz MIX, (d) układ CO2/MIX
0 2 4 6 8 10 12 14 16 18 20
Time, years
CO /MIX, 2 wells2
N , 2 wells2
MIX, 2 wells
base
FG
PT,S
m3
2.0E+9
1.8E+9
1.6E+9
1.4E+9
1.2E+9
1.0E+9
8.0E+8
6.0E+8
4.0E+8
2.0E+8
0.0E+0
0 2 4 6 8 10 12 14 16 18 20
Time, years
CO /MIX, 2 wells2
0.0E+0
1.0E+5
2.0E+5
3.0E+5
4.0E+5
FG
IR,
Sm
/da
y3
564
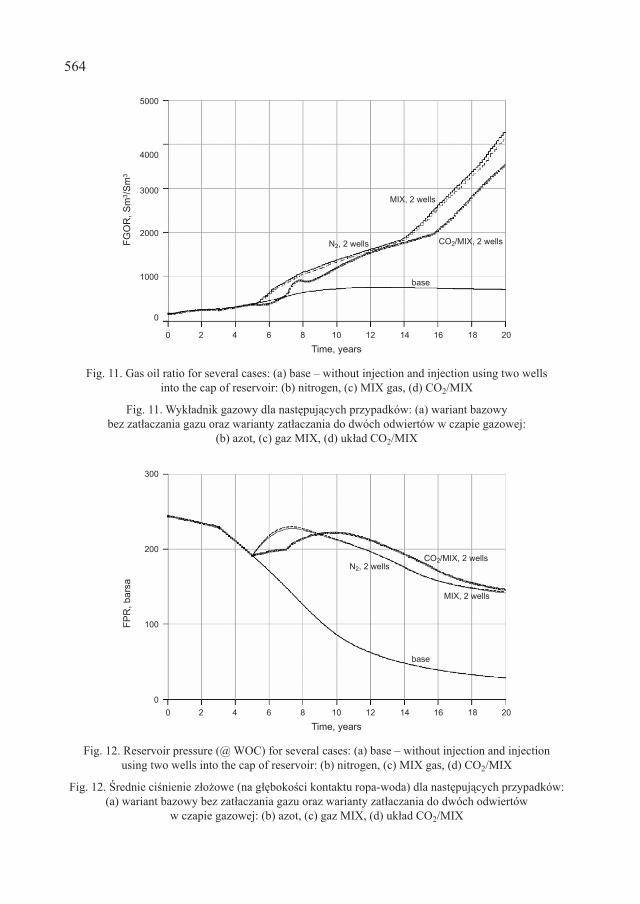
Fig. 12. Reservoir pressure (@ WOC) for several cases: (a) base – without injection and injection using two wells into the cap of reservoir: (b) nitrogen, (c) MIX gas, (d) CO2/MIX
Fig. 12. Średnie ciśnienie złożowe (na głębokości kontaktu ropa-woda) dla następujących przypadków: (a) wariant bazowy bez zatłaczania gazu oraz warianty zatłaczania do dwóch odwiertów
w czapie gazowej: (b) azot, (c) gaz MIX, (d) układ CO2/MIX
Fig. 11. Gas oil ratio for several cases: (a) base – without injection and injection using two wells into the cap of reservoir: (b) nitrogen, (c) MIX gas, (d) CO2/MIX
Fig. 11. Wykładnik gazowy dla następujących przypadków: (a) wariant bazowy bez zatłaczania gazu oraz warianty zatłaczania do dwóch odwiertów w czapie gazowej:
(b) azot, (c) gaz MIX, (d) układ CO2/MIX
0 2 4 6 8 10 12 14 16 18 20
Time, years
CO /MIX, 2 wells2N , 2 wells2
MIX, 2 wells
base
FG
OR
,/S
m3
Sm
3
0
1000
2000
3000
4000
5000
0 2 4 6 8 10 12 14 16 18 20
Time, years
CO /MIX, 2 wells2N , 2 wells2
MIX, 2 wells
base
FP
R,bars
a
0
100
200
300
565
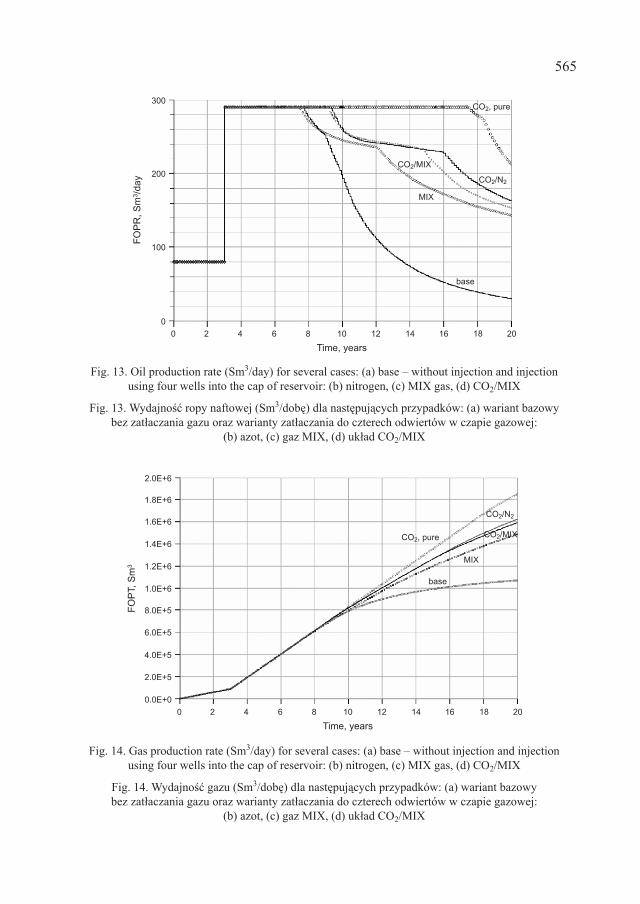
Fig. 14. Gas production rate (Sm3/day) for several cases: (a) base – without injection and injection using four wells into the cap of reservoir: (b) nitrogen, (c) MIX gas, (d) CO2/MIX
Fig. 14. Wydajność gazu (Sm3/dobę) dla następujących przypadków: (a) wariant bazowy bez zatłaczania gazu oraz warianty zatłaczania do czterech odwiertów w czapie gazowej:
(b) azot, (c) gaz MIX, (d) układ CO2/MIX
Fig. 13. Oil production rate (Sm3/day) for several cases: (a) base – without injection and injection using four wells into the cap of reservoir: (b) nitrogen, (c) MIX gas, (d) CO2/MIX
Fig. 13. Wydajność ropy naftowej (Sm3/dobę) dla następujących przypadków: (a) wariant bazowy bez zatłaczania gazu oraz warianty zatłaczania do czterech odwiertów w czapie gazowej:
(b) azot, (c) gaz MIX, (d) układ CO2/MIX
0 2 4 6 8 10 12 14 16 18 20
Time, years
CO /2 N2
base
0
100
200
300CO , pure2
CO /MIX2
MIX
FO
PR
,S
m/d
ay
3
0 2 4 6 8 10 12 14 16 18 20
Time, years
CO /2 N2
base
CO , pure2CO /MIX2
MIX
2.0E+6
1.8E+6
1.6E+6
1.4E+6
1.2E+6
1.0E+6
8.0E+5
6.0E+5
4.0E+5
2.0E+5
0.0E+0
FO
PT,S
m3
566
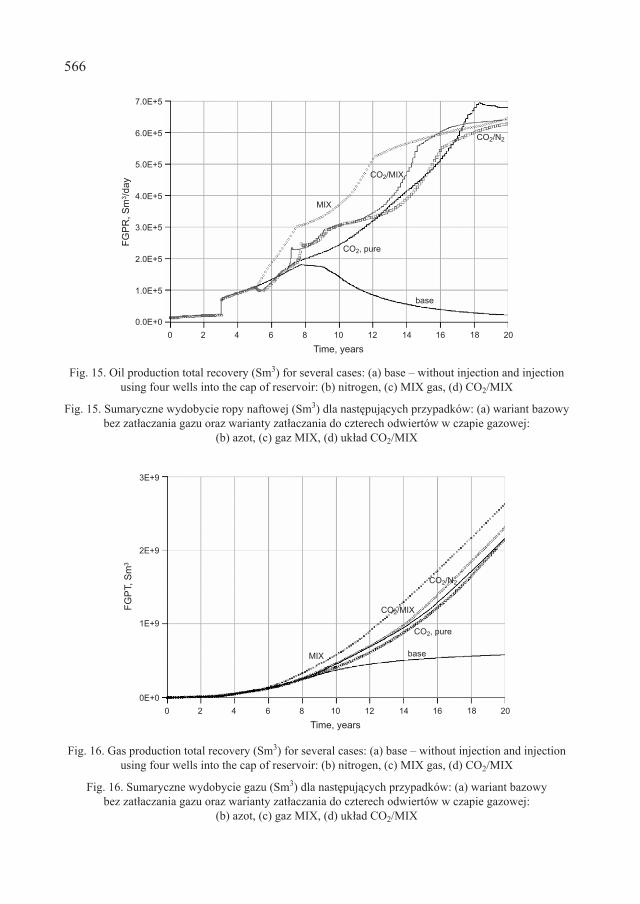
Fig. 16. Gas production total recovery (Sm3) for several cases: (a) base – without injection and injection using four wells into the cap of reservoir: (b) nitrogen, (c) MIX gas, (d) CO2/MIX
Fig. 16. Sumaryczne wydobycie gazu (Sm3) dla następujących przypadków: (a) wariant bazowy bez zatłaczania gazu oraz warianty zatłaczania do czterech odwiertów w czapie gazowej:
(b) azot, (c) gaz MIX, (d) układ CO2/MIX
Fig. 15. Oil production total recovery (Sm3) for several cases: (a) base – without injection and injection using four wells into the cap of reservoir: (b) nitrogen, (c) MIX gas, (d) CO2/MIX
Fig. 15. Sumaryczne wydobycie ropy naftowej (Sm3) dla następujących przypadków: (a) wariant bazowy bez zatłaczania gazu oraz warianty zatłaczania do czterech odwiertów w czapie gazowej:
(b) azot, (c) gaz MIX, (d) układ CO2/MIX
0 2 4 6 8 10 12 14 16 18 20
Time, years
CO /2 N2
base
CO , pure2
CO /MIX2
MIX
2.0E+5
0.0E+0
FG
PR
,S
m/d
ay
3
3.0E+5
4.0E+5
5.0E+5
6.0E+5
7.0E+5
1.0E+5
0 2 4 6 8 10 12 14 16 18 20
Time, years
CO /2 N2
base
CO , pure2
CO /MIX2
MIX
0E+0
FG
PT,S
m3
1E+9
2E+9
3E+9
567
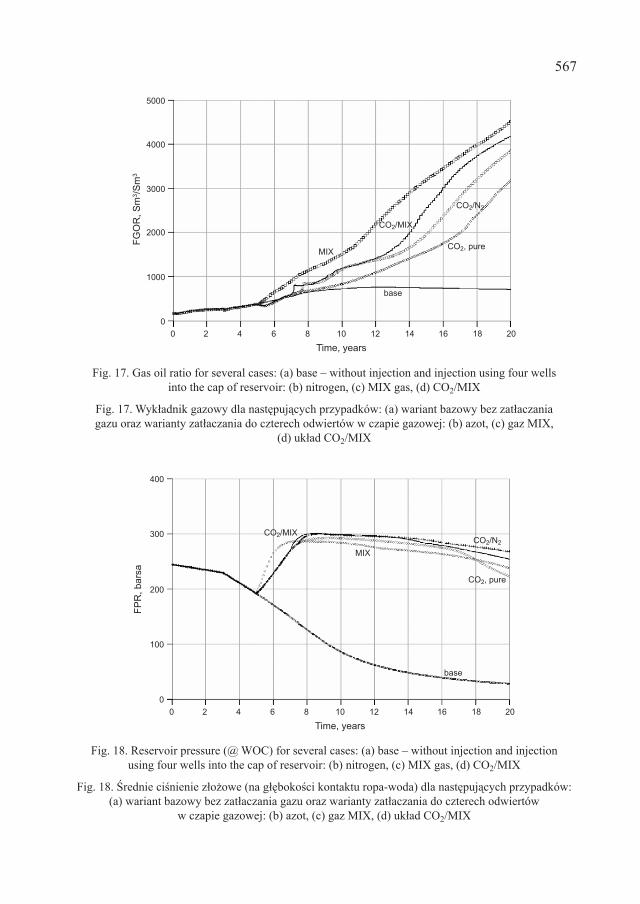
Fig. 18. Reservoir pressure (@ WOC) for several cases: (a) base – without injection and injection using four wells into the cap of reservoir: (b) nitrogen, (c) MIX gas, (d) CO2/MIX
Fig. 18. Średnie ciśnienie złożowe (na głębokości kontaktu ropa-woda) dla następujących przypadków: (a) wariant bazowy bez zatłaczania gazu oraz warianty zatłaczania do czterech odwiertów
w czapie gazowej: (b) azot, (c) gaz MIX, (d) układ CO2/MIX
Fig. 17. Gas oil ratio for several cases: (a) base – without injection and injection using four wells into the cap of reservoir: (b) nitrogen, (c) MIX gas, (d) CO2/MIX
Fig. 17. Wykładnik gazowy dla następujących przypadków: (a) wariant bazowy bez zatłaczania gazu oraz warianty zatłaczania do czterech odwiertów w czapie gazowej: (b) azot, (c) gaz MIX,
(d) układ CO2/MIX
0 2 4 6 8 10 12 14 16 18 20
Time, years
CO /2 N2
base
0
1000
2000
3000
CO , pure2
CO /MIX2
MIX
FG
OR
,S
m/
3S
m3
4000
5000
0 2 4 6 8 10 12 14 16 18 20
Time, years
CO /2 N2
base
0
100
200
300
CO , pure2
CO /MIX2
MIX
FP
R,bars
a
400
568
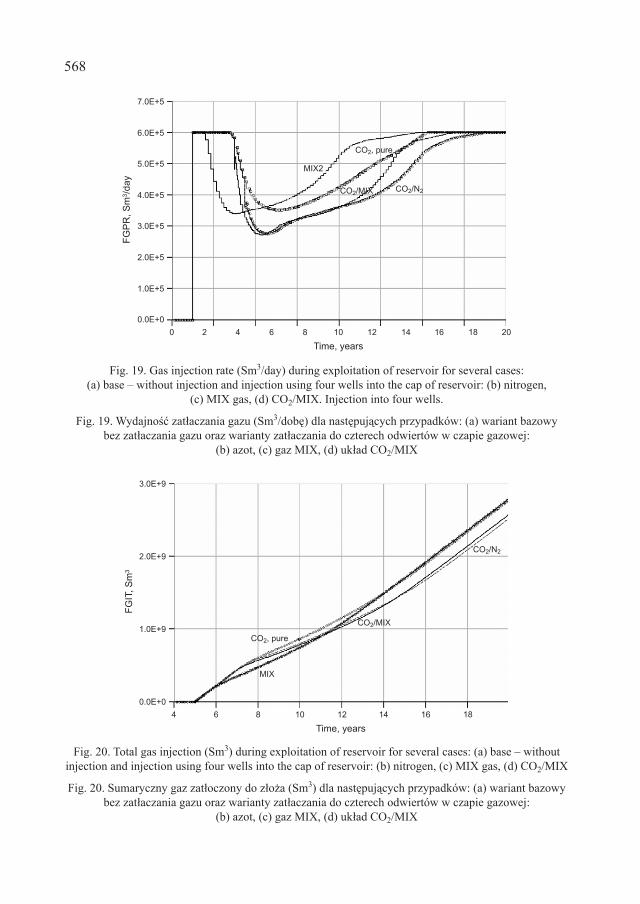
Fig. 20. Total gas injection (Sm3) during exploitation of reservoir for several cases: (a) base – without injection and injection using four wells into the cap of reservoir: (b) nitrogen, (c) MIX gas, (d) CO2/MIX
Fig. 20. Sumaryczny gaz zatłoczony do złoża (Sm3) dla następujących przypadków: (a) wariant bazowy bez zatłaczania gazu oraz warianty zatłaczania do czterech odwiertów w czapie gazowej:
(b) azot, (c) gaz MIX, (d) układ CO2/MIX
Fig. 19. Gas injection rate (Sm3/day) during exploitation of reservoir for several cases: (a) base – without injection and injection using four wells into the cap of reservoir: (b) nitrogen,
(c) MIX gas, (d) CO2/MIX. Injection into four wells.
Fig. 19. Wydajność zatłaczania gazu (Sm3/dobę) dla następujących przypadków: (a) wariant bazowy bez zatłaczania gazu oraz warianty zatłaczania do czterech odwiertów w czapie gazowej:
(b) azot, (c) gaz MIX, (d) układ CO2/MIX
0 2 4 6 8 10 12 14 16 18 20
Time, years
CO /2 N2
CO , pure2
CO /MIX2
MIX2
FG
PR
,S
m/d
ay
3
2.0E+5
0.0E+0
3.0E+5
4.0E+5
5.0E+5
6.0E+5
7.0E+5
1.0E+5
4 6 8 10 12 14 16 18
Time, years
CO /2 N2
CO , pure2
CO /MIX2
MIX
FG
IT,
Sm
3
0.0E+0
1.0E+9
2.0E+9
3.0E+9
569
7. Analysis of results of modeling
The analyses fi eld production/injection process (a-d) into two wells – without and with injection of gas mixture processes are presented in the fi gs. 6-12. The fi g. 6 and 7 show oil and gas production rate (Sm3/day) for several cases: (a) base – without injec-tion and injection using two wells into the cap of reservoir: (b) nitrogen, (c) MIX gas, (d) CO2/MIX.
The total production of oil and gas during this process is presented in the fi g. 8 and 9. Oil production rate is declining in the late period of exploitation for most cases. Only
the last case (7) allows maintaining oil production rate. The gas injection rate (Sm3) for several cases: (a) base- without injection and injection using two wells into the cap of reservoir: (b) nitrogen, (c) MIX gas, (d) CO2/MIX – all cases 3e5 Sm3/day – is presen-ted in fi g. 10. Fig. 11 shows predicted gas oil ratio for several cases: (a) base- without injection and injection using two wells into the cap of reservoir: (b) nitrogen, (c) MIX gas, (d) CO2/MIX. The average reservoir pressure for several cases: (a) base- without injection and injection using two wells into the cap of reservoir: (b) nitrogen, (c) MIX gas, (d) CO2/MIX is given in fi g. 12.
The analyses fi eld production/injection process (a-e) into four wells – without and with injection of gas mixture processes are presented in the fi gs. 13-20. The fi gures 13 and 14 show oil and gas production rate (Sm3/day) for following cases: (a) base – without injection and injection using four wells into the cap of reservoir: (b) nitrogen, (c) MIX gas, (d) CO2/MIX. The total production of oil and gas during this process is presented in the fi g. 15 and 16. Fig. 17 shows apparent gas oil ratio for cases: (a) base – without injection and injection using four wells into the cap of reservoir: (b) nitrogen, (c) MIX gas, (d) CO2/MIX. Reservoir pressure for cases: (a) base – without injection and injec-tion using four wells into the cap of reservoir: (b) nitrogen, (c) MIX gas, (d) CO2/MIX – is given in fi g. 18. Gas injection rate (Sm3/day) and total gas injection (Sm3) during exploitation of reservoir for cases: (a) base – without injection and injection using four wells into the cap of reservoir: (b) nitrogen, (c) MIX gas, (d) CO2/MIX is presented in fi gures 19 and 20.
The most interested effect is achieved by injection (1) pure carbon dioxide and (2). Carbon-dioxide-high-nitrogen gas containing 80% of CO2, 15% N2 and 5% of CH4 followed by injection of pure carbon dioxide in supercritical phase.
Created model of reservoir simulation of reservoir exploited with four production wells and four injection well with maintained reservoir pressure is one of the best, but the difference between injection of CO2 slug/N2/MIX cases for 4 and 2 wells is below 15% (see fi g. 8 and fi g. 14).
570
8. Conclusions
Maximal plateau has been observed during injection of pure CO2 into reservoir – until 17th year of production and small decline in the last three years – by 20% – is observed (fi g. 6 or fi g. 12). The minimal patou has been obtained by injection of MIX and N2 streams. In this case after 8th year of oil production a declining production has been observed up to 50% of initial value.
The negative aspect of presented EOR method is relative short breakthrough of gas (c.a. 2 years). The longest non breakthrough time is estimated for CO2, and very short time is observed for low quality streams: “Mix” and “N2”. This is evident explanation of worse oil recovery factor for those cases.
The best results were obtained for the injection of the pure carbon dioxide in super-critical phase. Other satisfactory solution involves injection of carbon dioxide through two years (slug), and after that injection of nitrogen or the mixture of carbon dioxide and nitrogen. The presented results are promising and show potential possibilities of rising oil recovery factor by 50-80% with reference to the primary oil explaitation case without gas injection
Acknowledgements
This study is funded by the Ministry of Science and Higher Education grant: R09 02301.
REFERENCES
B e n h a m A.L., D o w d e n W.E., K u n z m a n W.J., 1960. Miscible Fluid Displacement-Prediction of Miscibility. Trans., AIME.
B o e r s m a D.M., H a g o o r t J., 1994. Displacement Characteristics of Nitrogen vs. Methane Flooding in Volatile-Oil Reservoirs, SPERE (November 1994) 261.
D o n o h o e C.W., B u c h a n a n R.D., 1981. Economic Evaluation of Cycling Gas-Condensate Reservoirs with Nitrogen, JPT (February 1981) 263.
E a k i n B.E., M i t c , F.J., 1988. Measurements and Correlation of Miscibility Pressures of Reservoir Oil SPE Paper No 18065, 63rd Ann.Techn.Conf. and Exhibition of SPE, Huston (Oct.1988).
E c k l e s W.W. Jr., P r i h o d a C., H o l d e n W.W., 1981. Unique Enhanced Oil and Gas Recovery for Very High-Pressure Wilcox Sands Uses Cryogenic Nitrogen and Methane Mixture, JPT (June 1981) 971.
E m a n u e l A.S., B e h r e n s R.A., Mc M i l l e n T.J., 1986. A Generalized Method for Predicting Gas\Oil Miscibility, SPERE.
E v i s o n B., G i l c h r i s t R.E., 1992. New Developments in Nitrogen in the Oil Industry, paper SPE 24313 presented at the 1992 SPE Mid- Continent Gas Symposium, Amarillo, Texas, 13-14 April.
F i r o o z a b a d i A., A z i z K., 1986. Analysis and Correlation of Nitrogen and Lean-Gas Miscibility Pressure, SPERE (Nov. 1986).
G l a s o ∅., 1985. Generalized Minimum Miscibility Pressure Correlation, SPEJ (Dec. 1985).G l a s o ∅., 1988. Miscible Displacement: Recovery Tests with Nitrogen, SPE Paper No 17378 SPE/DOE Sixth
Symposium on EOR of SPE and Department of Energy, Tulsa (April 1988).
571
H a g o o r t J., B r i n k h o r s t J.W., van der K l e y n P.H., 1988. Development of an Offshore Gas Condensate Reservoir by Nitrogen Injection vis- a`-vis Pressure Depletion, JPT (April 1988) 463.
H a n s s e n J.E., 1988. Nitrogen as a Low – Cost Replacement for Natural Gas Reinjection Offshore, SPE Paper No 17709, Gas Technology Symposium, Dallas (June, 1988).
H o i e r L., W h i t s o n C.H., 2001. Miscibility Variation in Compositional Grading Reservoirs, SPE Reservoir Evaluation & Engineering, Feb. 2001, p. 36-43.
H u a n g W.W., B e l l a m y R.B., O h n i m u s S.W., 1986. A Study of Nitrogen Injection for Increased Recovery From a Rich Retrograde Gas/ Volatile Oil Reservoir, paper SPE 14059 presented at the 1986 SPE International Meeting on Petroleum Engineering, Beijing, 17-20 March.
H u d g i n s D.A., L e a v e F.M., C h u n g F.T.H., 1988. Nitrogen Miscible Displacement of Light Crude Oil: a Laboratory Study. SPE Paper No 17372 SPE/DOE Sixth Symposium on EOR of SPE and Department of Energy, Tulsa (April 1988).
J o h n s R.T., 1992. Analytical Theory of Multicomponent Gas Drives with Two-Phase Mass Transfer, PhD thesis, Stanford U., Stanford, California, (May 1992).
K r z y s t o l i k P., N a g y S., S i e m e k J., J u r a B., 2007. State of art of carbon dioxide sequestration processes in Poland, Al-Azhar Engineering: ninth International Conference: April 12-14, 2007, Cairo, Egypt.
L a c i a k M., N a g y S., 1995. Prediction of the Minimum Miscibility Pressure pf Nitrogen/Oil and Lean Gas/Oil Miscibility, Archives of Mining Sciences, 1995, Vol. 40, Iss. 4, p. 503-515.
Merlin PC, user guide for black-oil reservoir simulator system with pseudo-compositional components, Gemini S.I., 2006.
M e t c a l f e R.S. et al., 1987. Displacement of a Rich Gas Condensate by Nitrogen, SPE Paper No 16714, 62nd Ann. Techn. Conf., Dallas.
M e t c a l f e R.S., Vo g e l J.L., M o r r i s R.W., 1988. Compositional Gradients in the Anschutz Range East Field, SPERE (August 1988) 1025; Trans., AIME, 285.
N a g y S., 2002. Capillary adsorption effects in gas condensate systems in tight rocks, Archives of Mining Sciences, vol. 47, iss. 2, s. 205–253.
N a g y S., 2006. Use of carbon dioxide in underground natural gas storage processes, Acta Montanistica Slovaca.. N a g y S., O l a j o s s y A., S i e m e k J., 2006. Use of nitrogen and carbon dioxide injection in exploitation of light
oil reservoirs, Acta Montanistica Slovaca, R. 11, 1 s. 120-124.N o u a r A., F l o c k D.L., 1988. Prediction of the Minimum Miscibility Pressure of a Vaporizing Gas Drive, SPERE
(Feb.1988).P e n g D.Y., R o b i n s o n D.B., 1976. A New Two-Constant Equation of State, Ind. Eng. Chem. Fund., 15, No. 1, 59. P e t e r s o n A.V., 1978. Optimal Recovery Experiments With N2 and CO2, Pet.Eng.Intl. (Nov. 1978).S a n g e r P., H a g o o r t J., 1998. Recovery of Gas Condensate by Nitrogen Injection Compared With Methane Injection,
SPE Journal, March 1998, p. 26.S a n g e r P.J., B j ø r n s t a d H.K., H a g o o r t J., 1994. Nitrogen Injection Into Stratifi ed Gas-Condensate Reservoirs,
paper SPE 28941 presented at the 1994 SPE Annual Technical Conference and Exhibition, New Orleans, 25-28 September.
S i e m e k J., N a g y S., Z a w i s z a L., 2006. Carbon dioxide sequestration by injection to various geological reservoirs, Acta Montanistica Slovaca, R. 11, s. 172-177.
S i r e g a r S., H a g o o r t J., R o n d e H., 1992. Nitrogen Injection vs. Gas Cycling in Rich Retrograde Condensate-Gas Reservoirs, paper SPE 22360 presented at the 1992 SPE International Meeting on Petroleum Engineering, Beijing, 24–27 March.
S t a l k u p E.I.Jr., 1983. Miscible Displacement, Monograph volume 8, L. Henry, Doherty Memorial Fund of AIME, SPE (1983).
Ye l l i n g W.F., M e t c a l f e R.S., 1980. Determination and Prediction of CO2 Minimum Miscibility Pressures, JPT.Z i c k A.A., 1986. A Combined Condensing/Vaporizing Mechanism In The Displacement Of Oil By Enriched Gases,
paper SPE 15493.
Received: 24 April 2007


![´sl |z|£| { ?£| s s7~ V | l 7 z§ ( { |z|{|³ C Ë 7 Ë ... · 9 l / l h Ë£| s(ê´~¨ å.· z (· 0 & «.132] 4 - 52 PÂ. 6 52] 4 5 32 PÂ.- 32] 4 - 5276 ©;> ! >](https://static.fdocuments.pl/doc/165x107/5ec4076eb5bd245b32275ed1/sl-z-s-s7-v-l-7-z-z-c-7-9-l-l-h-s.jpg)