X C Kenji Hirose , HenryShion , Mellisa Ly , Nilini ... · TO DOWNLOAD A COPY OF THIS POSTER, VISIT...
1
TO DOWNLOAD A COPY OF THIS POSTER, VISIT WWW.WATERS.COM/POSTERS ©2019 Waters Corporation MKT19103 ٳর੨ ਫ୬ (Shota Nakamura) 1 , ઌ (Maki Terasaki) 1 , ཛྷ (Kenji Hirose) 1 , HenryShion 2 , Mellisa Ly 3 , Nilini Ranbaduge 2 , Ximo Zhang 2 , Yun Alelyunas 2 , Jonathan Pugh 2 , Robert Lewis 2 , Jill Lord 2 , Mark Halifax 2 , Nick Tomczyk 2 , Dale C. Shepherd 2 , Laetitia Denbigh 2 , Yu Ying Qing 2 , Jason Rouse 3 , Weibin Chen 2 1 ম崎崑嵤崧嵤崢ઙভ űƌƋƒƑ źƄƗƈƕƖ Ůő Ůő 2 Waters Corporation 3 Biotherapeutics Pharmaceutical Sciences, Pfizer, Inc த৵ৈীચସীෲ峘ো峕峲峵崸崌崒ఇષ৫峘峘ৠ Meeting the Challenges of Implementing Accurate-Mass Mass Spectrometry for Biotherapeutic Development in Regulated/non-Regulated Environments INTRODUCTION ¨ Despite the widespread practice of exact-mass mass spectrometry (MS) analysis in the biotheropeutics development processes, experienced MS users are typically required to manage the instrument operation, data processing, and interpretation. ¨ There are major challenges for the adoption of MS by analysts in the late step development and quality control (QC) environment, who are often more familiar with optical detection methods, such as the inherent complexities of MS technology, and the lack of compliance-ready informatics platforms that are capable of converting raw MS data into product quality attribute results seamlessly. ¨ In this study, we report the development of a new high performance bench-top orthogonal acceleration time-of-flight (oa-TOF) LC-MS system (BioAccord) with simplified and optimized operation modes to deliver automated, accurate, and reproducible mass measurements for proteins, peptides, and released glycans to address these challenges. LC/MS: The BioAccord System is comprised of a Waters ACQUITY™ UPLC™ system, with either the Tunable UV (TUV) Detector (intact, subunit and peptide mapping analysis) or the Fluorescence (FLR) detector (released glycan analysis), and the oa-TOF (Acquity RDa) MS instrument. The columns utilized in this study are: Intact and subunit: ACQUITY BEH C4, 1.7 μm, 2.1 x 50 mm, Native SEC/MS: ACQUITY BEH SEC 200 Å, 2.1 x 150 mm, Peptide mapping: ACQUITY BEH 300 C18, 2.1 x 100 mm, Released glycan with FLR labeling: ACQUITY BEH Glycan Amide 130Å, 1.7 μm, 2.1 x 150 mm. The BioAccord system was operated in MS and/or DIA (data independent acquisition) modes. The automatic system data acquisition, processing and reporting were operated with the compliant- ready UNIFI platform. Sample Preparation Intact Mass Analysis 400 μL water was added to the NISTmAb (Humanized mAb Mass Check Standard) (Waters P/N=186009152) sample vial (contains 80 μg of intact NISTmAb) to produce a solution of 0.2 μg/uL before injection (2 μL). Cysteine-conjugated ADCs were diluted to 2.5 μg/μL in 50 mM NH4OAc before LC (SEC)-MS analysis. Subunit Analysis Forced degraded (with H2O2) and standard NISTmAbs were digested with endopeptidase IdeS enzyme. The final diluted solution of 0.1 μg/ μL were used for LC/MS analysis. Peptide Mapping Analysis NISTmAb sample was denatured and digested with trypsin followed by reduction and alkylation. The solution was diluted to desired concentration for LC/MS analysis. Released N-linked Glycan Analysis The Waters Glycoworks RapiFlour-MS Glycan kit was used to generate RFMS labelled glycan from the NISTmAb. METHODS Figure 3. Spectrum quality and data consistency are the key factors of successful intact mass analysis. Relative quantitation of major glycoforms of the NIST mAb reference standard is displayed here. Across 321 injections, we were able to obtain consistent relative percentage of glycoforms. The RSD% is less than 4.0 % as highlighted in red. NIST mAb intact mass analysis reproducibility Figure 2. NISTmAb RPLC-MS intact mass analysis. A-combined raw spectrum. B-Zoomed in region of A. C-Decovoluted spectrum with good mass accuracy. Same experiment was conducted with 0.1% TFA, or with IDC (intelligent data capture), both with excellent results (data not shown) . NIST mAb intact mass analysis RESULTS Figure 1. The BioAccord System comprised of an ACQUITY UPLC I- Class PLUS configured with an optical detector (TUV/FLR) coupled in- line to the ACQUITY RDa Detector. Table 1. Total average DARs and drug distribution comparison amongst the HIC (UV) and the three native SEC- MS experiments exhibit agreement across all three drug loading levels. The results indicated that DAR measurements can be measured consistently using orthogonal approaches (HIC vs MS), or across different QTof or Tof MS systems (Xevo G2-S, Vion IMS QTOF MS and BioAccord System). With its streamlined workflow for automated data acquisition, processing, and reporting of DAR calculated results, the BioAccord System proved effective for native LC(SEC)-MS analysis of ADCs to determine lot to lot, batch to batch comparability. Native LC(SEC)-MS analysis of antibody drug conjugates (ADCs) with automatic DARs calculation Figure 4. The combined raw spectra from multiple charge state envelope (left), the zoomed-in region (single charge state) of the combined raw spectra (center) and the deconvoluted spectra (right) of the reference materials (mAb), the low, moderate and high conjugation level cysteine-conjugated ADC samples without deglycosylation treatment from the BioAccord system native LC(SEC)-MS analysis. Drug distribution was compared for three different cysteine-conjugated ADC samples with increasing drug load. Cysteine-conjugated ADCs drug loading distribution and DAR Low Moderate High HIC QTof1 QTof2 Tof HIC QTof1 QTof2 Tof HIC QTof1 QTof2 Tof ADC 2 0.81 0.74 0.64 0.68 0.38 0.41 0.35 0.36 0.07 0.09 0.05 0.05 ADC 4 1.14 1.17 1.37 1.36 1.67 1.57 1.81 1.82 1.23 1.11 1.19 1.15 ADC 6 0.75 0.60 0.64 0.65 1.61 1.45 1.51 1.47 1.72 1.72 1.86 1.85 ADC 8 0.12 0.21 0.05 0.10 0.78 0.97 0.70 0.75 2.95 3.05 2.98 2.96 DAR 2.83 2.72 2.70 2.79 4.44 4.40 4.37 4.40 5.97 5.97 6.07 6.01 QTof 1 deglycosylated samples, run on Xevo G2-S in 2014 QTof 2 non-deglycosylated samples, run on Vion in 2017 Tof non-deglycosylated samples, run on BioAccord in 2018 Figure 5. NISTmAb tryptic digest peptide mapping experiments. 18 runs (75 min total runtime each) Total Ion Chromatogram (TIC) overlay shows excellent reproducibility of the peptides retention times. The standard deviations for all the peptide retention times are less than 0.1 (data not shown). The labeled CQAs peptides on the TIC are the peptides that their relative MS abundances are calculated as shown in Figure 6. NISTmAb tryptic digest peptide mapping retention time and CQAs monitoring reproducibility Figure 6. CQAs monitoring reproducibility study across 3 systems. The relative MS (calculated from MS spectrum) abundances of the CQAs across 3 system shows excellent reproducibility with their % RSD being all less than 9%, indicating that the BioAccord system is suitable for peptide mapping CQAs monitoring experiments. Figure 8. Annotated FLR trace for NISTmAb glycans, 28 glycans were mass confirmed and 19 were determined to be present at % amounts greater than 0.1%. The sensitivity of the instrument is highlighted by the inset spectrum, which shows MS trace for F(6)A2[6]G(4)1Sg (6)1, a glycan that was present at 0.09 %Abundance. The signal-to-noise ratio for this glycan was estimated to be 30:1. NISTmAb released glycan analysis Figure 7. NISTmAb IdeS digested scFc subunit before and after forced degradation (oxidation using H2O2) comparison. Up to 3 oxidized species were detected for all major glycoforms with good resolution and mass accuracy. For the F(ab) subunit, up to 3 oxidized species were also detected for the F(ab) peak and the glycation peak with good resolution and mass accuracy (data not shown) NISTmAb subunit analysis forced degradation study CONCLUSION The newly developed BioAccord LC-MS system underwent performance evaluation for the three key analysis workflow in the biotherapeutic drug development process: intact mass analysis, peptide mapping/monitoring and released glycan analysis. These experiment results are extremely promising and clearly demonstrate the potential of the BioAccord system to address many of the challenges in implementing accurate-mass mass spectrometry with qualities such as high system performance, easy of use, excellent reproducibility, automatic workflow for data acquisition, processing and reporting and compliance- ready.
Transcript of X C Kenji Hirose , HenryShion , Mellisa Ly , Nilini ... · TO DOWNLOAD A COPY OF THIS POSTER, VISIT...
TO DOWNLOAD A COPY OF THIS POSTER, VISIT WWW.WATERS.COM/POSTERS ©2019 Waters Corporation MKT19103
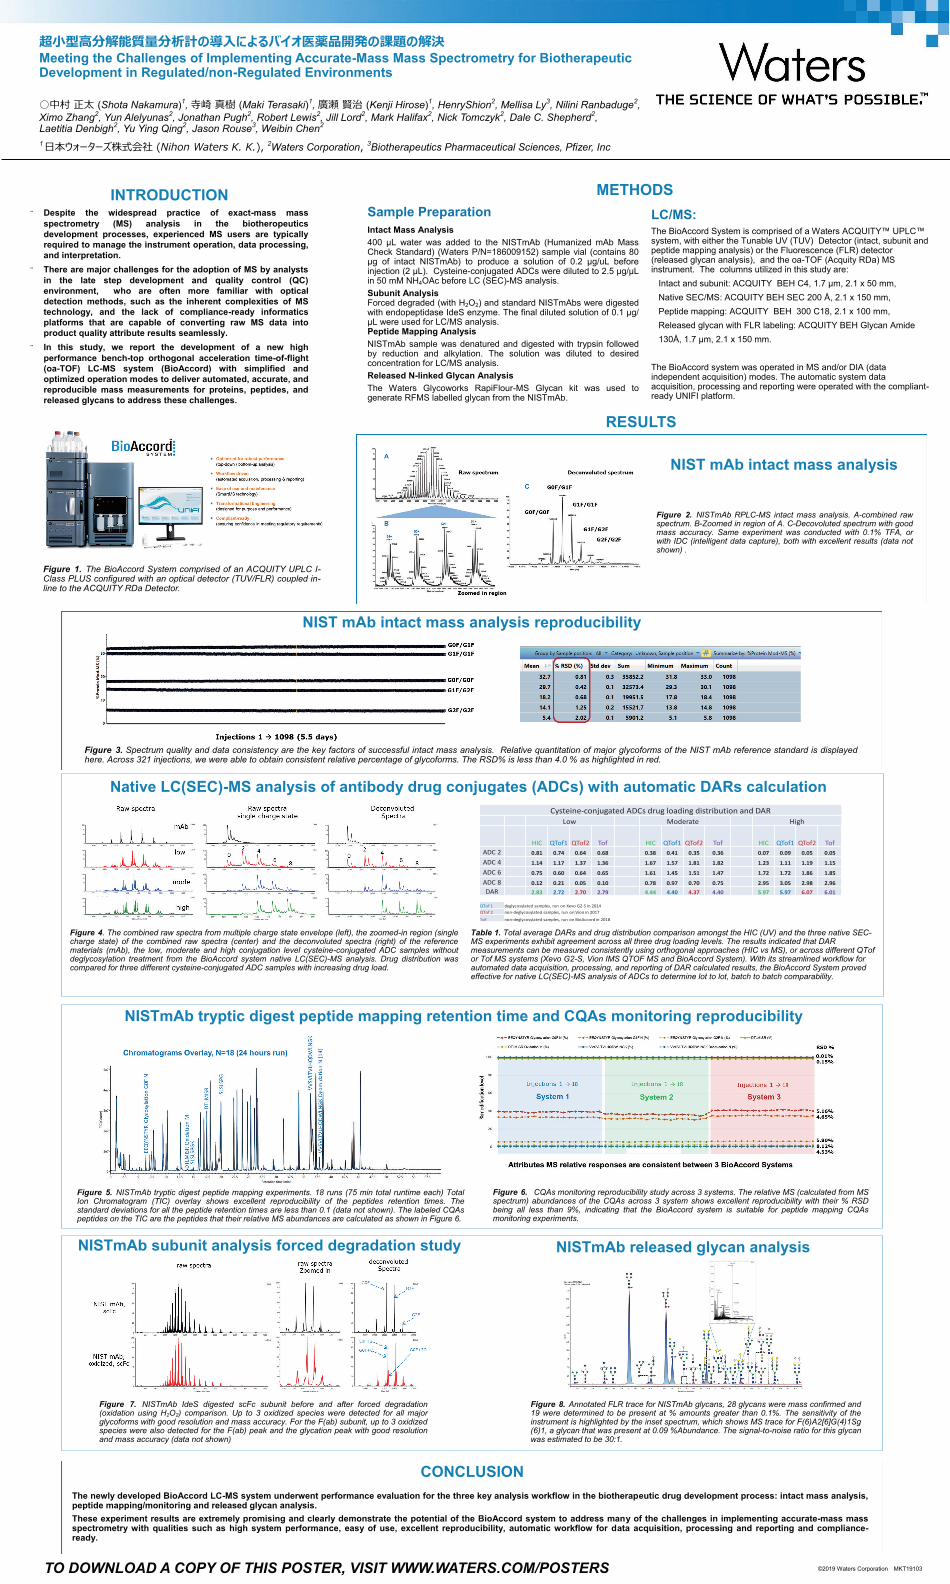
(Shota Nakamura)1, (Maki Terasaki)1, (Kenji Hirose)1, HenryShion2, Mellisa Ly3, Nilini Ranbaduge2, Ximo Zhang2, Yun Alelyunas2, Jonathan Pugh2, Robert Lewis2, Jill Lord2, Mark Halifax2, Nick Tomczyk2, Dale C. Shepherd2, Laetitia Denbigh2, Yu Ying Qing2, Jason Rouse3, Weibin Chen2 1 2Waters Corporation 3Biotherapeutics Pharmaceutical Sciences, Pfizer, Inc
Meeting the Challenges of Implementing Accurate-Mass Mass Spectrometry for Biotherapeutic Development in Regulated/non-Regulated Environments
INTRODUCTION ¨ Despite the widespread practice of exact-mass mass
spectrometry (MS) analysis in the biotheropeutics development processes, experienced MS users are typically required to manage the instrument operation, data processing, and interpretation.
¨ There are major challenges for the adoption of MS by analysts in the late step development and quality control (QC) environment, who are often more familiar with optical detection methods, such as the inherent complexities of MS technology, and the lack of compliance-ready informatics platforms that are capable of converting raw MS data into product quality attribute results seamlessly.
¨ In this study, we report the development of a new high performance bench-top orthogonal acceleration time-of-flight (oa-TOF) LC-MS system (BioAccord) with simplified and optimized operation modes to deliver automated, accurate, and reproducible mass measurements for proteins, peptides, and released glycans to address these challenges.
LC/MS: The BioAccord System is comprised of a Waters ACQUITY™ UPLC™ system, with either the Tunable UV (TUV) Detector (intact, subunit and peptide mapping analysis) or the Fluorescence (FLR) detector (released glycan analysis), and the oa-TOF (Acquity RDa) MS instrument. The columns utilized in this study are: Intact and subunit: ACQUITY BEH C4, 1.7 μm, 2.1 x 50 mm, Native SEC/MS: ACQUITY BEH SEC 200 Å, 2.1 x 150 mm, Peptide mapping: ACQUITY BEH 300 C18, 2.1 x 100 mm, Released glycan with FLR labeling: ACQUITY BEH Glycan Amide 130Å, 1.7 μm, 2.1 x 150 mm. The BioAccord system was operated in MS and/or DIA (data independent acquisition) modes. The automatic system data acquisition, processing and reporting were operated with the compliant-ready UNIFI platform.
Sample Preparation Intact Mass Analysis 400 μL water was added to the NISTmAb (Humanized mAb Mass Check Standard) (Waters P/N=186009152) sample vial (contains 80 μg of intact NISTmAb) to produce a solution of 0.2 μg/uL before injection (2 μL). Cysteine-conjugated ADCs were diluted to 2.5 μg/μL in 50 mM NH4OAc before LC (SEC)-MS analysis. Subunit Analysis Forced degraded (with H2O2) and standard NISTmAbs were digested with endopeptidase IdeS enzyme. The final diluted solution of 0.1 μg/μL were used for LC/MS analysis. Peptide Mapping Analysis NISTmAb sample was denatured and digested with trypsin followed by reduction and alkylation. The solution was diluted to desired concentration for LC/MS analysis. Released N-linked Glycan Analysis The Waters Glycoworks RapiFlour-MS Glycan kit was used to generate RFMS labelled glycan from the NISTmAb.
METHODS
Figure 3. Spectrum quality and data consistency are the key factors of successful intact mass analysis. Relative quantitation of major glycoforms of the NIST mAb reference standard is displayed
here. Across 321 injections, we were able to obtain consistent relative percentage of glycoforms. The RSD% is less than 4.0 % as highlighted in red.
NIST mAb intact mass analysis reproducibility
Figure 2. NISTmAb RPLC-MS intact mass analysis. A-combined raw spectrum. B-Zoomed in region of A. C-Decovoluted spectrum with good mass accuracy. Same experiment was conducted with 0.1% TFA, or with IDC (intelligent data capture), both with excellent results (data not shown) .
NIST mAb intact mass analysis
RESULTS
Figure 1. The BioAccord System comprised of an ACQUITY UPLC I-Class PLUS configured with an optical detector (TUV/FLR) coupled in-line to the ACQUITY RDa Detector.
Table 1. Total average DARs and drug distribution comparison amongst the HIC (UV) and the three native SEC-MS experiments exhibit agreement across all three drug loading levels. The results indicated that DAR measurements can be measured consistently using orthogonal approaches (HIC vs MS), or across different QTof or Tof MS systems (Xevo G2-S, Vion IMS QTOF MS and BioAccord System). With its streamlined workflow for automated data acquisition, processing, and reporting of DAR calculated results, the BioAccord System proved effective for native LC(SEC)-MS analysis of ADCs to determine lot to lot, batch to batch comparability.
Native LC(SEC)-MS analysis of antibody drug conjugates (ADCs) with automatic DARs calculation
Figure 4. The combined raw spectra from multiple charge state envelope (left), the zoomed-in region (single charge state) of the combined raw spectra (center) and the deconvoluted spectra (right) of the reference materials (mAb), the low, moderate and high conjugation level cysteine-conjugated ADC samples without deglycosylation treatment from the BioAccord system native LC(SEC)-MS analysis. Drug distribution was compared for three different cysteine-conjugated ADC samples with increasing drug load.
Cysteine-conjugated ADCs drug loading distribution and DARLow Moderate High
HIC QTof1 QTof2 Tof HIC QTof1 QTof2 Tof HIC QTof1 QTof2 Tof ADC 2 0.81 0.74 0.64 0.68 0.38 0.41 0.35 0.36 0.07 0.09 0.05 0.05ADC 4 1.14 1.17 1.37 1.36 1.67 1.57 1.81 1.82 1.23 1.11 1.19 1.15ADC 6 0.75 0.60 0.64 0.65 1.61 1.45 1.51 1.47 1.72 1.72 1.86 1.85ADC 8 0.12 0.21 0.05 0.10 0.78 0.97 0.70 0.75 2.95 3.05 2.98 2.96DAR 2.83 2.72 2.70 2.79 4.44 4.40 4.37 4.40 5.97 5.97 6.07 6.01
QTof 1 deglycosylated samples, run on Xevo G2-S in 2014QTof 2 non-deglycosylated samples, run on Vion in 2017Tof non-deglycosylated samples, run on BioAccord in 2018
Figure 5. NISTmAb tryptic digest peptide mapping experiments. 18 runs (75 min total runtime each) Total Ion Chromatogram (TIC) overlay shows excellent reproducibility of the peptides retention times. The standard deviations for all the peptide retention times are less than 0.1 (data not shown). The labeled CQAs peptides on the TIC are the peptides that their relative MS abundances are calculated as shown in Figure 6.
NISTmAb tryptic digest peptide mapping retention time and CQAs monitoring reproducibility
Figure 6. CQAs monitoring reproducibility study across 3 systems. The relative MS (calculated from MS spectrum) abundances of the CQAs across 3 system shows excellent reproducibility with their % RSD being all less than 9%, indicating that the BioAccord system is suitable for peptide mapping CQAs monitoring experiments.
Figure 8. Annotated FLR trace for NISTmAb glycans, 28 glycans were mass confirmed and 19 were determined to be present at % amounts greater than 0.1%. The sensitivity of the instrument is highlighted by the inset spectrum, which shows MS trace for F(6)A2[6]G(4)1Sg(6)1, a glycan that was present at 0.09 %Abundance. The signal-to-noise ratio for this glycan was estimated to be 30:1.
NISTmAb released glycan analysis
Figure 7. NISTmAb IdeS digested scFc subunit before and after forced degradation (oxidation using H2O2) comparison. Up to 3 oxidized species were detected for all major glycoforms with good resolution and mass accuracy. For the F(ab) subunit, up to 3 oxidized species were also detected for the F(ab) peak and the glycation peak with good resolution and mass accuracy (data not shown)
NISTmAb subunit analysis forced degradation study
CONCLUSION The newly developed BioAccord LC-MS system underwent performance evaluation for the three key analysis workflow in the biotherapeutic drug development process: intact mass analysis, peptide mapping/monitoring and released glycan analysis. These experiment results are extremely promising and clearly demonstrate the potential of the BioAccord system to address many of the challenges in implementing accurate-mass mass spectrometry with qualities such as high system performance, easy of use, excellent reproducibility, automatic workflow for data acquisition, processing and reporting and compliance-ready.