University of Szczecin Faculty of Social Sciences List of ...
100
VARIABILITY OF PHYSICOCHEMICAL PROPERTIES OF WATER OF THE TRANSBOUNDARY POPRAD RIVER
Agnieszka Policht-Latawiec1, Andrzej Bogdał1, Włodzimierz Kanownik1, Tomasz Kowalik1, Krzysztof Ostrowski1
1 Department of Land Reclamation and Environmental Development, University of Agriculture in Krakow, Al. Mickiewicza 24-28, 30-059 Krakow, Poland, e-mail: [email protected]; [email protected]; [email protected]; [email protected]; [email protected]
INTRODUCTION
Surface waters may be polluted by substanc-es originating from anthropogenic sources [Gro-chowska and Tandyrak 2007, Bojakowska et al. 2010, Húska et al. 2013] and due to natural pro-cesses occurring in the environment [Moniewski and Stolarska 2007]. Natural sources may com-prise various pollutant agents, such as plant rem-nants and humus substances, clay and silt par-ticles of soils or rocks, compounds of iron and manganese, etc. However, pollution caused by various human activities is far more dangerous to the environment [Dąbrowska 2008, Policht-Latawiec and Kanownik 2013]. These may be either liquid or gaseous substances. They find
Journal of Ecological EngineeringVolume 16, Issue 1, Jan. 2015, pages 100–109DOI: 10.12911/22998993/593 Research Article
ABSTRACTThe results of five-year (2008–2012) hydrochemical research of the Poprad river, the right bank tributary to the Dunajec, were analyzed in the paper. The Poprad, 167 km long and with the catchment area of 2077.3 km2, flows for over 100 km through the territory of Slovakia, along the length of 31.1 km is a transboundary river, whereas its 31.0 km long reach is situated in Poland. Concerning its abiotic character, it is an east-ern upland river of type 15. The research was conducted in three measurement-control points: 1) located in Leluchów on the Polish-Slovak border at 61.1 kilometer of the river course, 2) in Piwniczna-Zdrój – 23.9 km and 3) in Stary Sącz – 2.9 km before the Poprad outlet to the Dunajec. 21 physicochemical indices and 2 microbiological indicators were assessed in the water samples once a month using referential methods. The paper assesses changes of water quality classes and its usable values along the analyzed Poprad river reach. Moreover, statistical differences between the values of individual indices assessed in various measurement-control points were estimated by means of Mann-Whitney U nonparametric test. On the basis of the conducted analyses of the empirical data it was stated that due to the physicochemical indices, water qual-ity along the whole length of the analyzed river reach was good (class II) – in points 1 and 3 it was determined by mean concentration of total suspended solids, whereas in point 2 COD-Mn values.
Keywords: the Poprad river, physicochemical indices, ecological state, water pollution.
Received: 2014.07.10Accepted: 2014.10.17Published: 2015.01.02
their way directly to the waters, most frequently with various types of sewage, either municipal [Gromaire-Mertz et al. 1999, Göbel et al. 2007, Napieralska and Gołdyn 2013], industrial [Le-wandowska-Robak 2011] or rural [Monaghan 2007]. Such pollutants are also in post-cooling waters, salinated mining wastewaters, surface runoffs from industrial and agricultural areas [Bogdał and Ostrowski 2007, Wiatkowski et al. 2012], leachates from industrial and municipal landfills [Kukuła and Bylak 2010]. Dangerous substances may find their way to surface waters also directly from the atmospheric air, to which dusts and gases are emitted by various industries [Vicario 2012]. The pollutants finding their way directly to waters are divided into three kinds, ac-
101
Journal of Ecological Engineering vol. 16(1), 2015
cording to the way of their inflow: point source, line source and area source pollution [Paredes et al. 2010, Kleiber 2012]. Point source pollution reaches waters in a concentrated form in a spe-cific place (e.g. municipal or industrial sewage discharge). Line source pollution is connected with the effect of pollutants along some course (e.g. streets with very heavy traffic) [Bąk et al. 2012, Wiśniowska-Kielian et al. 2013]. The area source pollution originates from rainwater run-off from urban areas without sewer system, from agricultural areas [Kanownik et al. 2011] or for-est areas [Bogdał and Ostrowski 2009, Kowalik et al. 2012]. Disadvantageous changes of physi-cal, chemical and biological properties of surface waters caused by anthropogenic factors lead to environmental changes, which unfavorably in-fluence living organisms. Such a situation makes necessary undertaking a number of endeavors to prevent further degradation, which are preceded by research monitoring of rivers and water res-ervoirs threatened with anthropopressure, which allows to identify the hazards to surface waters in the catchments [Lampart-Kłużniacka et al. 2012, Brankov et al. 2012].
The aim of the paper was determining the changes of water quality along about 60 km long reach of the transboundary Poprad river. The au-thors strived to reach the objective through com-paring the values of several dozen physicochemi-cal indices and two microbiological indicators de-termined in 3 measurement-control points, which proved a basis for the assessment of water classes and usable values of the surface water.
MATERIAL AND METHODS
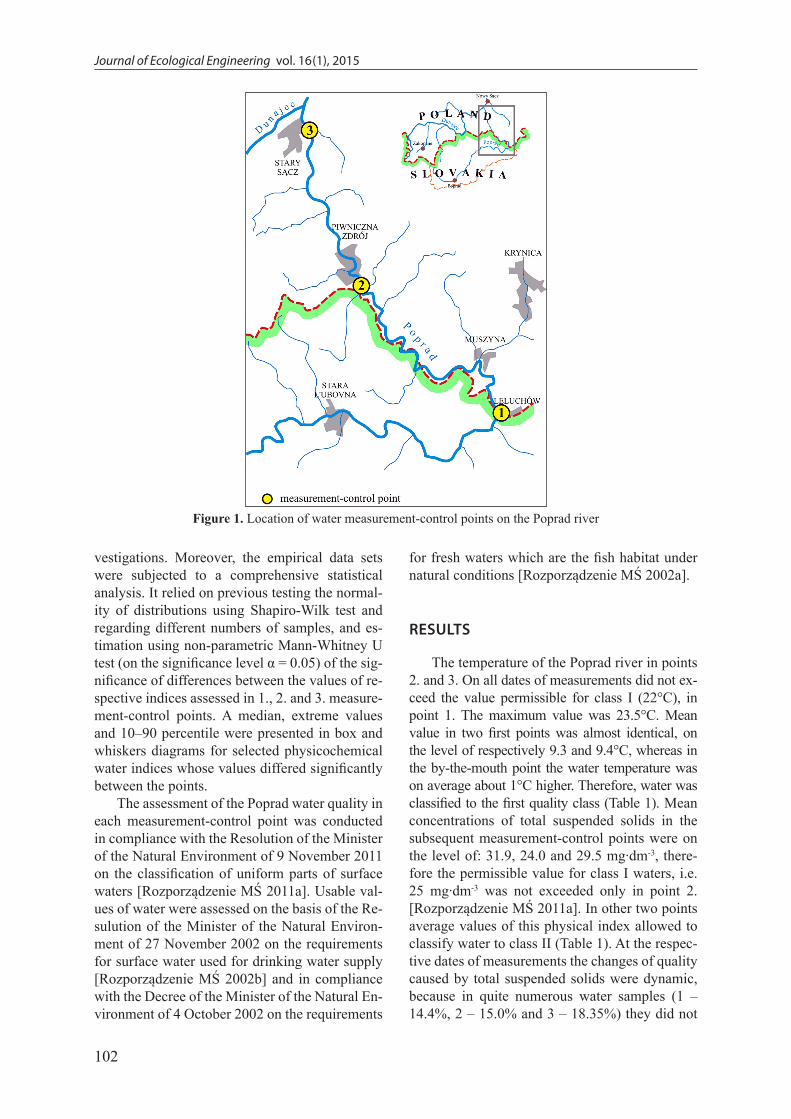
The object of analysis were values and con-centrations of physicochemical and microbio-logical indices of the Poprad river water qual-ity, investigated in 2008–2012 by the Regional Inspectorate of the Environmental Protection in Krakow. Water was sampled in three measure-ment-control points: the first located in Leluchów (on the Polish-Slovakian border) at km 61.2 of the river course, the second in Piwniczna-Zdrój (23.9 km) and the third in Stary Sacz at 2.9 km of the Poprad river course (Figure 1).
The Poprad is a transboundary river flowing from Slovakia to Poland. Concerning the abiotic factors, it is classified s eastern upland rivers, type 15. It has its source in the High Tatra Mts. in Slo-
vakia, whereas the confluence of the Hińczowy Stream with the Krupa Stream is regarded as its headwaters. The Poprad river has numerous tributaries, among which the larger ones are the following streams: the Lipnik, the Suliński, the Granastowski, the Smereczek, the Muszynka with the Kryniczanka, the Wierchomlanka, the Łomniczanka, the Czerecz, the Wielka Roztoka and the Przysietnicki stream, in Biegionice vil-lage, situated about 2.9 km below Stary Sącz, the Poprad flows into the Dunajec on the right bank side (Figure 1).
The Poprad river is 167 km long and for over 100 km flows through the territory of Slovakia, on the 31.1 km reach it is a transboundary river (from Leluchów and Legnava to Piwniczna-Zdrój) and along 31.0 km it is situated on the territory of Po-land. The catchment area is 2077.3 km2, of which 77% is situated in the area of Presov county in the Slovak Republic, whereas only 482.8 km2 in the southern part of the Nowy Sącz county in the Malopolska Voivodeship (Poland). The Slovak part of the catchment is situated in the Central part of the Western Carpathians (514) and part-ly comprises geographical regions such as the Eastern Tatra Mts. (514.53), Liptovsko-Spiska Depression (514), the Pieniny Mts. (514.12) and Spisko-Gubałowskie Foothills (514.13). On the Polish side its catchment belongs to the Outer Western Carpathians (513) and comprises almost whole Beskid Sądecki Mts. (513.54) and a part of Sącz Basin (513.53).
The Poprad flows through some larger cities, towns and villages, including: Poprad, Kežmarok and Stara L’ubovla (Slovakia) and Leluchów, Muszyna, Żegiestów-Zdrój, Piwniczna-Zdrój, Rytro and Stary Sącz (Poland). Therefore, the river water is drawn for municipal water sup-ply, but at the same time the Poprad is a direct or indirect receiver of treated sewage, which is discharged from 8 sewage treatment plants: in Rytro (km 12+320), Piwniczna (km 21+580, the Borownice stream), Andrzejówka (the An-drzejówka stream), Żegiestów (km 35+500 and 40+400), Muszyna (km 51+350) and in Krynica (the Kryniczanka stream).
21 physicochemical indices and two mi-crobiological indicators were determined in the water samples using referential methods [Rozporządzenie MŚ 2011b]. For each analyzed index minimum, maximum value, arithmetic mean, median, standard deviation and coefficient of variance were determined for the period of in-
Journal of Ecological Engineering vol. 16(1), 2015
102
vestigations. Moreover, the empirical data sets were subjected to a comprehensive statistical analysis. It relied on previous testing the normal-ity of distributions using Shapiro-Wilk test and regarding different numbers of samples, and es-timation using non-parametric Mann-Whitney U test (on the significance level α = 0.05) of the sig-nificance of differences between the values of re-spective indices assessed in 1., 2. and 3. measure-ment-control points. A median, extreme values and 10–90 percentile were presented in box and whiskers diagrams for selected physicochemical water indices whose values differed significantly between the points.
The assessment of the Poprad water quality in each measurement-control point was conducted in compliance with the Resolution of the Minister of the Natural Environment of 9 November 2011 on the classification of uniform parts of surface waters [Rozporządzenie MŚ 2011a]. Usable val-ues of water were assessed on the basis of the Re-sulution of the Minister of the Natural Environ-ment of 27 November 2002 on the requirements for surface water used for drinking water supply [Rozporządzenie MŚ 2002b] and in compliance with the Decree of the Minister of the Natural En-vironment of 4 October 2002 on the requirements
for fresh waters which are the fish habitat under natural conditions [Rozporządzenie MŚ 2002a].
RESULTS
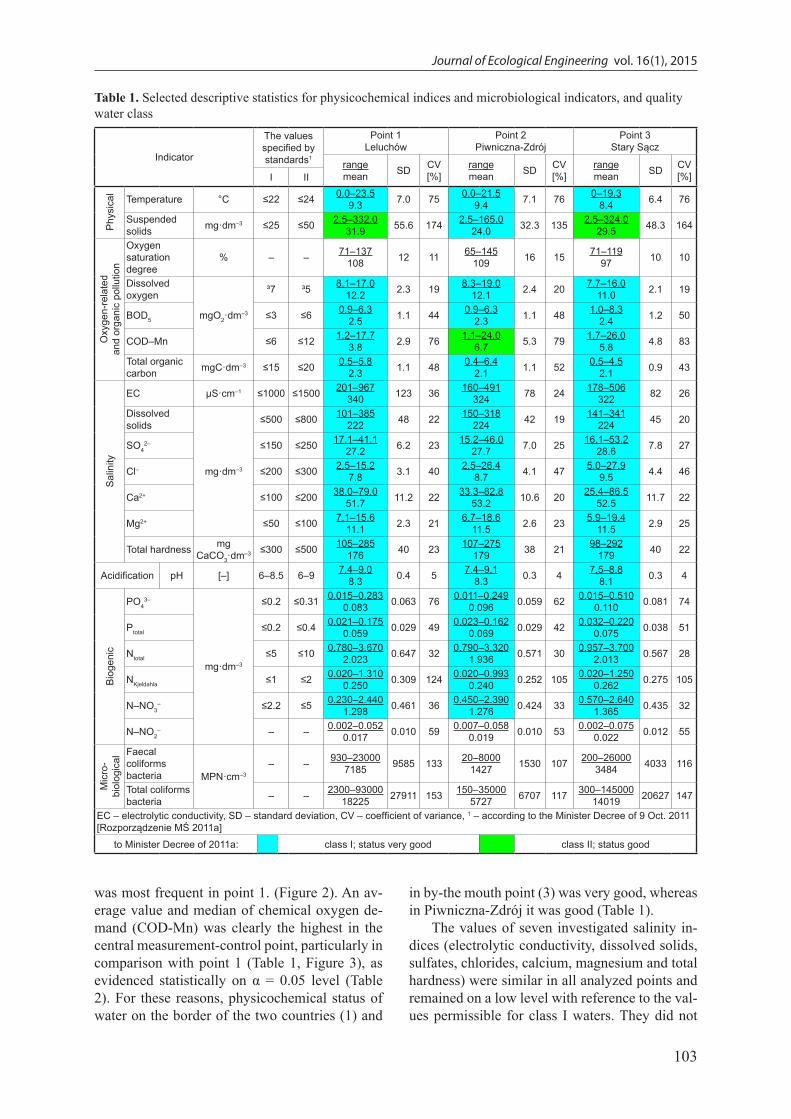
The temperature of the Poprad river in points 2. and 3. On all dates of measurements did not ex-ceed the value permissible for class I (22°C), in point 1. The maximum value was 23.5°C. Mean value in two first points was almost identical, on the level of respectively 9.3 and 9.4°C, whereas in the by-the-mouth point the water temperature was on average about 1°C higher. Therefore, water was classified to the first quality class (Table 1). Mean concentrations of total suspended solids in the subsequent measurement-control points were on the level of: 31.9, 24.0 and 29.5 mg∙dm-3, there-fore the permissible value for class I waters, i.e. 25 mg∙dm-3 was not exceeded only in point 2. [Rozporządzenie MŚ 2011a]. In other two points average values of this physical index allowed to classify water to class II (Table 1). At the respec-tive dates of measurements the changes of quality caused by total suspended solids were dynamic, because in quite numerous water samples (1 – 14.4%, 2 – 15.0% and 3 – 18.35%) they did not
Figure 1. Location of water measurement-control points on the Poprad river
103
Journal of Ecological Engineering vol. 16(1), 2015
Table 1. Selected descriptive statistics for physicochemical indices and microbiological indicators, and quality water class
Indicator
The values specified by standards1
Point 1Leluchów
Point 2Piwniczna-Zdrój
Point 3Stary Sącz
rangemean SD CV
[%]rangemean SD CV
[%]rangemean SD CV
[%]I II
Phy
sica
l
Temperature °C ≤22 ≤24 0.0–23.59.3 7.0 75 0.0–21.5
9.4 7.1 76 0–19.38.4 6.4 76
Suspended solids mg·dm–3 ≤25 ≤50 2.5–332.0
31.9 55.6 174 2.5–165.024.0 32.3 135 2.5–324.0
29.5 48.3 164
Oxy
gen-
rela
ted
and
orga
nic
pollu
tion
Oxygen saturation degree
% – – 71–137108 12 11 65–145
109 16 15 71–11997 10 10
Dissolved oxygen
mgO2·dm–3
³7 ³5 8.1–17.012.2 2.3 19 8.3–19.0
12.1 2.4 20 7.7–16.011.0 2.1 19
BOD5 ≤3 ≤6 0.9–6.32.5 1.1 44 0.9–6.3
2.3 1.1 48 1.0–8.32.4 1.2 50
COD–Mn ≤6 ≤12 1.2–17.73.8 2.9 76 1.1–24.0
6.7 5.3 79 1.7–26.05.8 4.8 83
Total organic carbon mgC·dm–3 ≤15 ≤20 0.5–5.8
2.3 1.1 48 0.4–6.42.1 1.1 52 0.5–4.5
2.1 0.9 43
Sal
inity
EC μS·cm–1 ≤1000 ≤1500 201–967340 123 36 160–491
324 78 24 178–506322 82 26
Dissolved solids
mg·dm–3
≤500 ≤800 101–385222 48 22 150–318
224 42 19 141–341224 45 20
SO42– ≤150 ≤250 17.1–41.1
27.2 6.2 23 15.2–46.027.7 7.0 25 16.1–53.2
28.6 7.8 27
Cl– ≤200 ≤300 2.5–15.27.8 3.1 40 2.5–26.4
8.7 4.1 47 5.0–27.99.5 4.4 46
Ca2+ ≤100 ≤200 38.0–79.051.7 11.2 22 33.3–82.8
53.2 10.6 20 25.4–86.552.5 11.7 22
Mg2+ ≤50 ≤100 7.1–15.611.1 2.3 21 6.7–18.6
11.5 2.6 23 5.9–19.411.5 2.9 25
Total hardness mgCaCO3·dm–3 ≤300 ≤500 105–285
176 40 23 107–275179 38 21 98–292
179 40 22
Acidification pH [–] 6–8.5 6–9 7.4–9.08.3 0.4 5 7.4–9.1
8.3 0.3 4 7.5–8.88.1 0.3 4
Bio
geni
c
PO43–
mg·dm–3
≤0.2 ≤0.31 0.015–0.2830.083 0.063 76 0.011–0.249
0.096 0.059 62 0.015–0.5100.110 0.081 74
Ptotal ≤0.2 ≤0.4 0.021–0.1750.059 0.029 49 0.023–0.162
0.069 0.029 42 0.032–0.2200.075 0.038 51
Ntotal ≤5 ≤10 0.780–3.6702.023 0.647 32 0.790–3.320
1.936 0.571 30 0.957–3.7002.013 0.567 28
NKjeldahla ≤1 ≤2 0.020–1.3100.250 0.309 124 0.020–0.993
0.240 0.252 105 0.020–1.2500.262 0.275 105
N–NO3– ≤2.2 ≤5 0.230–2.440
1.298 0.461 36 0.450–2.3901.276 0.424 33 0.570–2.640
1.365 0.435 32
N–NO2– – – 0.002–0.052
0.017 0.010 59 0.007–0.0580.019 0.010 53 0.002–0.075
0.022 0.012 55
Mic
ro-
biol
ogic
al
Faecal coliforms bacteria MPN·cm–3
– – 930–230007185 9585 133 20–8000
1427 1530 107 200–260003484 4033 116
Total coliforms bacteria – – 2300–93000
18225 27911 153 150–350005727 6707 117 300–145000
14019 20627 147
EC – electrolytic conductivity, SD – standard deviation, CV – coefficient of variance, 1 – according to the Minister Decree of 9 Oct. 2011 [Rozporządzenie MŚ 2011a]
to Minister Decree of 2011a: class I; status very good class II; status good
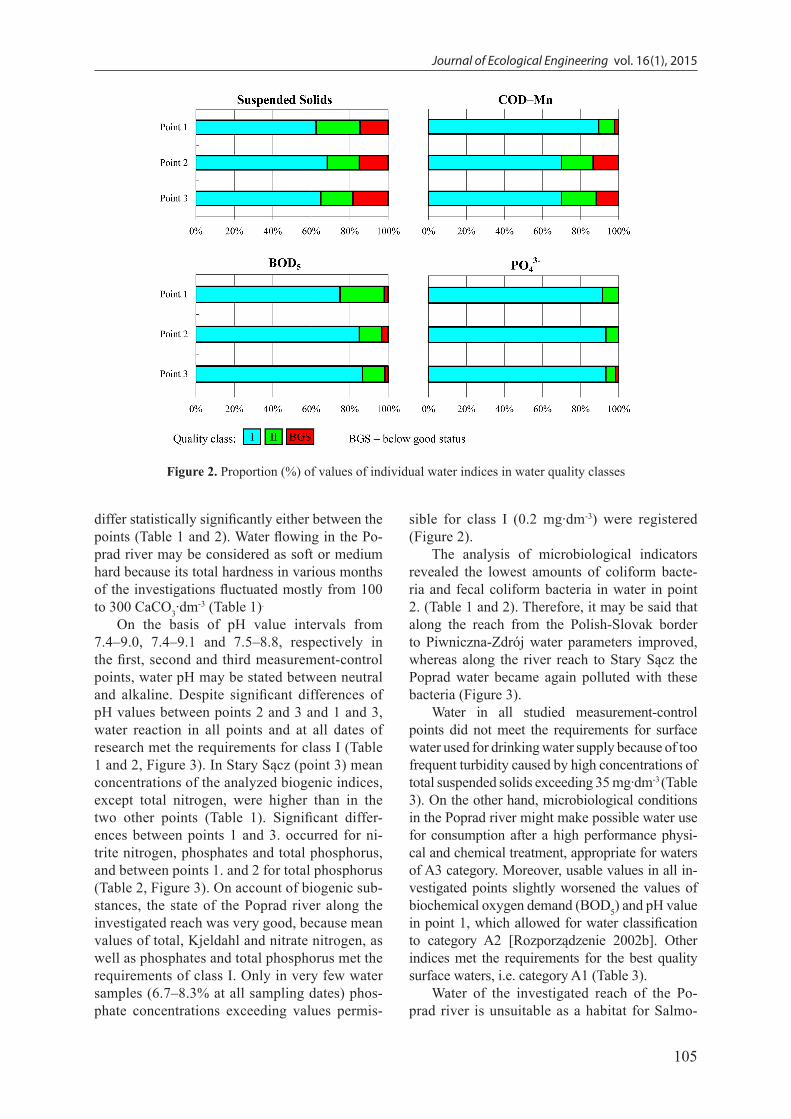
was most frequent in point 1. (Figure 2). An av-erage value and median of chemical oxygen de-mand (COD-Mn) was clearly the highest in the central measurement-control point, particularly in comparison with point 1 (Table 1, Figure 3), as evidenced statistically on α = 0.05 level (Table 2). For these reasons, physicochemical status of water on the border of the two countries (1) and
in by-the mouth point (3) was very good, whereas in Piwniczna-Zdrój it was good (Table 1).
The values of seven investigated salinity in-dices (electrolytic conductivity, dissolved solids, sulfates, chlorides, calcium, magnesium and total hardness) were similar in all analyzed points and remained on a low level with reference to the val-ues permissible for class I waters. They did not
Journal of Ecological Engineering vol. 16(1), 2015
104
meet the requirements for class II – below the good state. A great dynamics of changes was evi-denced also by high values of the coefficient of variance (135–174%). Like in case of the tem-perature, medians of total suspended solids did not differ statistically between the measurement-control points (Table 2).
Concentrations of oxygen dissolved in water along the studied Poprad river reach ranged from 7.7–19.0 mgO2∙dm-3. Means in points 1 and 2 dif-fered slightly and were respectively 12.2 and 12.1 mgO2∙dm-3, whereas in point 3 the amount of oxy-gen in water was much smaller – 11.0 mgO2∙dm-3. All research values and mean concentrations were higher than 7 mgO2∙dm-3, i.e. they met the requirements for class I. Also water saturation with oxygen was high in all measurement-control points because the average values in the subse-quent points were on the level of 108, 109 and
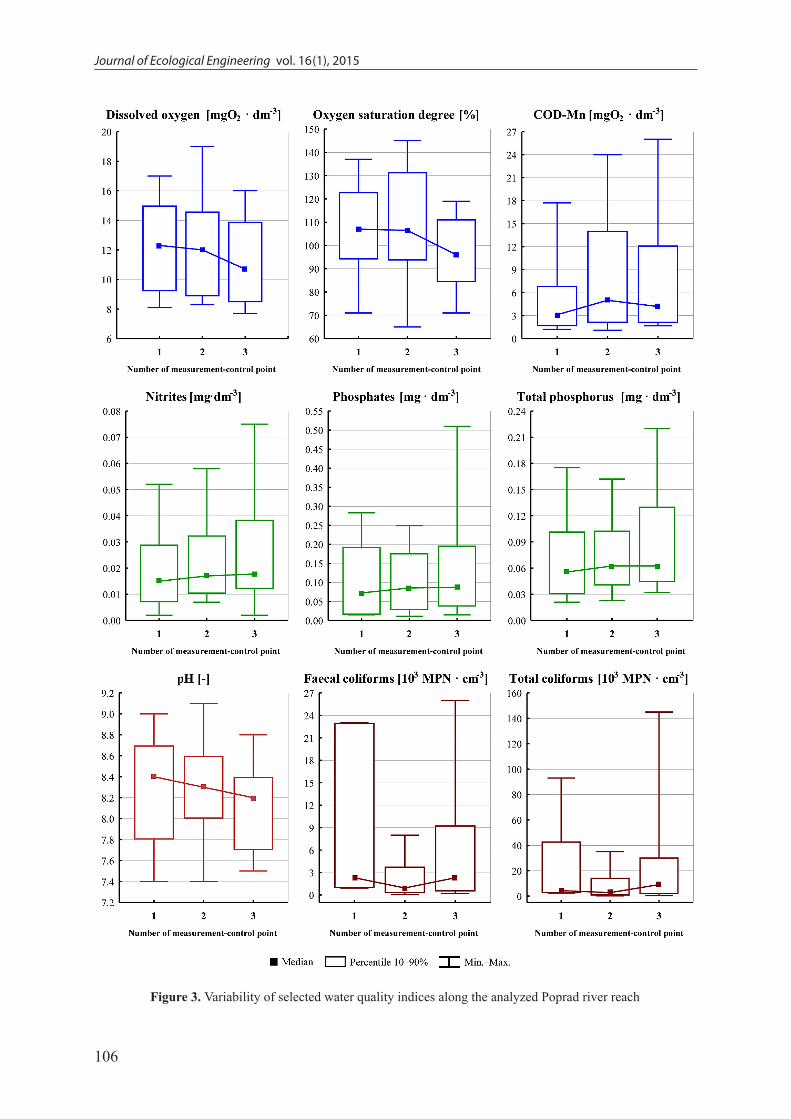
97% (Table 1). Values of dissolved oxygen and water saturation with oxygen did not differ sta-tistically between points 1. and 2., but between 2. and 3., and between 1. and 3. values of Mann-Whitney U test confirmed significant differences (Table 2, Figure 3). A significant decrease in oxy-gen content in water between Piwniczna-Zdrój and Stary Sącz is mainly affected by a lower lon-gitudinal rive profile along this reach, thus a less turbulent water flow, which does not favor inten-sive oxygen diffusion from the atmospheric air.
Mean BOD5 and total organic carbon (TOC) values were on a very similar level in all analyzed profiles and allowed to classify water to class I (Table 1). In case of the first index mentioned above, the values exceeding permissible levels for classes I and II were registered in single water samples with various frequency over the whole period of investigations. A worse water quality
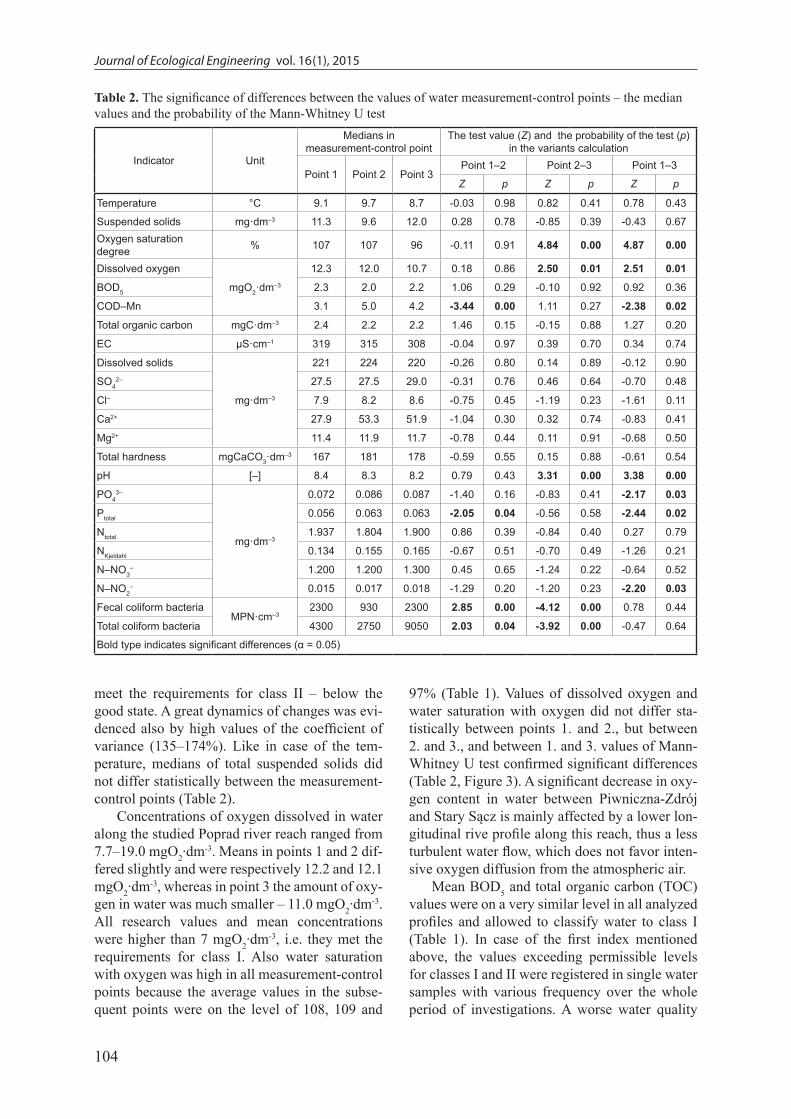
Table 2. The significance of differences between the values of water measurement-control points – the median values and the probability of the Mann-Whitney U test
Indicator Unit
Medians inmeasurement-control point
The test value (Z) and the probability of the test (p) in the variants calculation
Point 1 Point 2 Point 3Point 1–2 Point 2–3 Point 1–3
Z p Z p Z p
Temperature °C 9.1 9.7 8.7 -0.03 0.98 0.82 0.41 0.78 0.43
Suspended solids mg·dm–3 11.3 9.6 12.0 0.28 0.78 -0.85 0.39 -0.43 0.67Oxygen saturation degree % 107 107 96 -0.11 0.91 4.84 0.00 4.87 0.00
Dissolved oxygen
mgO2·dm–3
12.3 12.0 10.7 0.18 0.86 2.50 0.01 2.51 0.01
BOD5 2.3 2.0 2.2 1.06 0.29 -0.10 0.92 0.92 0.36
COD–Mn 3.1 5.0 4.2 -3.44 0.00 1.11 0.27 -2.38 0.02
Total organic carbon mgC·dm–3 2.4 2.2 2.2 1.46 0.15 -0.15 0.88 1.27 0.20
EC μS·cm–1 319 315 308 -0.04 0.97 0.39 0.70 0.34 0.74
Dissolved solids
mg·dm–3
221 224 220 -0.26 0.80 0.14 0.89 -0.12 0.90
SO42– 27.5 27.5 29.0 -0.31 0.76 0.46 0.64 -0.70 0.48
Cl– 7.9 8.2 8.6 -0.75 0.45 -1.19 0.23 -1.61 0.11
Ca2+ 27.9 53.3 51.9 -1.04 0.30 0.32 0.74 -0.83 0.41
Mg2+ 11.4 11.9 11.7 -0.78 0.44 0.11 0.91 -0.68 0.50
Total hardness mgCaCO3·dm–3 167 181 178 -0.59 0.55 0.15 0.88 -0.61 0.54
pH [–] 8.4 8.3 8.2 0.79 0.43 3.31 0.00 3.38 0.00
PO43–
mg·dm–3
0.072 0.086 0.087 -1.40 0.16 -0.83 0.41 -2.17 0.03
Ptotal 0.056 0.063 0.063 -2.05 0.04 -0.56 0.58 -2.44 0.02
Ntotal 1.937 1.804 1.900 0.86 0.39 -0.84 0.40 0.27 0.79
NKjeldahl 0.134 0.155 0.165 -0.67 0.51 -0.70 0.49 -1.26 0.21
N–NO3– 1.200 1.200 1.300 0.45 0.65 -1.24 0.22 -0.64 0.52
N–NO2– 0.015 0.017 0.018 -1.29 0.20 -1.20 0.23 -2.20 0.03
Fecal coliform bacteriaMPN·cm–3
2300 930 2300 2.85 0.00 -4.12 0.00 0.78 0.44
Total coliform bacteria 4300 2750 9050 2.03 0.04 -3.92 0.00 -0.47 0.64
Bold type indicates significant differences (α = 0.05)
105
Journal of Ecological Engineering vol. 16(1), 2015
differ statistically significantly either between the points (Table 1 and 2). Water flowing in the Po-prad river may be considered as soft or medium hard because its total hardness in various months of the investigations fluctuated mostly from 100 to 300 CaCO3∙dm-3 (Table 1).
On the basis of pH value intervals from 7.4–9.0, 7.4–9.1 and 7.5–8.8, respectively in the first, second and third measurement-control points, water pH may be stated between neutral and alkaline. Despite significant differences of pH values between points 2 and 3 and 1 and 3, water reaction in all points and at all dates of research met the requirements for class I (Table 1 and 2, Figure 3). In Stary Sącz (point 3) mean concentrations of the analyzed biogenic indices, except total nitrogen, were higher than in the two other points (Table 1). Significant differ-ences between points 1 and 3. occurred for ni-trite nitrogen, phosphates and total phosphorus, and between points 1. and 2 for total phosphorus (Table 2, Figure 3). On account of biogenic sub-stances, the state of the Poprad river along the investigated reach was very good, because mean values of total, Kjeldahl and nitrate nitrogen, as well as phosphates and total phosphorus met the requirements of class I. Only in very few water samples (6.7–8.3% at all sampling dates) phos-phate concentrations exceeding values permis-
Figure 2. Proportion (%) of values of individual water indices in water quality classes
sible for class I (0.2 mg∙dm-3) were registered (Figure 2).
The analysis of microbiological indicators revealed the lowest amounts of coliform bacte-ria and fecal coliform bacteria in water in point 2. (Table 1 and 2). Therefore, it may be said that along the reach from the Polish-Slovak border to Piwniczna-Zdrój water parameters improved, whereas along the river reach to Stary Sącz the Poprad water became again polluted with these bacteria (Figure 3).
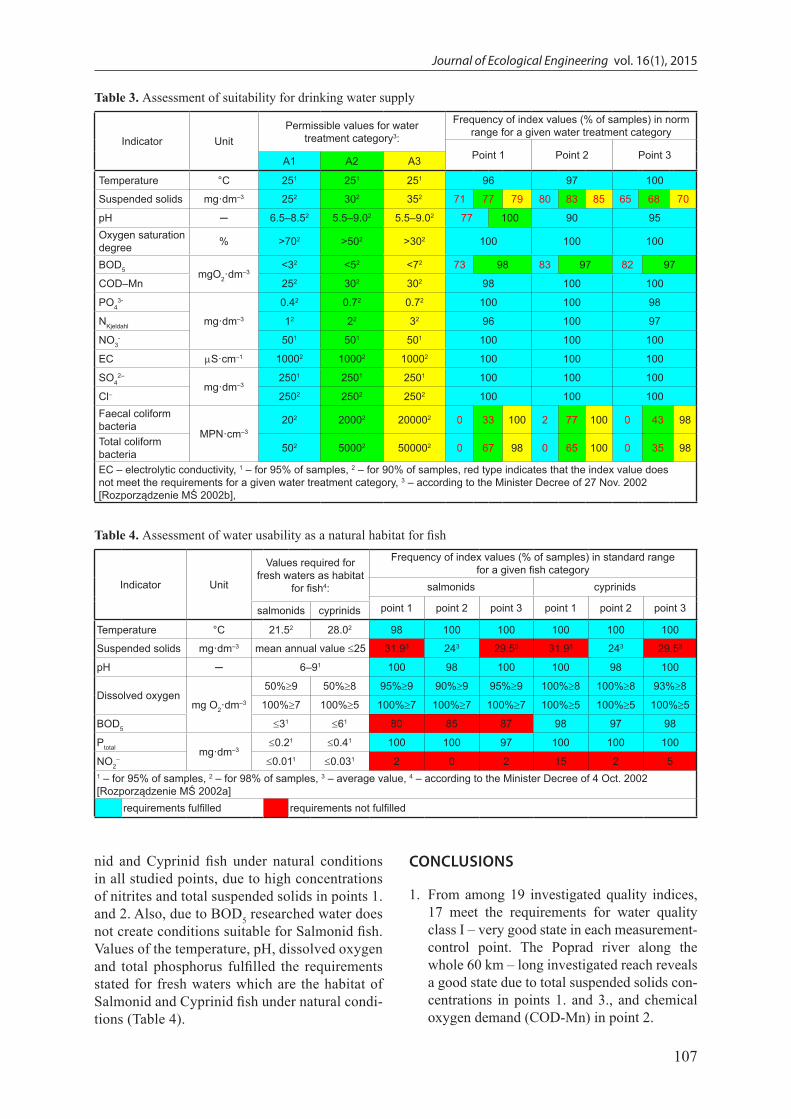
Water in all studied measurement-control points did not meet the requirements for surface water used for drinking water supply because of too frequent turbidity caused by high concentrations of total suspended solids exceeding 35 mg∙dm-3 (Table 3). On the other hand, microbiological conditions in the Poprad river might make possible water use for consumption after a high performance physi-cal and chemical treatment, appropriate for waters of A3 category. Moreover, usable values in all in-vestigated points slightly worsened the values of biochemical oxygen demand (BOD5) and pH value in point 1, which allowed for water classification to category A2 [Rozporządzenie 2002b]. Other indices met the requirements for the best quality surface waters, i.e. category A1 (Table 3).
Water of the investigated reach of the Po-prad river is unsuitable as a habitat for Salmo-
Journal of Ecological Engineering vol. 16(1), 2015
106
Figure 3. Variability of selected water quality indices along the analyzed Poprad river reach
107
Journal of Ecological Engineering vol. 16(1), 2015
Table 3. Assessment of suitability for drinking water supply
Indicator UnitPermissible values for water
treatment category3:
Frequency of index values (% of samples) in norm range for a given water treatment category
Point 1 Point 2 Point 3A1 A2 A3
Temperature °C 251 251 251 96 97 100
Suspended solids mg·dm–3 252 302 352 71 77 79 80 83 85 65 68 70
pH ─ 6.5–8.52 5.5–9.02 5.5–9.02 77 100 90 95Oxygen saturation degree % >702 >502 >302 100 100 100
BOD5 mgO2·dm–3<32 <52 <72 73 98 83 97 82 97
COD–Mn 252 302 302 98 100 100
PO43-
mg·dm–3
0.42 0.72 0.72 100 100 98
NKjeldahl 12 22 32 96 100 97
NO3- 501 501 501 100 100 100
EC mS·cm–1 10002 10002 10002 100 100 100
SO42–
mg·dm–32501 2501 2501 100 100 100
Cl– 2502 2502 2502 100 100 100Faecal coliform bacteria
MPN·cm–3
202 20002 200002 0 33 100 2 77 100 0 43 98
Total coliform bacteria 502 50002 500002 0 67 98 0 65 100 0 35 98
EC – electrolytic conductivity, 1 – for 95% of samples, 2 – for 90% of samples, red type indicates that the index value does not meet the requirements for a given water treatment category, 3 – according to the Minister Decree of 27 Nov. 2002 [Rozporządzenie MŚ 2002b],
Table 4. Assessment of water usability as a natural habitat for fish
Indicator Unit
Values required for fresh waters as habitat
for fish4:
Frequency of index values (% of samples) in standard range for a given fish category
salmonids cyprinids
point 1 point 2 point 3 point 1 point 2 point 3salmonids cyprinids
Temperature °C 21.52 28.02 98 100 100 100 100 100
Suspended solids mg·dm–3 mean annual value ≤25 31.93 243 29.53 31.93 243 29.53
pH ─ 6–91 100 98 100 100 98 100
Dissolved oxygenmg O2·dm–3
50%≥9 50%≥8 95%≥9 90%≥9 95%≥9 100%≥8 100%≥8 93%≥8
100%≥7 100%≥5 100%≥7 100%≥7 100%≥7 100%≥5 100%≥5 100%≥5
BOD5 ≤31 ≤61 80 85 87 98 97 98
Ptotal mg·dm–3≤0.21 ≤0.41 100 100 97 100 100 100
NO2– ≤0.011 ≤0.031 2 0 2 15 2 5
1 – for 95% of samples, 2 – for 98% of samples, 3 – average value, 4 – according to the Minister Decree of 4 Oct. 2002 [Rozporządzenie MŚ 2002a]
requirements fulfilled requirements not fulfilled
nid and Cyprinid fish under natural conditions in all studied points, due to high concentrations of nitrites and total suspended solids in points 1. and 2. Also, due to BOD5 researched water does not create conditions suitable for Salmonid fish. Values of the temperature, pH, dissolved oxygen and total phosphorus fulfilled the requirements stated for fresh waters which are the habitat of Salmonid and Cyprinid fish under natural condi-tions (Table 4).
CONCLUSIONS
1. From among 19 investigated quality indices, 17 meet the requirements for water quality class I – very good state in each measurement-control point. The Poprad river along the whole 60 km – long investigated reach reveals a good state due to total suspended solids con-centrations in points 1. and 3., and chemical oxygen demand (COD-Mn) in point 2.
Journal of Ecological Engineering vol. 16(1), 2015
108
2. Due to too frequent occurrences of total sus-pended solids concentrations, waters of the Poprad river do not fulfill the requirements for surface waters used for drinking water supply to people. Because of a high number of coli-form and fecal coliform bacteria, a high per-formance water treatment processes should be applied (category A3) in order to obtain water for consumption.
3. Along the studied river reach water did not meet the requirements for natural habitat of Salmonid fish of Salmo spp., Coregonidae (Coregonus) family or for Thymallus thym-allus, fish from the Cyprinid family, or other species, such as Esox Lucius, Perca fluviatilis or Anguilla anguilla, mainly due to high con-centrations of nitrites.
4. Statistical analysis revealed significantly el-evated concentrations of nitrite nitrogen, total phosphorus, phosphates and COD-Mn, but the values of pH, oxygen content and water satu-ration declined along the whole investigated river segment.
REFERENCES
1. Bąk Ł., Górski J., Górska K., Szeląg B. 2012. Zawartość zawiesin i metali ciężkich w wybranych falach ścieków deszczowych w zlewni miejskiej. Ochrona Środowiska, 2(34), 49–52.
2. Bogdał A. Ostrowski K. 2007. Wpływ rolniczego użytkowania zlewni podgórskiej i opadów atmos-ferycznych na jakość wód odpływających z jej ob-szaru. Woda-Środowisko-Obszary Wiejskie, Wyd. Falenty, 7, 2a (20), 59–69.
3. Bogdał A., Ostrowski K. 2009. Loads of selected components supplied with precipitation and flow-ing away from the area of two small catchments with diversified use. Acta Sci. Pol., Formatio Cir-cumiectus, 8 (1–2) 2009, 35–45.
4. Bojakowska I., Gliwicz T., Kozłowska O., Szy-borska-Kaszycka J. 2010. Charakterystyka geo-chemiczna wód rzeki Wieprz. Górnictwo i Geolo-gia, 5 (4), 51–62.
5. Brankov J., Milijasević D., Milanović A. 2012. The Assessment of the Surface Water Quality Using the Water Pollution Index: A Case study of the Timok River (the Danube River Basin), Serbia. Archives of Environmental Protection, 38 (2), 49–61.
6. Dąbrowska J. 2008. Ocena zawartości związków azotu i fosforu w wodach rzeki Trzemny. Infra-struktura i Ekologia Terenów Wiejskich, 7, 57–68.
7. Göbel P., Dierkes C., Coldewey W.G. 2007. Storm water runoff concentration matrix for urban areas. J. Contaminant Hydrol., 91(1-2), 26–42.
8. Grochowska J., Tandyrak R. 2007. Nitrogen and Phosphorus Compounds in Lake Pluszne. Archives of Environmental Protection, 33 (1), 45–59.
9. Gromaire-Mertz M.C., Garnaud S., Gonzalez A., Chebbo G. 1999. Characterization of urban runoff pollution in Paris. Water Sci. Technol., 39(2), 1–8.
10. Húska D., Krupová K., Halaj P., Mandalová K. 2013. Ewaluation of surface water Žitava catchment under the aspect of anthropogenicimpact. Acta Sci. Pol. Formatio Circumiectus, 12(3), 41–51.
11. Kanownik W., Kowalik T., Bogdał A., Ostrowski K., Rajda W. 2011. Jakość i i walory użytkowe wody potoku Szczyrzawy. Zesz. Prob. Post. Nauk Rol., 561, 65–81.
12. Kleiber T. 2012. Pollution of the natural environ-ment in intensive Cultures Under Greenhouses. Ar-chives of Environmental Protection, 38 (2), 45–53.
13. Kowalik T., Bogdał A., Kanownik W., Borek Ł. 2012. Sezonowość zmian wartości wybranych właściwości fizykochemicznych wody odpływa-jącej z małej zlewni rolniczo-leśnej. Gaz, Woda i Technika Sanitarna, 8, 354–357.
14. Kukuła K., Bylak A. 2011. Wpływ czynników antropogenicznych na faunę karpackich dopływów Wisły. Roczniki Bieszczadzkie, 19, 207–222.
15. Lampart-Kałużniacka M., Wojcieszonek A., Pikuła K. 2012. Ocena stanu ekologicznego wód rzeki Regi na odcinku w obszarze miasta Gryfice. An-nual Set The Environment Protection / Rocznik Ochrony Środowiska, 14, 437– 446.
16. Lewandowska-Robak M., Górski Ł., Kowalkowski T., Dąbkowska-Naskręt H., Miesikowska I. 2011. Wpływ ścieków oczyszczonych odprowadzanych z Oczyszczalni Ścieków w Tucholi na jakość wody w strudze Kicz. Inżynieria i Ochrona Środowiska, 14 (3), 209–221.
17. Monaghan R.M., Wilcock R.J., Smith L.C., Tik-kisetty B. Thorrold B.S., Costall D. 2007. Link-ages between land management activities and wa-ter quality in an intensively farmed catchment in southern New Zealand. Agriculture, Ecosystems and Environment, 118, 211–222.
18. Moniewski P., Stolarska M. 2007. Wpływ natu-ralnych i antropogenicznych czynników na pod-stawowe charakterystyki fizykochemiczne wody w małej zlewni strefy podmiejskiej Łodzi. Woda-Środowisko-Obszary Wiejskie, 7, 1(19), 105–122.
19. Napieralska A., Gołdyn R. 2013. Sanitary Analy-ses of Runoff Water a River. Pol. J. Environ. Stud., 22, 2, 481–486.
20. Paredes J., Andreu J., Solera A. 2010. A decision support system for water quality issues in the Man-
109
Journal of Ecological Engineering vol. 16(1), 2015
zanares River (Madrid, Spain). Science of the Total Environment, 408, 2576–2589.
21. Policht-Latawiec A., Kanownik W. 2013. Jakość i walory użytkowe wody rzeki Szabasówki. Acta Sci. Pol., Formatio Circumiectus, 12(2), 93–102.
22. Rozporządzenie Ministra Środowiska z dnia 27 listopada 2002 r. w sprawie wymagań, jakim powinny odpowiadać wody powierzchniowe wykorzystywane do zaopatrzenia ludności w wodę przeznaczoną do spożycia. Dz. U. Nr 204, poz.1728. 2002b
23. Rozporządzenie Ministra Środowiska z dnia 4 października 2002 r. w sprawie wymagań, jakim powinny odpowiadać wody śródlądowe będące środowiskiem życia ryb w warunkach naturalnych. Dz. U. Nr 176, poz. 1455. 2002a
24. Rozporządzenie Ministra Środowiska z dnia 9 lis-topada 2011 r. w sprawie klasyfikacji stanu ekolog-icznego, potencjału ekologicznego i stanu chemic-
znego jednolitych części wód powierzchniowych. Dz. U. Nr 258, poz. 1549. 2011a
25. Rozporządzeniem Ministra Środowiska z dnia 15 listopada 2011 r. w sprawie form i sposobu prow-adzenia monitoringu jednolitych części wód powi-erzchniowych i podziemnych. Dz. U. Nr 258, poz. 1550. 2011b
26. Vicario L. 2012. Zanieczyszczenie powi-etrza i zagrożenie hałasem [dokument elek-troniczny: www.europarl.europa.eu/ftu/pdf/pl/FTU_4.10.6.pdf, dostęp: 15.10.2012 r.].
27. Wiatkowski M., Rosik-Dulewska Cz., Gruss Ł. 2012. Profil zmian wskaźników jakości wody w rzece Stobrawie. Infrastruktura i Ekologia Terenów Wiejskich, 3, 21–35.
28. Wiśniowska-Kielian B., Niemiec M., Arasimo-wicz M. 2013. Przydrożne zbiorniki ścieków opadowych jako element ochrony jakości wód. Inżynieria Ekologiczna, 34, 62–75.