
TELECOMMUNICATIONS AND ELECTRONICS 18wu.utp.edu.pl/uploads/oferta/ZN Telekomunikacja i Elektronika...
46
BYDGOSZCZ – 2014 ZESZYTY NAUKOWE SCIENTIFIC JOURNAL 263 TELEKOMUNIKACJA I ELEKTRONIKA TELECOMMUNICATIONS AND ELECTRONICS 18 UNIWERSYTET TECHNOLOGICZNO-PRZYRODNICZY IM. JANA I JÊDRZEJA ŒNIADECKICH W BYDGOSZCZY
Transcript of TELECOMMUNICATIONS AND ELECTRONICS 18wu.utp.edu.pl/uploads/oferta/ZN Telekomunikacja i Elektronika...

BYDGOSZCZ – 2014
ZESZYTY NAUKOWESCIENTIFIC JOURNAL
263
TELEKOMUNIKACJAI ELEKTRONIKA
TELECOMMUNICATIONSAND ELECTRONICS
18
UNIWERSYTET TECHNOLOGICZNO-PRZYRODNICZYIM. JANA I JÊDRZEJA ŒNIADECKICH
W BYDGOSZCZY
REDAKTOR NACZELNYprof. dr hab. in¿. Józef Flizikowski
REDAKTOR NACZELNY SERIIdr in¿. Beata Marciniak
OPRACOWANIE TECHNICZNEmgr in¿. Daniel Morzyñski
© CopyrightWydawnictwa Uczelniane Uniwersytetu Technologiczno-Przyrodniczego
Bydgoszcz 2014
Utwór w ca³oœci ani we fragmentach nie mo¿e byæ powielanyani rozpowszechniany za pomoc¹ urz¹dzeñ elektronicznych, mechanicznych,
kopiuj¹cych, nagrywaj¹cych i innych bez pisemnej zgodyposiadacza praw autorskich.
Praca powsta³a przy wsparciu projektu„Realizacja II etapu Regionalnego Centrum Innowacyjnoœci”
wspó³finansowanego ze œrodków Europejskiego Funduszu Rozwoju Regionalnegow ramach Regionalnego Programu Operacyjnego
Województwa Kujawsko-Pomorskiego na lata 2007-2013
ISSN 1899-0088
Wydawnictwa Uczelniane Uniwersytetu Technologiczno-Przyrodniczegoul. Ks. A. Kordeckiego 20, 85-225 Bydgoszcz, tel. 52 3749482, 3749426
e-mail: [email protected] http://www.wu.utp.edu.pl/
Wyd. I. Nak³ad 60 egz. Ark. aut. 2,5. Ark. druk. 2,8.Zak³ad Ma³ej Poligrafii UTP Bydgoszcz, ul. Ks. A. Kordeckiego 20

Contents
1. Andrzej Borys, Zbigniew Zakrzewski – On minimization of nonlinear distortion in Sallen and Key filter in range of low frequencies .................................. 5
4. Damian Ledziński, Sandra Śmigiel, Mścisław Śrutek, Adam Marchewka – The method of determining of transmission properties of networks based on regular graphs topology ............................................................................................ 11
2. Sandra Śmigiel, Damian Ledziński – ECG signal analysis for detection BPM ........ 23
3. Sandra Śmigiel, Fatih Zungor, Hunkar Purtul, Inanc Inaloz – Task scheduling algorithms for multi robot environment ................................................................... 33
Lista recenzentów – Reviewers list ............................................................................... 46

UNIWERSYTET TECHNOLOGICZNO-PRZYRODNICZY IM. JANA I JĘDRZEJA ŚNIADECKICH W BYDGOSZCZY
ZESZYTY NAUKOWE NR 263 TELEKOMUNIKACJA I ELEKTRONIKA 18 (2014) 5-10
ON MINIMIZATION OF NONLINEAR DISTORTION IN SALLEN AND KEY FILTER IN RANGE
OF LOW FREQUENCIES
Andrzej Borys1, Zbigniew Zakrzewski2
1 Department of Marine Telecommunications, Gdynia Maritime University,
ul. Morska 83, 81-225 Gdynia, Poland, 2 Faculty of Telecommunications, Computer Science and Electrical Engineering,
University of Science and Technology, al. Prof. S. Kaliskiego 7, 85-796 Bydgoszcz, Poland
Summary. In this paper, we show that a mildly nonlinear model of an active filter using the Volterra series and any other related one do not give satisfactory results in evaluation of nonlinear distortion in the range of low frequencies, in which the operational amplifier output voltage saturation is a dominating nonlinear phenomenon in this filter. Therefore, minimization of the filter nonlinear distortion cannot be performed by minimization of the gain-sensitivity product (GSP) or the so-called distortion aggravation factor (FDAG) in the aforementioned range of frequencies. This is illustrated, using measured data of filter transfer function distortion, on an example of a low-pass Sallen and Key filter.
Keywords: Sallen and Key filter; modeling nonlinear distortion in low frequencies; operational amplifier output voltage saturation; Volterra series; gain-sensitivity product.
1. INTRODUCTION
In an article [2], a method of simultaneous minimization of nonlinear distortion and noise in Sallen and Key filters has been presented. In this approach, Billam used a filter quality measure for filters with single active element that was called by him a distortion aggravation factor FDAG and introduced in his preceding paper [1]. On this occasion, we point out that the results of analysis of harmonic distortion in active filters, presented in [1], follow from a more general analysis of nonlinear circuits using as a tool the Volterra series. This has been shown, among others, in [3, 8]. So, the results derived in this paper with the use of Volterra series are directly related to the those presented by Billam in [2] and [1]. In [1], Billam assumes that gain of the active filter element does not depend upon frequency. From this, it follows that his method of simultaneous minimization of nonlinear distortion and noise [2] regards the range of smaller frequencies, in which such an assumption is valid. On the other hand, in this range of frequencies, operational amplifier output voltage is the dominating nonlinear phenomenon that decides about the
6 Andrzej Borys, Zbigniew Zakrzewski
form and level of the filter nonlinear distortion [7]. This paper tries to explain why an approach exploiting the Volterra series and, equivalently, the method of Billam [1] do not lead to satisfactory results in evaluation of active filter nonlinear distortion in the range of low frequencies. The conclusions drawn here were verified experimentally.
2. FILTER NONLINEAR MODEL BASED ON THE VOLTERRA SERIES
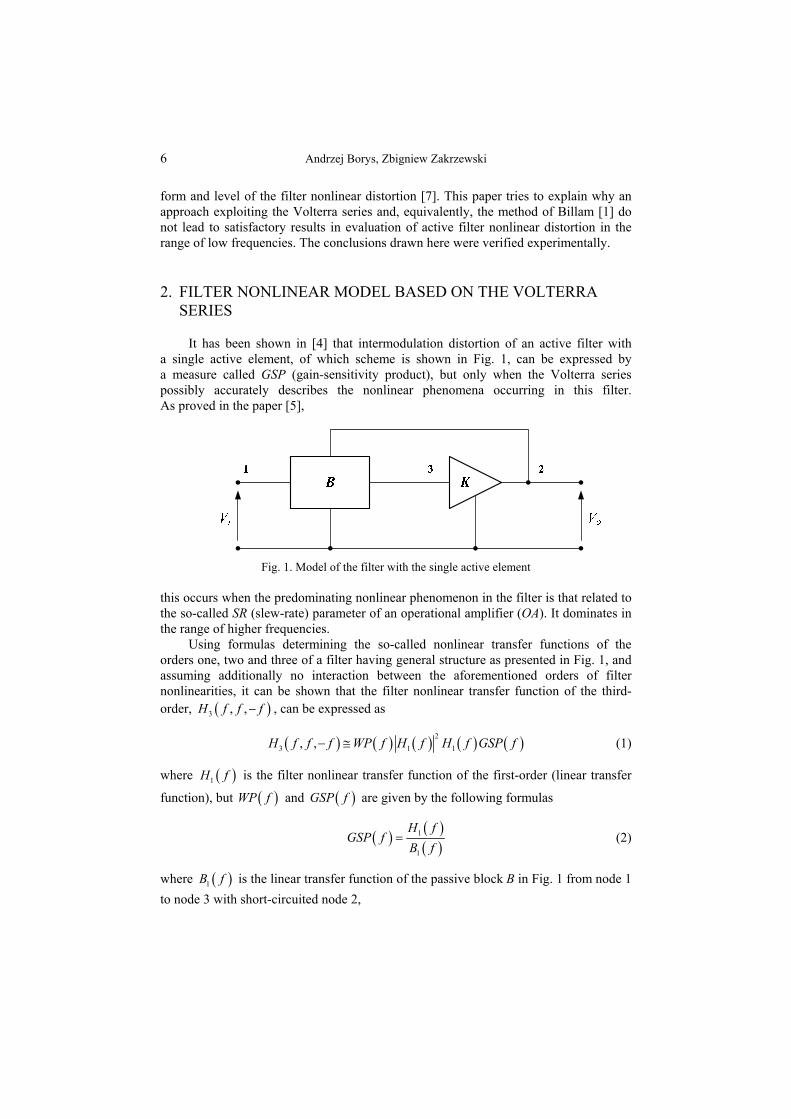
It has been shown in [4] that intermodulation distortion of an active filter with a single active element, of which scheme is shown in Fig. 1, can be expressed by a measure called GSP (gain-sensitivity product), but only when the Volterra series possibly accurately describes the nonlinear phenomena occurring in this filter. As proved in the paper [5],
Fig. 1. Model of the filter with the single active element this occurs when the predominating nonlinear phenomenon in the filter is that related to the so-called SR (slew-rate) parameter of an operational amplifier (OA). It dominates in the range of higher frequencies. Using formulas determining the so-called nonlinear transfer functions of the orders one, two and three of a filter having general structure as presented in Fig. 1, and assuming additionally no interaction between the aforementioned orders of filter nonlinearities, it can be shown that the filter nonlinear transfer function of the third-order, 3 , ,H f f f , can be expressed as
2
3 1 1, ,H f f f WP f H f H f GSP f (1)
where 1H f is the filter nonlinear transfer function of the first-order (linear transfer
function), but WP f and GSP f are given by the following formulas
1
1
H fGSP f
B f (2)
where 1B f is the linear transfer function of the passive block B in Fig. 1 from node 1
to node 3 with short-circuited node 2,
On minimization of nonlinear distortion in Sallen and Key filter... 7
3
1 1 1 1
, ,K f f fWP f
K f K f K f K f
(3)
where 3K and 1K are the third- and first-order, respectively, nonlinear transfer
functions of an active element K of a general filter structure shown in Fig. 1. It has been shown in [4] that, essentially, the function WP f does not depend
upon a method of realization of the active element K in Fig. 1 with the use of an operational amplifier and resistive circuitry (in a positive or negative feedback loop, or as OA without any feedback). The relative change of the filter transfer function magnitude, caused by nonlinearities, can be expressed by the following formula [4]
32
1
, ,3
4
H f f fTAMP
T H f
(4)
where AMP is the amplitude of a single sinusoidal signal at the filter input.
Applying in (4) formulas (1) and (2) leads to
221
3
4
TAMP WP f H f GSP f
T
(5)
On assuming that the function WP f does not depend upon frequency, it can be
shown that the maximum of the function Tf
T
given by (5) occurs at the pole
frequency 0f for the filter pole quality factors 1aQ . Thus, it follows from (5) that if
the nonlinear filter model using the Volterra series description had been also valid in the
range of lower frequencies, the relative change of 0
Tf
T
would have been directly
proportional to the magnitude of the measure 0GSP f . We will check the above in the
next section.
3. SALLEN AND KEY FILTER For the purpose of checking the validity of the filter nonlinear model based on the Volterra series presented shortly in the previous section, a low-pass Sallen and Key filter has been designed. Its structure is shown in Fig. 2. The filter pole quality factor was chosen to be 5aQ , but the pole frequency 0 1 kHzf . The filter was designed in
two variants: first with the following values of 2 1 1C C c and 2 1 1R R r , and
second with such the values: 2 1 0.0206C C c and 2 1 100R R r . The value of
the parameter β in Fig. 2 was chosen to be the same in both variants, namely 2.8 .
8 Andrzej Borys, Zbigniew Zakrzewski
In
-R
Out+
R1 R2 C2
C1
( - 1)R
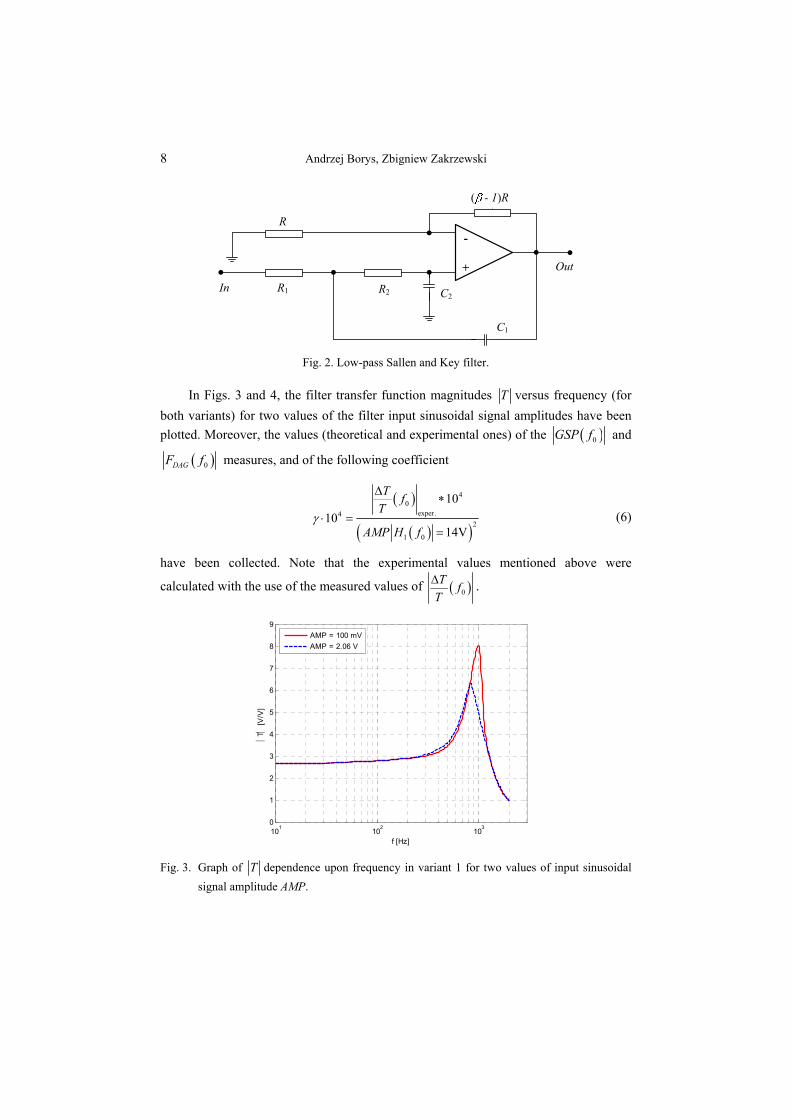
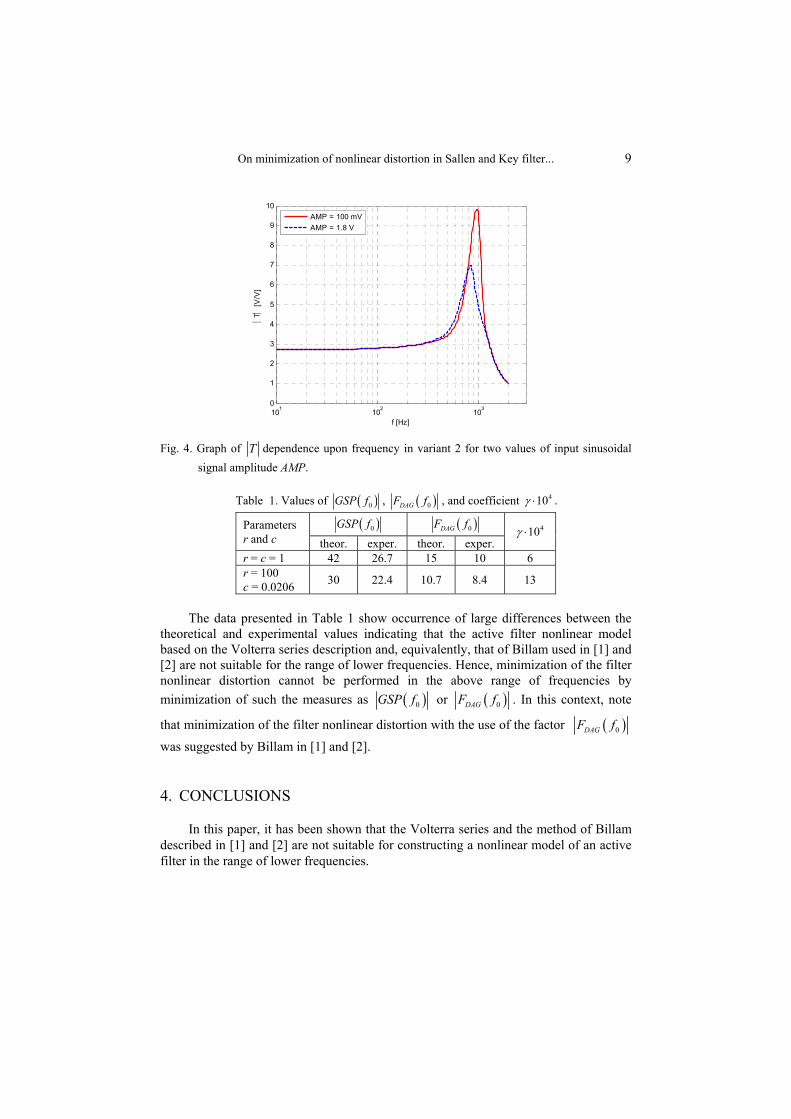
Fig. 2. Low-pass Sallen and Key filter. In Figs. 3 and 4, the filter transfer function magnitudes T versus frequency (for
both variants) for two values of the filter input sinusoidal signal amplitudes have been
plotted. Moreover, the values (theoretical and experimental ones) of the 0GSP f and
0DAGF f measures, and of the following coefficient
40
exper.42
1 0
10
1014V
Tf
T
AMP H f
(6)
have been collected. Note that the experimental values mentioned above were
calculated with the use of the measured values of 0
Tf
T
.
101
102
103
0
1
2
3
4
5
6
7
8
9
f [Hz]
T
[V/V
]
AMP = 100 mV
AMP = 2.06 V
Fig. 3. Graph of T dependence upon frequency in variant 1 for two values of input sinusoidal
signal amplitude AMP.
On minimization of nonlinear distortion in Sallen and Key filter... 9
101
102
103
0
1
2
3
4
5
6
7
8
9
10
f [Hz]
T
[V/V
]
AMP = 100 mV
AMP = 1.8 V
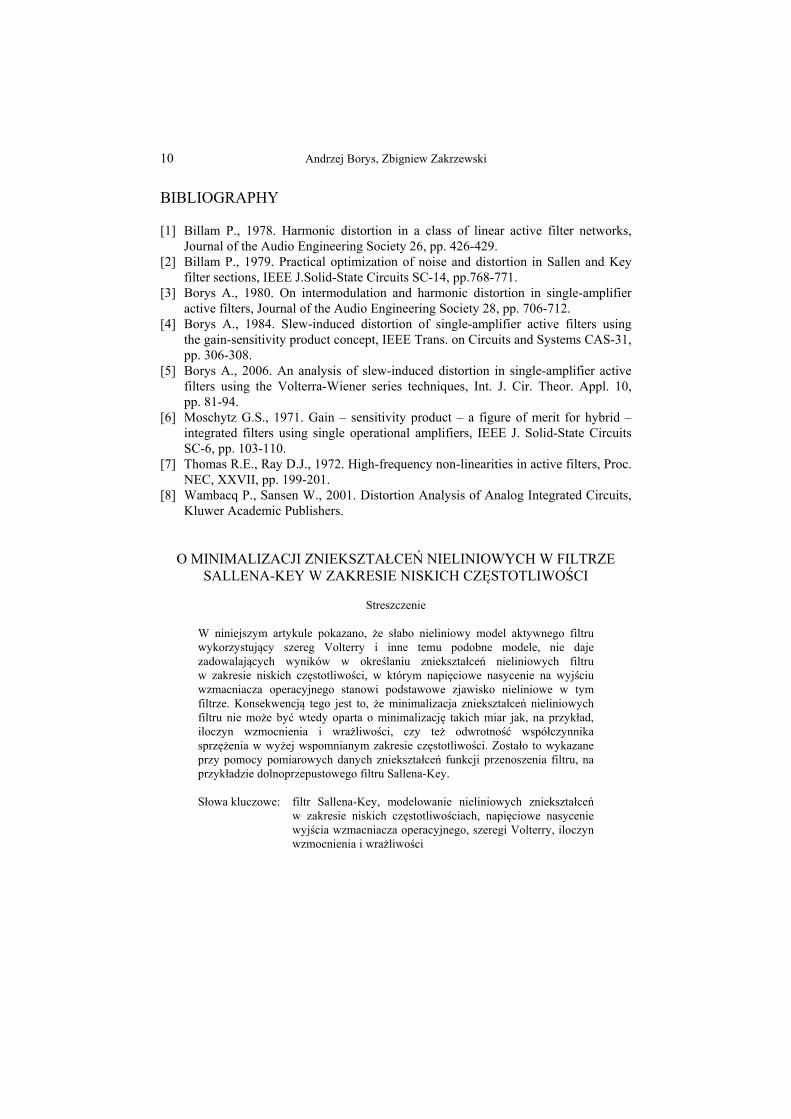
Fig. 4. Graph of T dependence upon frequency in variant 2 for two values of input sinusoidal
signal amplitude AMP.
Table 1. Values of 0GSP f , 0DAGF f , and coefficient 410 .
Parameters r and c
0GSP f 0DAGF f 410 theor. exper. theor. exper.
r = c = 1 42 26.7 15 10 6 r = 100 c = 0.0206
30 22.4 10.7 8.4 13
The data presented in Table 1 show occurrence of large differences between the theoretical and experimental values indicating that the active filter nonlinear model based on the Volterra series description and, equivalently, that of Billam used in [1] and [2] are not suitable for the range of lower frequencies. Hence, minimization of the filter nonlinear distortion cannot be performed in the above range of frequencies by
minimization of such the measures as 0GSP f or 0DAGF f . In this context, note
that minimization of the filter nonlinear distortion with the use of the factor 0DAGF f
was suggested by Billam in [1] and [2].
4. CONCLUSIONS
In this paper, it has been shown that the Volterra series and the method of Billam described in [1] and [2] are not suitable for constructing a nonlinear model of an active filter in the range of lower frequencies.
10 Andrzej Borys, Zbigniew Zakrzewski
BIBLIOGRAPHY
[1] Billam P., 1978. Harmonic distortion in a class of linear active filter networks, Journal of the Audio Engineering Society 26, pp. 426-429.
[2] Billam P., 1979. Practical optimization of noise and distortion in Sallen and Key filter sections, IEEE J.Solid-State Circuits SC-14, pp.768-771.
[3] Borys A., 1980. On intermodulation and harmonic distortion in single-amplifier active filters, Journal of the Audio Engineering Society 28, pp. 706-712.
[4] Borys A., 1984. Slew-induced distortion of single-amplifier active filters using the gain-sensitivity product concept, IEEE Trans. on Circuits and Systems CAS-31, pp. 306-308.
[5] Borys A., 2006. An analysis of slew-induced distortion in single-amplifier active filters using the Volterra-Wiener series techniques, Int. J. Cir. Theor. Appl. 10, pp. 81-94.
[6] Moschytz G.S., 1971. Gain – sensitivity product – a figure of merit for hybrid – integrated filters using single operational amplifiers, IEEE J. Solid-State Circuits SC-6, pp. 103-110.
[7] Thomas R.E., Ray D.J., 1972. High-frequency non-linearities in active filters, Proc. NEC, XXVII, pp. 199-201.
[8] Wambacq P., Sansen W., 2001. Distortion Analysis of Analog Integrated Circuits, Kluwer Academic Publishers.
O MINIMALIZACJI ZNIEKSZTAŁCEŃ NIELINIOWYCH W FILTRZE SALLENA-KEY W ZAKRESIE NISKICH CZĘSTOTLIWOŚCI
Streszczenie
W niniejszym artykule pokazano, że słabo nieliniowy model aktywnego filtru wykorzystujący szereg Volterry i inne temu podobne modele, nie daje zadowalających wyników w określaniu zniekształceń nieliniowych filtru w zakresie niskich częstotliwości, w którym napięciowe nasycenie na wyjściu wzmacniacza operacyjnego stanowi podstawowe zjawisko nieliniowe w tym filtrze. Konsekwencją tego jest to, że minimalizacja zniekształceń nieliniowych filtru nie może być wtedy oparta o minimalizację takich miar jak, na przykład, iloczyn wzmocnienia i wrażliwości, czy też odwrotność współczynnika sprzężenia w wyżej wspomnianym zakresie częstotliwości. Zostało to wykazane przy pomocy pomiarowych danych zniekształceń funkcji przenoszenia filtru, na przykładzie dolnoprzepustowego filtru Sallena-Key. Słowa kluczowe: filtr Sallena-Key, modelowanie nieliniowych zniekształceń
w zakresie niskich częstotliwościach, napięciowe nasycenie wyjścia wzmacniacza operacyjnego, szeregi Volterry, iloczyn wzmocnienia i wrażliwości
UNIWERSYTET TECHNOLOGICZNO-PRZYRODNICZY IM. JANA I JĘDRZEJA ŚNIADECKICH W BYDGOSZCZY
ZESZYTY NAUKOWE NR 263 TELEKOMUNIKACJA I ELEKTRONIKA 18 (2014) 11-22
THE METHOD OF DETERMINING OF TRANSMISSION PROPERTIES OF NETWORKS BASED ON REGULAR GRAPHS
TOPOLOGY
Damian Ledziński, Sandra Śmigiel, Mścisław Śrutek, Adam Marchewka
University of Technology and Life Sciences Faculty of Telecommunications, Computer Science and Electrical Engineering
al. prof. S. Kaliskiego 7, 85-789 Bydgoszcz, Poland [email protected], [email protected], [email protected]
Summary: The paper presents a methodology of study the properties of the transmission networks modeled by 3’rd and 4’th degree chordal rings, developed by the authors. Research methodology is based on two kinds of tests. First of them, measured the amount of data transmitted in different network structures using the HTTP protocol. The second, was measured quality of the received video stream, by the SSIM (Structural similarity) method. For testing, the set of virtual machines, connected by virtual network of 3rd and 4th chordal rings topology were used.
Keywords: network, chordal rings, graph, quality, capacity.
1. INTRODUCTION
Due to the rapid growth of the traffic occurring on the Internet, which doubles every year [7, 10, 14], it is necessary to increase the capacity of existing networks. To ensure the quality of the transmission it is necessary to increase the network capacity and reduce the delays in data transmission, what is particularly important in the transmissions of images [11]. To meet these demands, more new generation of sophisticated equipment is introduced, which enables faster data transmission. An example of such activities is application of optical networks with expanded optical domain where optical routers and switches are [8, 9]. Many of the operating systems are not built with the usage of the latest technology. But also in such case it should be looked for the appropriate solution to ensure the quality of transmission. It was found that besides the usage of the equipment the significant impact on network bandwidth have also the usage of communication protocols, the management of network resources, that allowing to adapt this structure to changing conditions and requirements and as the implemented topology of the network [3, 13].
The network transmission is a primary component of Information and Communications Technology systems (ICT). The ICT systems consists of a routing equipment and software, providing the necessary processing power, storage, and routing, with the usage of appropriate network end device. The ICT consist of a large
12 D. Ledziński, S. Śmigiel, M. Śrutek, A. Marchewka
number of intelligent nodes, which aim is to provide users a specific range of services, by ensuring relevant quality, speed and reliability of the system. The main issue in design and analysis of ICT systems is a topology of the different layers which are interconnected between each other (Interconnection Network), this especially impacts the effectiveness of whole system [12].
The network structures can be modeled with the usage of graphs [4, 5, 6]. In telecommunication systems the basic network topology is a ring topology. In network formed into ring nodes are represented as a switching modules or specialized computers, and the edges are a bidirectional independent transmissions channels which connects these nodes. This type of graph is called an undirected graph of single Hamilton cycle (ring graph), so that there are always two ways to connecting two arbitrary network nodes. The direction of the traffic flow in this type of graph can be clockwise or counter-clockwise. In practice this connection is realized using optical fibers. The usage of this topology improves the reliability of the transmission, because the failure of a link or node does not cause the failure of whole corruption system, but it will be the cause of decrease of the efficiency of data transfer in the network. The advantage of this network structure is also standardization of nodes, small number of intermediating links and good scalability [2]. Moreover, as is clear from the theory of reliability, the ring topology has the best reliability to cost factor [1, 15].
However, the network structure based on ring structure has the worst transmission properties. For example, if a part of this structure shall be nodes and we want to ensure the exchange of data between any node, it is necessary to flow the network traffic through all the intermediating nodes. Thus, each of these nodes must receive and send data to the next nodes, which causes the reduction of the transmission speed and increases of the delay of transmitted data.
The addition of additional connections between the nodes, called chords, causes increase of the network bandwidth. This structure, called „chordal ring”, Arden and Lee used to build multicomputer network, to speed up the computational processes.
Usage of a chordal ring led to reduction in the number of the intermediary transmitting nodes. The reduction of the number of nodes provided the minimization of the occurring the delays, and by appropriate choice of the length of these chords, the network can be optimized for increasing its capacity. Chordal ring is a special case of regular graph, in which each vertex has the same degree. The usage of chordal rings enables to: standardization of equipment nodes, obtaining symmetry calls. Moreover, it provides ease of routing, good scalability and easy network management. The whole of this task reduces the total cost of building and operating the network.
The aim of this publication is to present the testing methodology, samples of regular structures and results obtained from the study with conclusions justifying the usage of the chosen topology connections in real life case scenario.
2. EVALUATION METHOD OF NETWORK TRANSMISSION PROPERTIES
In order to evaluate the important parameters of networks, which are bandwidth and the delay of transmitted information it is necessary to carry out the samples from the test topology described by regular graphs. These studies were performed using a set of virtual machines connected to each other via VPN which simulates the real network.
The method of determining of transmission properties... 13
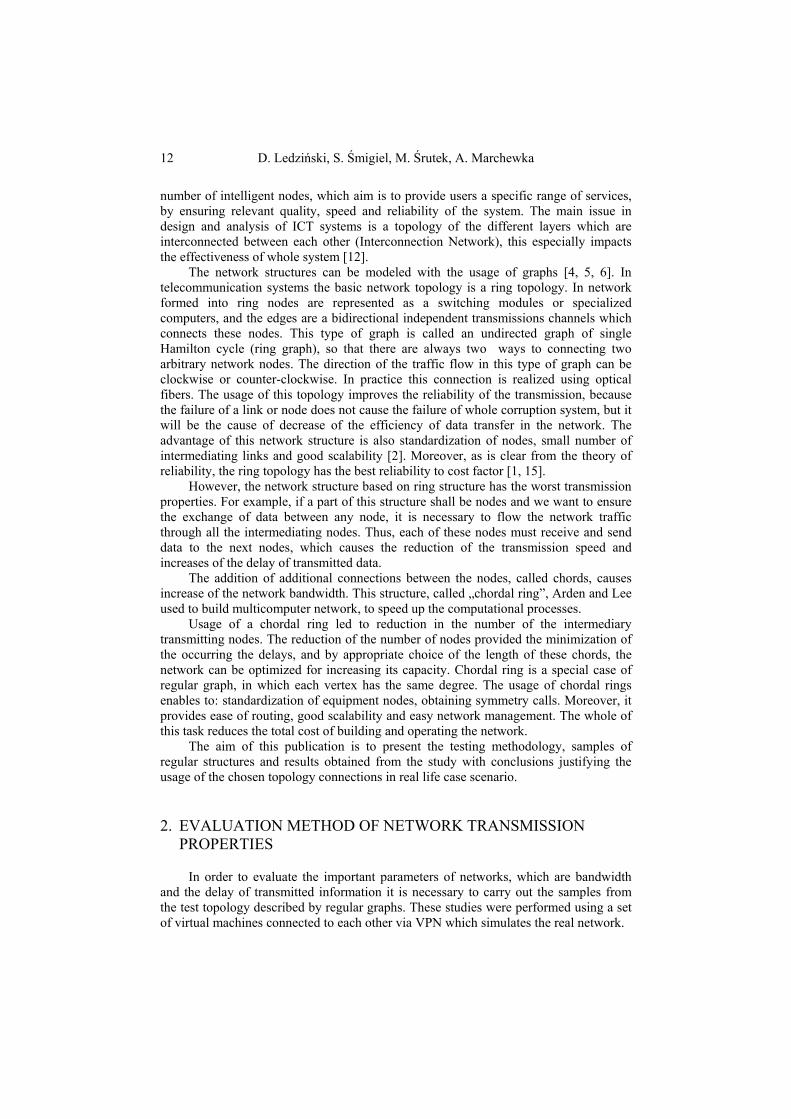
Fig. 1. Diagram of an exemplary network
Vertices of graph and thereby nodes of network are the routers. This nodes are connected between each other by links which are performing the role of the edges of the graph (Fig. 1). Assumption of uniformity of the traffic on the network was used. For each of the routers proper subnet was set, which contains server and clients (the number of which is equal and predetermined). In order to access the data files stored in the servers connected to other routers, each user sends a query to them. The server sends answer with the desired data. During testing was also carried streaming – servers sent video files addressed to clients belonging to other subnets. In this way traffic was generated. It was used to test the network.
The analyzed networks were built based on the software routers installed on virtual machines running under the operating system Vyatta [15]. It is a Linux distribution designed to use it as a router or firewall. For virtualization was used the open-source software called VirtualBox. It has a wide range of configuration of network interfaces of virtual machines. For the interconnection of routers was used “Internal Networking” mode, which allows to create Ethernet connections between virtual machines. To manage the configuration of the whole network and as the software of servers and clients set of original programs implemented in Java and Python was used.
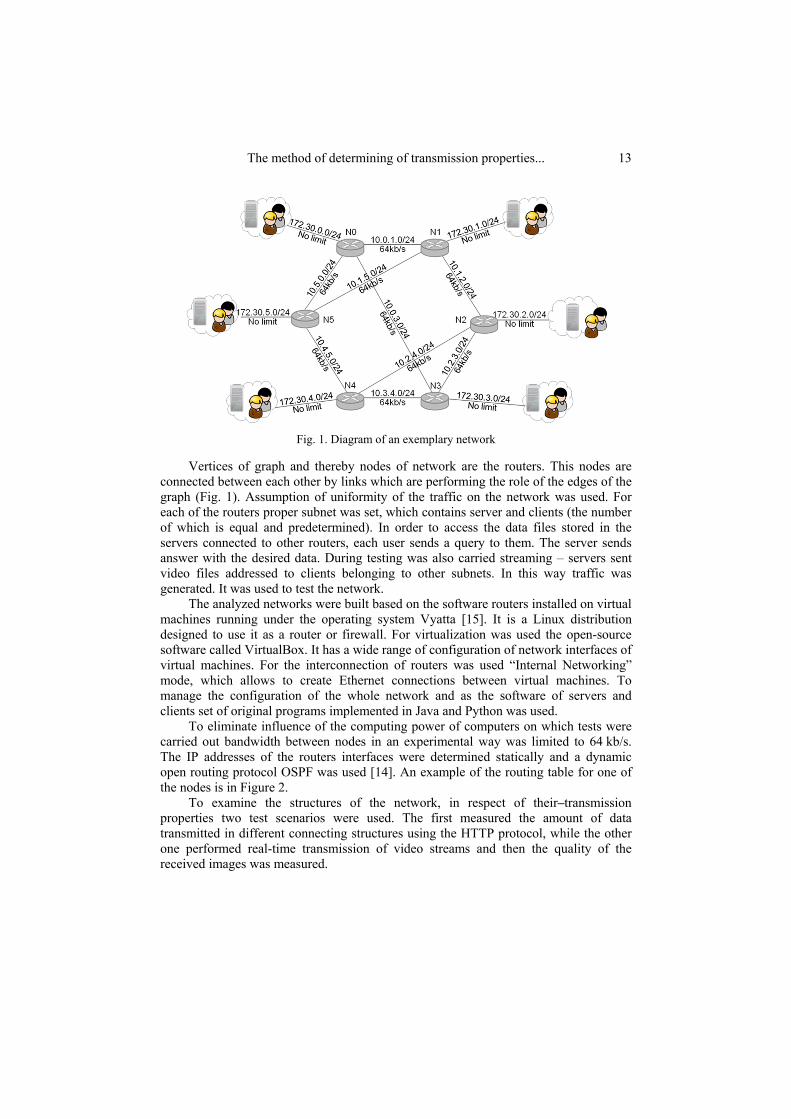
To eliminate influence of the computing power of computers on which tests were carried out bandwidth between nodes in an experimental way was limited to 64 kb/s. The IP addresses of the routers interfaces were determined statically and a dynamic open routing protocol OSPF was used [14]. An example of the routing table for one of the nodes is in Figure 2.
To examine the structures of the network, in respect of their–transmission properties two test scenarios were used. The first measured the amount of data transmitted in different connecting structures using the HTTP protocol, while the other one performed real-time transmission of video streams and then the quality of the received images was measured.
14 D. Ledziński, S. Śmigiel, M. Śrutek, A. Marchewka
Fig. 2. An example of the routing table
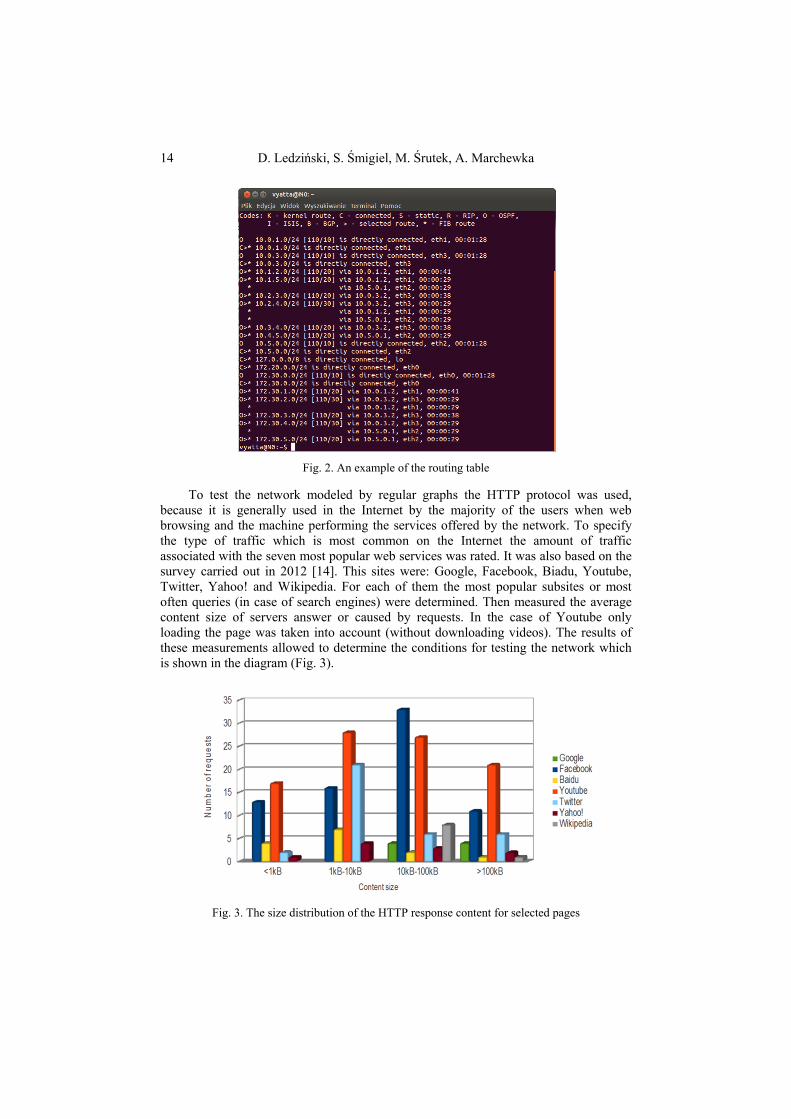
To test the network modeled by regular graphs the HTTP protocol was used, because it is generally used in the Internet by the majority of the users when web browsing and the machine performing the services offered by the network. To specify the type of traffic which is most common on the Internet the amount of traffic associated with the seven most popular web services was rated. It was also based on the survey carried out in 2012 [14]. This sites were: Google, Facebook, Biadu, Youtube, Twitter, Yahoo! and Wikipedia. For each of them the most popular subsites or most often queries (in case of search engines) were determined. Then measured the average content size of servers answer or caused by requests. In the case of Youtube only loading the page was taken into account (without downloading videos). The results of these measurements allowed to determine the conditions for testing the network which is shown in the diagram (Fig. 3).
Fig. 3. The size distribution of the HTTP response content for selected pages
The method of determining of transmission properties... 15
The chart shows that the largest number of inquiries related to the website YouTube and social networking sites like Facebook, and a little less- Twitter. Size of transferred data was correlated with the type of the observed portal. In case of YouTube can be considered that the distribution of the transmitted data was reasonably uniform for the entire test range of 1 kB to 100 kB. In the case of Facebook, most data had size ranged from 10 kB to 100 kB, while the majority of data from Twitter had a size of 1 kB to 10 kB. Based on this analysis, taking into account the possibility of used computers and required bandwidth, it is assumed that the test data a size is between 1 kB and 32 kB.
Tests using the HTTP protocol were carried out assuming the following initial conditions: networks were described with fourth-degree regular graphs consists of 24 nodes; clients send requests to web servers, and download speed of response was measured
(the size of data without the size of the HTTP headers was taken into account).
The average data transfer rate was calculated according to the formula:
Tmn
TDane
V
n
i
m
j
ij
TR
)1(
)(
kB/s
1
0 1
(1)
where: counter determines the amount of data during the test, n – amount of servers, m – amount of clients in the node, T – time of the test.
HTTP requests were generated by 5 users in each node with the assumed uniform distribution of probability selection of target servers to which queries were addressed;
for the submitted queries users received a response about the size of 1 ÷ 32 K; the study was conducted for timeouts changed in the range of 10000 ÷ 50000 ms; the frequency of sending queries varied in the range 0.02 ÷ 0.2 Hz; as the result of the test assumed the arithmetic mean of the results obtained from the
three replicates of the same test.
The study of the network transmission properties were performed via the streaming transmission according to the following rules.
Between the servers and clients were transmitted video streams. For the tests were used records, obtained from the database LIVE and the database EPFL, while maintaining the cumulative 15-second duration on transmission of a single stream. These samples (30 frames per second) were stored in YUV format.
To carry out the tests in conditions similar to those that occur in real networks, has been carried out pre-conversion films used for H.264 [15]. For this purpose, used two tools Mencoder and avaconf. During converting the recordings resolutions were reduced, established the number of frames per second, it means that the frequency with which static images were sent to the recipient was fixed. In addition, experimentally were chosen the parameters: CRF (Constant Rate Factor), responsible for the quality of the converted images and also parameter specifying the maximum interval between frames, containing all the frame of images [9].
16 D. Ledziński, S. Śmigiel, M. Śrutek, A. Marchewka
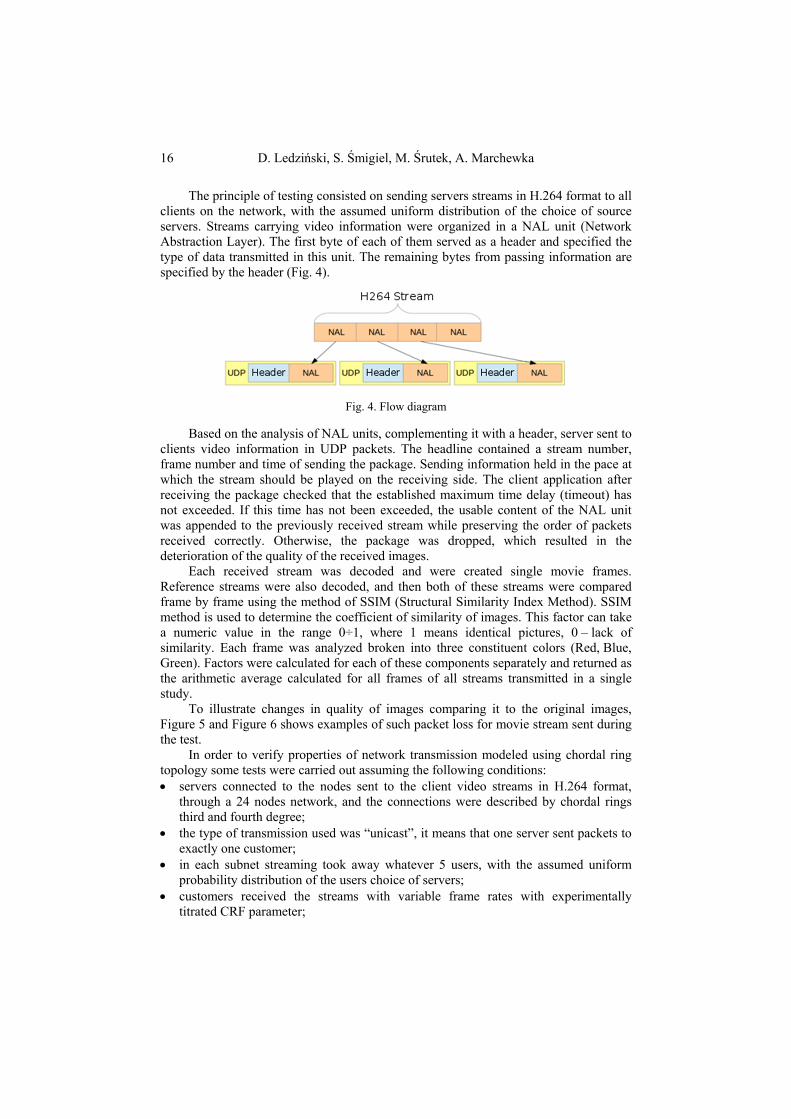
The principle of testing consisted on sending servers streams in H.264 format to all clients on the network, with the assumed uniform distribution of the choice of source servers. Streams carrying video information were organized in a NAL unit (Network Abstraction Layer). The first byte of each of them served as a header and specified the type of data transmitted in this unit. The remaining bytes from passing information are specified by the header (Fig. 4).
Fig. 4. Flow diagram
Based on the analysis of NAL units, complementing it with a header, server sent to clients video information in UDP packets. The headline contained a stream number, frame number and time of sending the package. Sending information held in the pace at which the stream should be played on the receiving side. The client application after receiving the package checked that the established maximum time delay (timeout) has not exceeded. If this time has not been exceeded, the usable content of the NAL unit was appended to the previously received stream while preserving the order of packets received correctly. Otherwise, the package was dropped, which resulted in the deterioration of the quality of the received images.
Each received stream was decoded and were created single movie frames. Reference streams were also decoded, and then both of these streams were compared frame by frame using the method of SSIM (Structural Similarity Index Method). SSIM method is used to determine the coefficient of similarity of images. This factor can take a numeric value in the range 0÷1, where 1 means identical pictures, 0 – lack of similarity. Each frame was analyzed broken into three constituent colors (Red, Blue, Green). Factors were calculated for each of these components separately and returned as the arithmetic average calculated for all frames of all streams transmitted in a single study.
To illustrate changes in quality of images comparing it to the original images, Figure 5 and Figure 6 shows examples of such packet loss for movie stream sent during the test.
In order to verify properties of network transmission modeled using chordal ring topology some tests were carried out assuming the following conditions: servers connected to the nodes sent to the client video streams in H.264 format,
through a 24 nodes network, and the connections were described by chordal rings third and fourth degree;
the type of transmission used was “unicast”, it means that one server sent packets to exactly one customer;
in each subnet streaming took away whatever 5 users, with the assumed uniform probability distribution of the users choice of servers;
customers received the streams with variable frame rates with experimentally titrated CRF parameter;

The method of determining of transmission properties... 17
the study was conducted for timeouts which changed between 1000÷5000 ms; the result of the test was a qualitative SSIM value arising from the comparison of
sent and received frames from streams.
Fig. 5. Original picture without compression
Fig. 6. Reconstructed picture with the SSIM = 0.549
3. TEST RESULTS
The Figure 7 shows an example of network topologies described by fourth-degree graphs, which have been tested.
Fig. 7. Example of network topologies described by fourth degree graphs
18 D. Ledziński, S. Śmigiel, M. Śrutek, A. Marchewka
4. THE NETWORK TEST WITH THE USAGE OF THE HTTP PROTOCOL
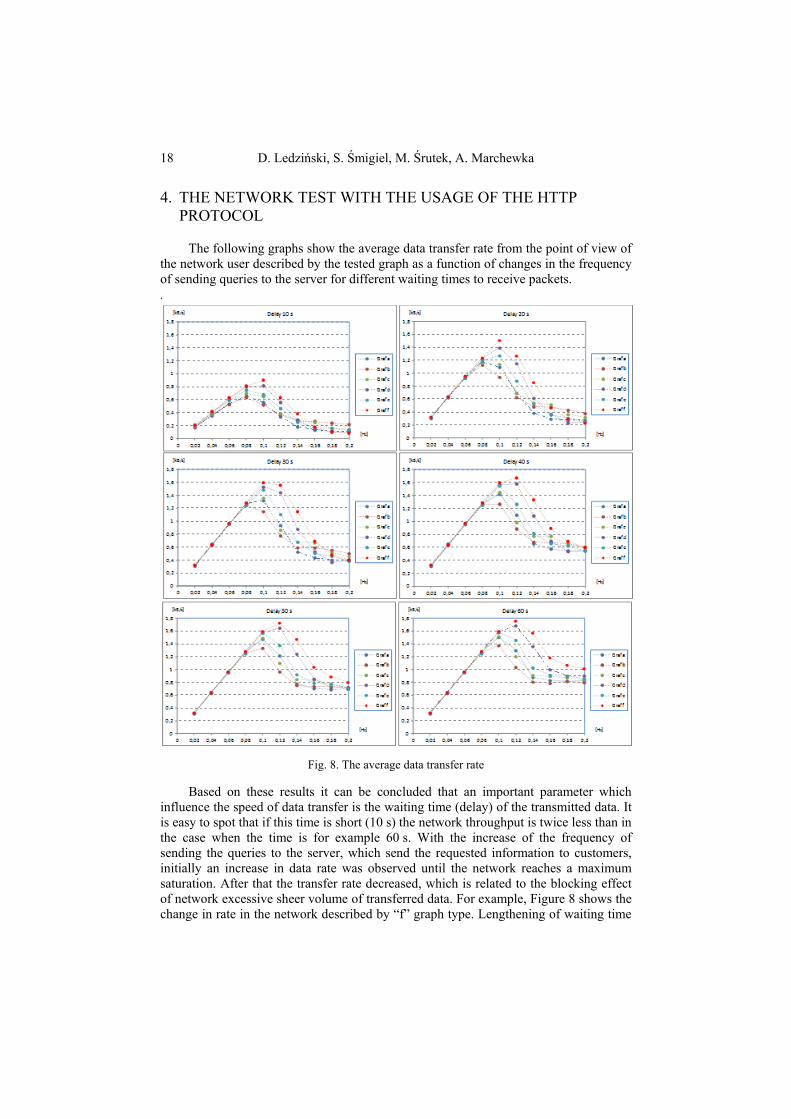
The following graphs show the average data transfer rate from the point of view of the network user described by the tested graph as a function of changes in the frequency of sending queries to the server for different waiting times to receive packets. ‘
Fig. 8. The average data transfer rate
Based on these results it can be concluded that an important parameter which influence the speed of data transfer is the waiting time (delay) of the transmitted data. It is easy to spot that if this time is short (10 s) the network throughput is twice less than in the case when the time is for example 60 s. With the increase of the frequency of sending the queries to the server, which send the requested information to customers, initially an increase in data rate was observed until the network reaches a maximum saturation. After that the transfer rate decreased, which is related to the blocking effect of network excessive sheer volume of transferred data. For example, Figure 8 shows the change in rate in the network described by “f” graph type. Lengthening of waiting time
The method of determining of transmission properties... 19
for packages does not bring significant profits, while only slowing down the whole processes in the network.
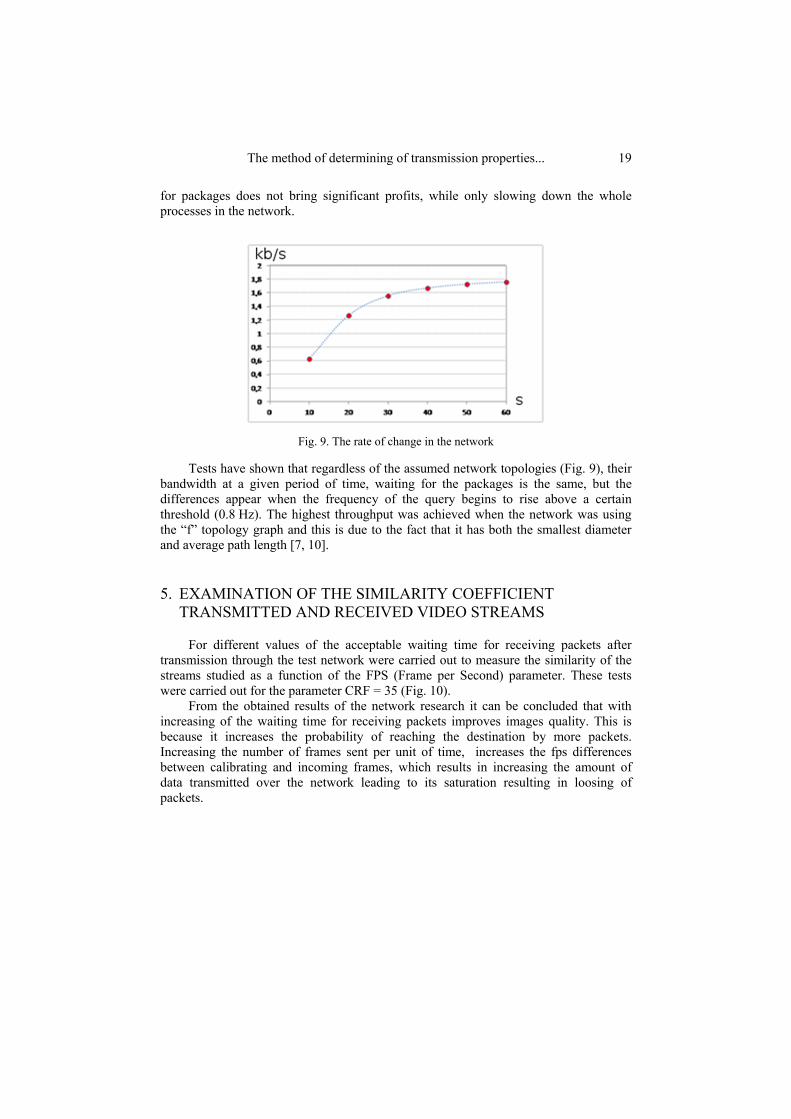
Fig. 9. The rate of change in the network
Tests have shown that regardless of the assumed network topologies (Fig. 9), their bandwidth at a given period of time, waiting for the packages is the same, but the differences appear when the frequency of the query begins to rise above a certain threshold (0.8 Hz). The highest throughput was achieved when the network was using the “f” topology graph and this is due to the fact that it has both the smallest diameter and average path length [7, 10].
5. EXAMINATION OF THE SIMILARITY COEFFICIENT TRANSMITTED AND RECEIVED VIDEO STREAMS
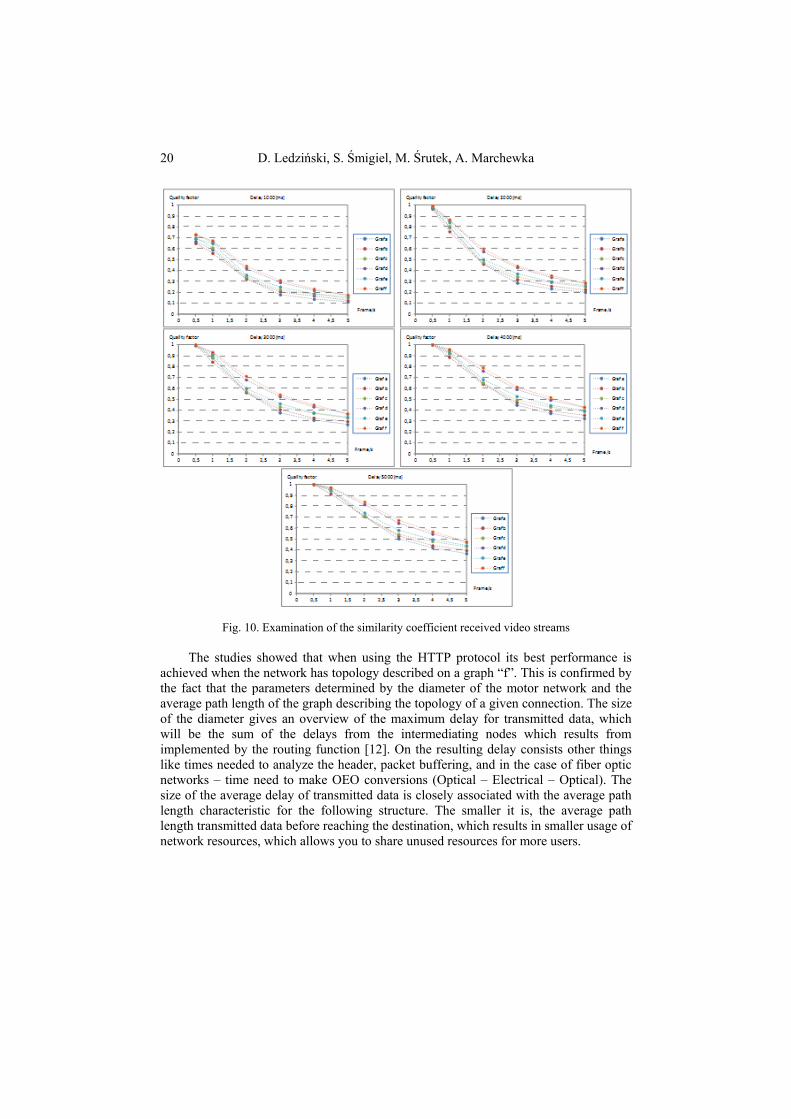
For different values of the acceptable waiting time for receiving packets after transmission through the test network were carried out to measure the similarity of the streams studied as a function of the FPS (Frame per Second) parameter. These tests were carried out for the parameter CRF = 35 (Fig. 10).
From the obtained results of the network research it can be concluded that with increasing of the waiting time for receiving packets improves images quality. This is because it increases the probability of reaching the destination by more packets. Increasing the number of frames sent per unit of time, increases the fps differences between calibrating and incoming frames, which results in increasing the amount of data transmitted over the network leading to its saturation resulting in loosing of packets.
20 D. Ledziński, S. Śmigiel, M. Śrutek, A. Marchewka
Fig. 10. Examination of the similarity coefficient received video streams The studies showed that when using the HTTP protocol its best performance is
achieved when the network has topology described on a graph “f”. This is confirmed by the fact that the parameters determined by the diameter of the motor network and the average path length of the graph describing the topology of a given connection. The size of the diameter gives an overview of the maximum delay for transmitted data, which will be the sum of the delays from the intermediating nodes which results from implemented by the routing function [12]. On the resulting delay consists other things like times needed to analyze the header, packet buffering, and in the case of fiber optic networks – time need to make OEO conversions (Optical – Electrical – Optical). The size of the average delay of transmitted data is closely associated with the average path length characteristic for the following structure. The smaller it is, the average path length transmitted data before reaching the destination, which results in smaller usage of network resources, which allows you to share unused resources for more users.
The method of determining of transmission properties... 21
6. SUMMATION
The article discusses the methodology of the study of properties of transmission in networks modeled by chordal graphs. For this purpose two types of tests where performed. One of them relied on the measurement of the amount of data transmitted in different network structures using the HTTP protocol, while the second was the measurement of the quality of the received images in a video stream by the comparative method called SSIM (Structural Similarity).
The obtained tests results confirmed the validity of the assumption that both the diameter and the average length of the paths have a decisive impact on the throughput and delays of the data sent over the network.
The tests were performed according to the concept proposed by the author involving the usage of a set of virtual machines connected to each other in virtual chordal rings network topology. To make sure that the method is correct, additional tests were conducted using a network modeled by chordal rings using real devices. The obtained results confirmed that the results obtained from simulations. Analyzing the results of both tests we can make an attempt to estimate the received packets minimum waiting time to get establish the capacity and acceptable image quality as a function of the frequency of transmitted frames when streaming. The conclusion is that the proposed method using a set of virtual machines allows for the examination to make the topology optimization before they are put into service.
BIBLIOGRAPHY
[1] Agata N., Agata A., Nishimura K., 2013. A design algorithm for ring topology centralized-radio-access network, 17th International Conference on Optical Network Design and Modeling, pp. 173-178.
[2] Angskun T., Bosilca G., Dongarra J., 2007. Binomial graph: a scalable and fault-tolerant logical network topology, Parallel and Distributed Processing and Applications.
[3] Bujnowski S., Dubalski B., Marciniak T., Zabłudowski A., 2009. The Method of Choosing Chordal Rings Higher Nodal Degree with Good Transmission Properties, Image Processing and Communications 14(1), pp. 25-34.
[4] Bujnowski S., Dubalski B., Zabłudowski A., 2004. Analysis of 4th degree chordal rings, Proceedings of International Conference on the Communications in Computing, Las Vegas, pp. 318-324.
[5] Bujnowski S., Dubalski B., Zabłudowski A., 2005. Analysis of transmission properties of 3rd degree chordal rings, Kwartalnik Elektroniki i Telekomunikacji 51(4), pp. 521-539.
[6] Bujnowski S., Dubalski B., Zabłudowski A., Ledziński D., Marciniak T., Pedersen J.M., 2010. Comparison of Modified 6 Degree Chordal Rings, Image Processing and Communications, Springer, pp. 435-446.
[7] Coffman K.G., Odlyzko A.M., 2002. Growth of the Internet, Optical Fiber Telecommunicaitons IV B: Systems and Impairments, Academic Press, pp. 17-56.
22 D. Ledziński, S. Śmigiel, M. Śrutek, A. Marchewka
[8] Han Q., Yufeng Li., Jiangxing Wu., 2006. Interactive buffer sizing for core routers, IET International Conference on Wireless: Mobile and Multimedia Networks, pp. 1-4.
[9] Lakshmikantha A., Srikant R., Beck C., 2008. Impact of file arrivals and departures on buffer sizing in core routers, The 27th Conference on Computer Communications, IEEE INFOCOM, pp. 26.
[10] Leavitt N., 2010. Network-usage changes push Internet traffic to the edge, Computer 43, pp. 13-15.
[11] Li Li., Qing-Shan J., Heng-Tao W., Ruixi Y., Xiaohong G., 2011. A near optimal solution for network topology reconfigurations with limited link resources, 9th World Congress on Intelligent Control and Automation (WCICA), pp. 489- -494.
[12] Pedersen J.M., Riaz T.M., Dubalski B.; Madsen O.B., 2008. A comparison of network planning strategies, 10th International Conference on Advanced Communication Technology, pp. 702-707.
[13] Teng F., Zhou G., 2009. The research of an approach to design local area network topology based on genetic algorithm, Second International Symposium on Computational Intelligence and Design, pp. 184-189.
[14] Xiangqian Ch., Makki K., Yen K., Pissinou N., 2007. A new network topology evolution generator based on traffic increase and distribution model., Sixth International Conference on Networking.
[15] Yoon G., Kwon D.H., Kwon S.Ch., Park Y.O., Lee Y.J., 2006. Ring topology- -based redundancy Ethernet for industrial network, International Joint Conference SICE-ICASE, pp. 1404-1407.
METODA BADANIA WŁAŚCIWOŚCI TRANSMISYJNYCH SIECI
O TOPOLOGII GRAFÓW REGULARNYCH
Streszczenie
W artykule zaprezentowano opracowaną przez autorów metodykę badania własności transmisyjnych sieci modelowanych przy pomocy grafów cięciwowych trzeciego i czwartego stopnia. W tym celu użyto dwóch testów. Jeden z nich polegał na pomiarze ilości danych przesyłanych w różnych strukturach sieciowych przy pomocy protokołu HTTP, natomiast w drugim mierzona była jakość odebranych obrazów w strumieniach video metodą porównawczą SSIM (Structural SIMilarity). Testy były wykonane według opracowanej przez autora koncepcji polegającej na wykorzystaniu zbioru maszyn wirtualnych połączonych pomiędzy sobą wirtualną siecią o topologii pierścieni cięciwowych trzeciego i czwartego stopnia.
Keywords: sieci, pierścienie cięciwowe, graf, jakość, wydajność
UNIWERSYTET TECHNOLOGICZNO-PRZYRODNICZY IM. JANA I JĘDRZEJA ŚNIADECKICH W BYDGOSZCZY
ZESZYTY NAUKOWE NR 263 TELEKOMUNIKACJA I ELEKTRONIKA 18 (2014) 23-31
ECG SIGNAL ANALYSIS FOR DETECTION BPM
Sandra Śmigiel, Damian Ledziński
University of Technology and Life Sciences Faculty of Telecommunications, Computer Science and Electrical Engineering
al prof. S. Kaliskiego 7, 85-789 Bydgoszcz, Poland [email protected], [email protected], [email protected]
Summary: The methodology in this article is focused on the development intelligent algorithms in the area of biomedical engineering, or more precisely, on the biomedical signal. The purpose of these activities is generally counteraction to occurring the problem of diagnosing cardiac diseases based on the ECG signal. This paper proposes various algorithms to detect the BPM, which can be used for diagnosis of cardiovascular abnormalities. These algorithms detects the R-peaks in signal ECG and on their basis computes the BPM. Proposed solutions allow to select three algorithms to determine R-peaks. As part of this method have been used function of threshold, the derivative signal, and the slider window.
Keywords: ECG analysis, algorithm, R-waves, BPM.
1. INTRODUCTION
The proper functioning of the human body requires efficient transmission of information, both between the organism and the environment, as well as inside the body. The flow of these messages is based in most cases on the transmissions of electrical impulses, which are the source of biomedical signals. Carriers transferred electrical impulses are ions, which are arranged along the cell membranes are the different structures, which is found in the human body. The flow of ions, causes membrane depolarization often been compared to the flow of electric current in a wire.
One of the many methods of recording the biomedical signals, which combines these relationships is electrocardiography. Electrocardiography recording the ECG signal, in the clinical aspect is a graphical record of changes potentials recorded from the surface of the chest, during depolarization and repolarization of cardiac muscle cells. However, in the technology aspect is a graphical notation for the electrical signals, generated during a heartbeat [4].
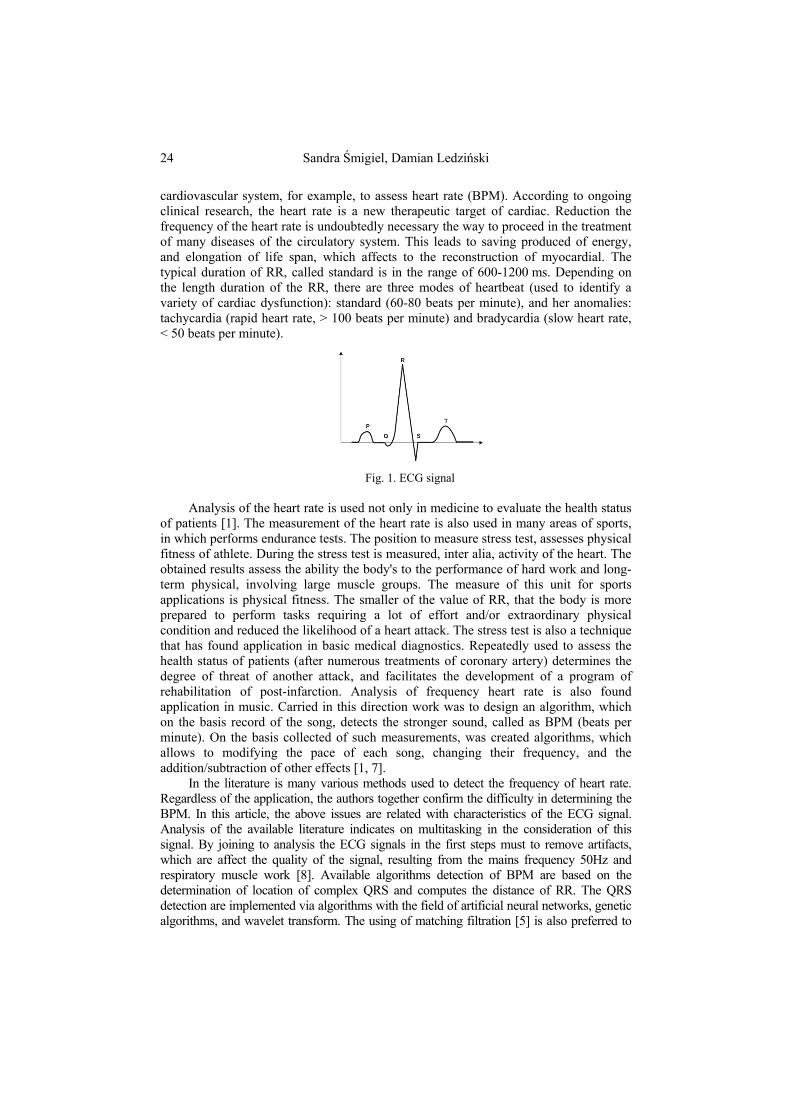
A typical ECG (fig. 1) waves allows to specify the location of the P-wave, QRS complex and T-wave and U-wave. Amplitude, frequency of their occurrence, and also the interval between each of peak are the parameters used to define a number of abnormalities of the heart, which significantly affect the state of our lives [3].
The most important from a medical point of view is the RR interval. The distance between two peaks of R, is a meaningful factor used to determine the abnormality in the
24 Sandra Śmigiel, Damian Ledziński
cardiovascular system, for example, to assess heart rate (BPM). According to ongoing clinical research, the heart rate is a new therapeutic target of cardiac. Reduction the frequency of the heart rate is undoubtedly necessary the way to proceed in the treatment of many diseases of the circulatory system. This leads to saving produced of energy, and elongation of life span, which affects to the reconstruction of myocardial. The typical duration of RR, called standard is in the range of 600-1200 ms. Depending on the length duration of the RR, there are three modes of heartbeat (used to identify a variety of cardiac dysfunction): standard (60-80 beats per minute), and her anomalies: tachycardia (rapid heart rate, > 100 beats per minute) and bradycardia (slow heart rate, < 50 beats per minute).
Fig. 1. ECG signal Analysis of the heart rate is used not only in medicine to evaluate the health status
of patients [1]. The measurement of the heart rate is also used in many areas of sports, in which performs endurance tests. The position to measure stress test, assesses physical fitness of athlete. During the stress test is measured, inter alia, activity of the heart. The obtained results assess the ability the body's to the performance of hard work and long-term physical, involving large muscle groups. The measure of this unit for sports applications is physical fitness. The smaller of the value of RR, that the body is more prepared to perform tasks requiring a lot of effort and/or extraordinary physical condition and reduced the likelihood of a heart attack. The stress test is also a technique that has found application in basic medical diagnostics. Repeatedly used to assess the health status of patients (after numerous treatments of coronary artery) determines the degree of threat of another attack, and facilitates the development of a program of rehabilitation of post-infarction. Analysis of frequency heart rate is also found application in music. Carried in this direction work was to design an algorithm, which on the basis record of the song, detects the stronger sound, called as BPM (beats per minute). On the basis collected of such measurements, was created algorithms, which allows to modifying the pace of each song, changing their frequency, and the addition/subtraction of other effects [1, 7].
In the literature is many various methods used to detect the frequency of heart rate. Regardless of the application, the authors together confirm the difficulty in determining the BPM. In this article, the above issues are related with characteristics of the ECG signal. Analysis of the available literature indicates on multitasking in the consideration of this signal. By joining to analysis the ECG signals in the first steps must to remove artifacts, which are affect the quality of the signal, resulting from the mains frequency 50Hz and respiratory muscle work [8]. Available algorithms detection of BPM are based on the determination of location of complex QRS and computes the distance of RR. The QRS detection are implemented via algorithms with the field of artificial neural networks, genetic algorithms, and wavelet transform. The using of matching filtration [5] is also preferred to
ECG signal analysis for detection BPM 25
analysis of special shapes of signal under impact of interferences. Most of the operations was performed based on the Matlab software. A disadvantage of prior methods, is their complicated performs and/or implementation, and the low efficiency (positive predictive accuracy of 88.08 %, 75.06 %) in relation to the variable characteristics of the recording of this signals, which results the various diseases [2, 6].
The aim of this article was to design various algorithms, which takes a sample of the ECG waves, and after that computes of BPM (Beats Per Minute). The methodology in this article basically describes two different processes, where the ECG waveforms are con-sidered. First is the filtering and normalization. Second is the calculation the heart rate (BPM).
2. PROPOSED METHODOLOGY
To evaluate the processing algorithms we used the MIT database, which allows to work with ECG's signals (format conversion, part selection, frequency conversion, etc.). All these signals and functions are accessible through the PhysioNet society, where all the available resources are publicly offered. One of this resources is PhysioBank. PhysioBank comprises around 26 different ECG databases. In this paper we used The PTB Diagnostic ECG Database.
The selection of databases was made according on their characteristics, and to the number of available registries and their duration. We used a total of 485 registries of 100ms for each of the selected pathologies. These pathologies consist: Myocardial infarction, Cardiomyopathy, Heart failure, Bundle branch block, Dysrhythmia, Myocardial hypertrophy, Valvular heart disease, Myocarditis, Miscellaneous, Healthy controls. These signals were digitized at 1000 samples per second per channel with 16-bit resolution.
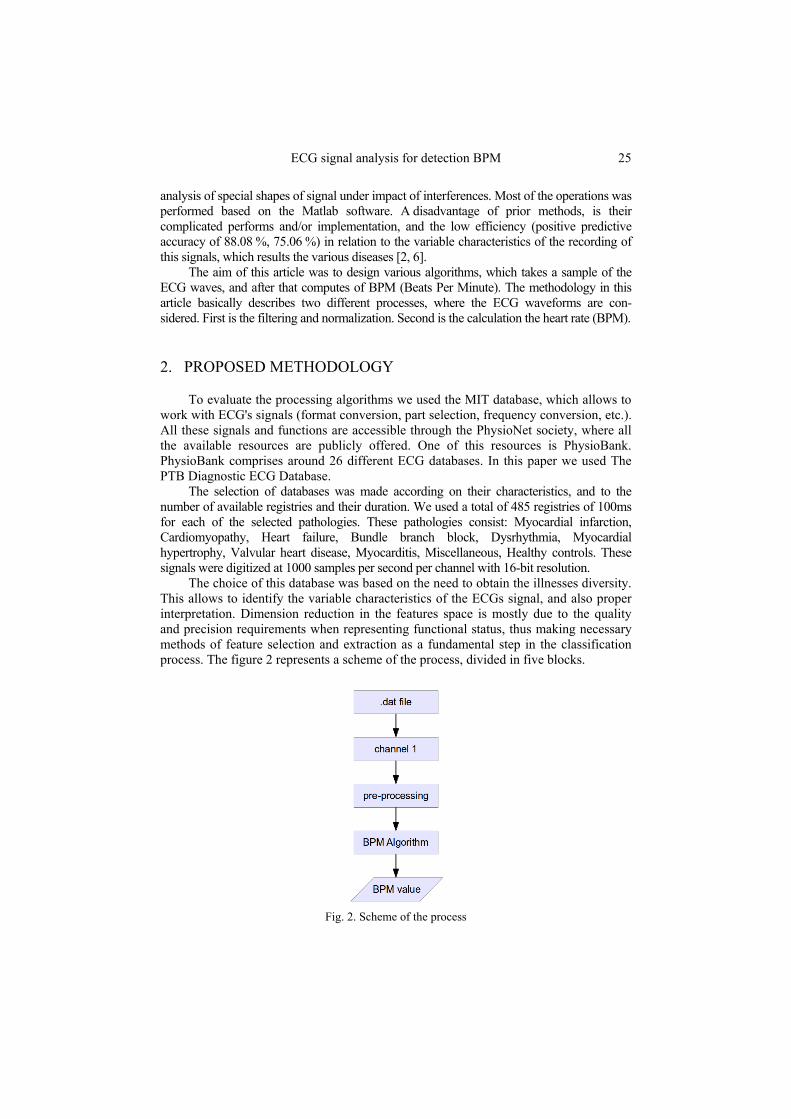
The choice of this database was based on the need to obtain the illnesses diversity. This allows to identify the variable characteristics of the ECGs signal, and also proper interpretation. Dimension reduction in the features space is mostly due to the quality and precision requirements when representing functional status, thus making necessary methods of feature selection and extraction as a fundamental step in the classification process. The figure 2 represents a scheme of the process, divided in five blocks.
Fig. 2. Scheme of the process
26 Sandra Śmigiel, Damian Ledziński
2.1. PRE-PROCESSING
The pre-processing consists in a set of operations on the magnitude of retrieved signals, and provides a numerical value to work within the following steps. The first steps is required for removal of noises such as breathing movements, the power supply network 50 Hz frequency [6], which usually is the main of the problem, etc. As part of these activities, the pre-processing stage involves normalization and filtering. It's realize to optimize in a set of values of ECG signals, containing the most representative data (dimension reduction) for the next task. These artefacts have to be removed before the signal is used for next data processing like heart rate frequency determination, which has been achieved in this work [7].
2.2. HEART RATE DETECTION ALGORITHMS
In this part there are described algorithms for heart rate detection which have been designed in Scilab, environment of Java, Python. These algorithms carry signs algorithms based on statistical and differential mathematical methods.
The first algorithms are detecting heart rate (BPM) as difference between R waves in ECG. These waves are filtrated at the first steps in pre-processing, for example by band pass filters. The wave’s peaks are detected by signal thresholding, and after that the algorithm counted the amount of detected R-peaks.
The second and third algorithm is modification the algorithm of the Simple BPM Algorithm. In the algorithm of the Simple BPM Algorithm all the values are determined separately for each sample, in the field [i – t, i + t]. After that, the algorithm proceed as before. First determines the signal threshold, later computes parts of the waves (R-peaks), and Calculation of the BPM. In the algorithm of the Diff BMP Algorithm are analyzes the derivatives of the ECG waves. Calculation of the BPM, is the same, as in the case of the first algorithm.
2.2.1. Simple BPM algorithm
The first algorithm computes heart rate frequency using the signal thresholding. The threshold is computed according the equation (1). The threshold is used for finding the signal parts, where are R-peaks. The first step of algorithm determines the maximum value (called max) and the arithmetical mean value (called avg) of all the samples. On this basis, the algorithm determines the ratio of maximum value to the average value, which in the context of the present work is 0.4-0.9. After that, the algorithm computes the number of detected R-peaks, which are above defined threshold value.
ℎ = − ∗ + (1) where:
Thr – threshold; r – relation factor.
The BPM is computed according the equation (2):
= ∗ (2)
where: n – R-peaks, which are above defined threshold value; t – time signal in seconds.
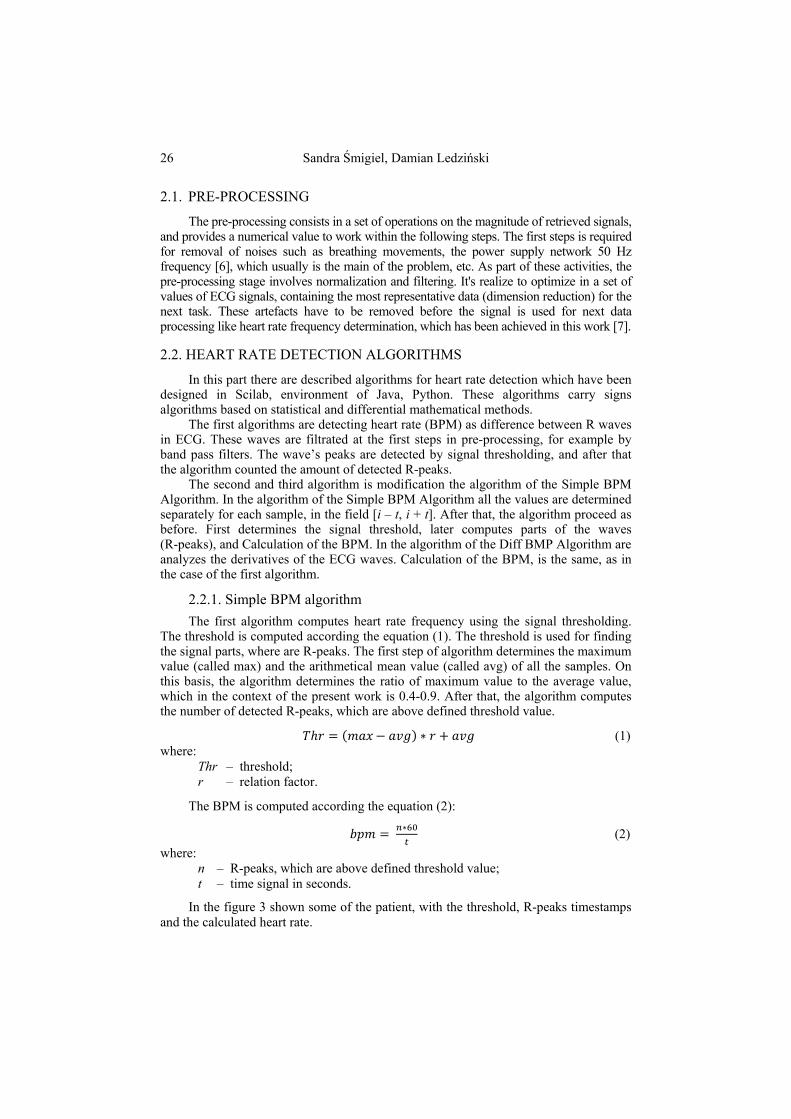
In the figure 3 shown some of the patient, with the threshold, R-peaks timestamps and the calculated heart rate.
ECG signal analysis for detection BPM 27
Fig. 3. The Simple BPM Algorithm
2.2.2. Slider window BPM algorithm
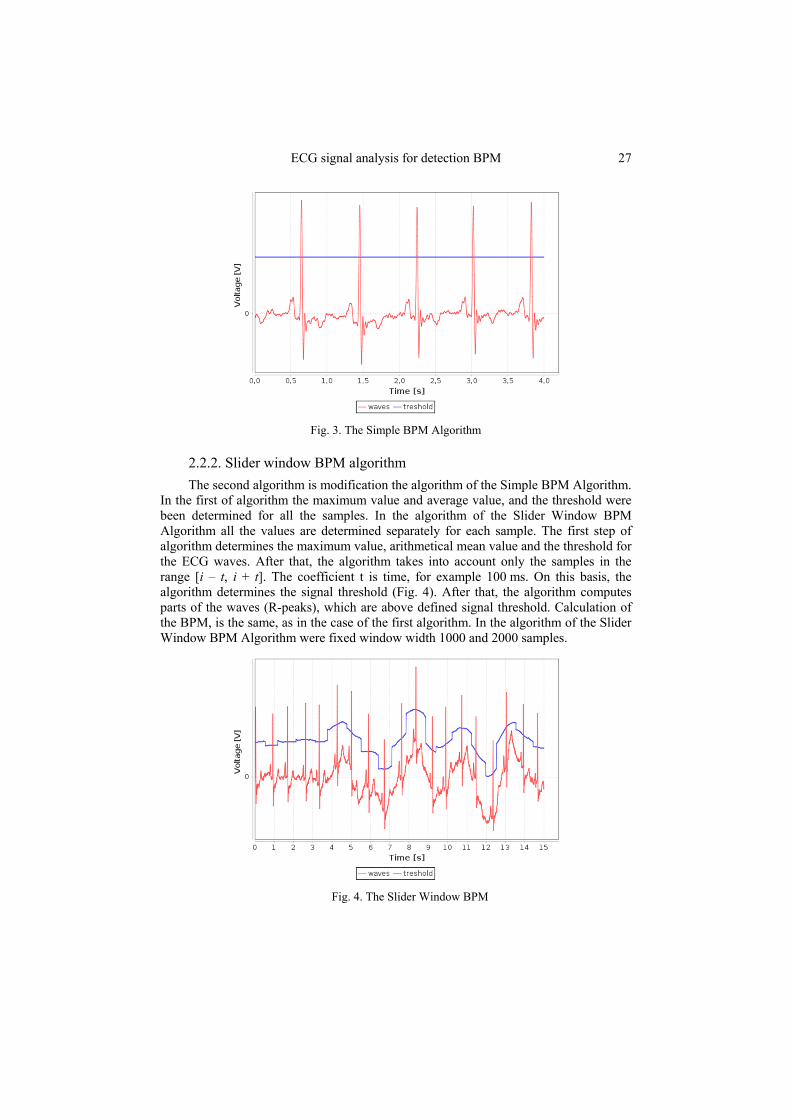
The second algorithm is modification the algorithm of the Simple BPM Algorithm. In the first of algorithm the maximum value and average value, and the threshold were been determined for all the samples. In the algorithm of the Slider Window BPM Algorithm all the values are determined separately for each sample. The first step of algorithm determines the maximum value, arithmetical mean value and the threshold for the ECG waves. After that, the algorithm takes into account only the samples in the range [i – t, i + t]. The coefficient t is time, for example 100 ms. On this basis, the algorithm determines the signal threshold (Fig. 4). After that, the algorithm computes parts of the waves (R-peaks), which are above defined signal threshold. Calculation of the BPM, is the same, as in the case of the first algorithm. In the algorithm of the Slider Window BPM Algorithm were fixed window width 1000 and 2000 samples.
Fig. 4. The Slider Window BPM
28 Sandra Śmigiel, Damian Ledziński
2.2.3. Diff BPM algorithm
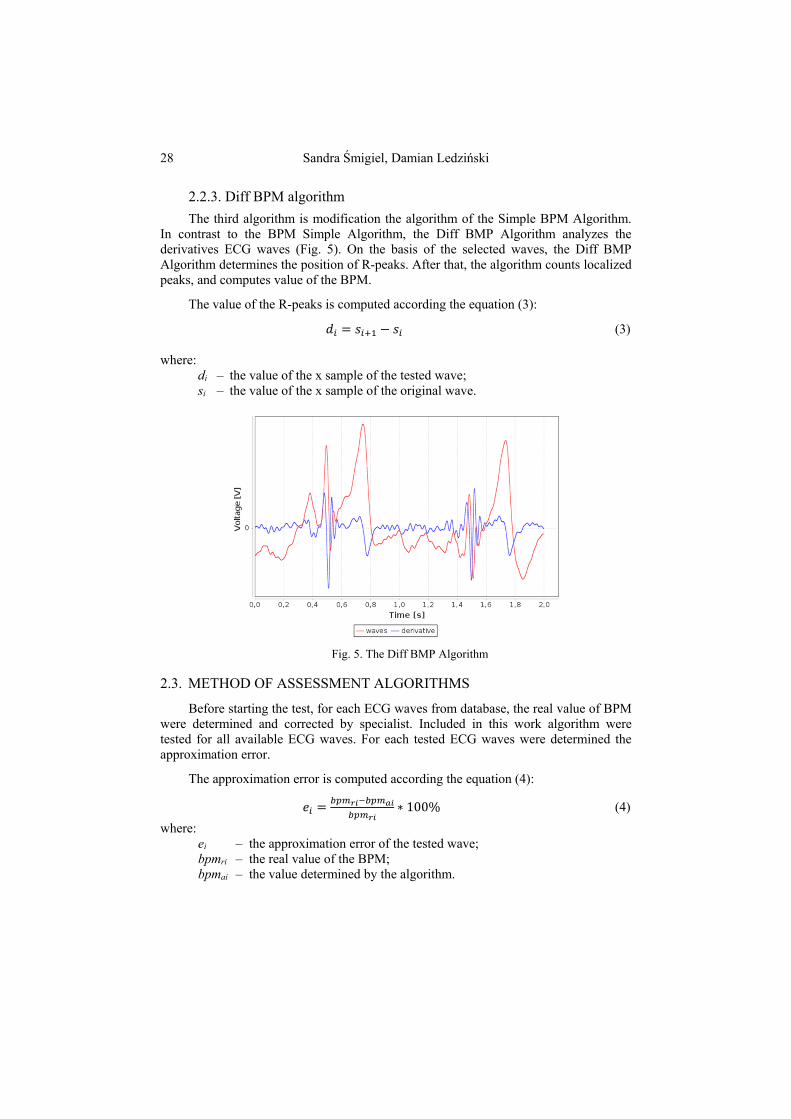
The third algorithm is modification the algorithm of the Simple BPM Algorithm. In contrast to the BPM Simple Algorithm, the Diff BMP Algorithm analyzes the derivatives ECG waves (Fig. 5). On the basis of the selected waves, the Diff BMP Algorithm determines the position of R-peaks. After that, the algorithm counts localized peaks, and computes value of the BPM.
The value of the R-peaks is computed according the equation (3):
= − (3)
where: di – the value of the x sample of the tested wave; si – the value of the x sample of the original wave.
Fig. 5. The Diff BMP Algorithm
2.3. METHOD OF ASSESSMENT ALGORITHMS
Before starting the test, for each ECG waves from database, the real value of BPM were determined and corrected by specialist. Included in this work algorithm were tested for all available ECG waves. For each tested ECG waves were determined the approximation error.
The approximation error is computed according the equation (4): = ∗ 100% (4)
where: ei – the approximation error of the tested wave; bpmri – the real value of the BPM; bpmai – the value determined by the algorithm.
ECG signal analysis for detection BPM 29
Then, the algorithm calculated the average approximation error (5): = ∑ | |
(5)
where: n – number of tested waves; ei – the approximation error of the tested wave.
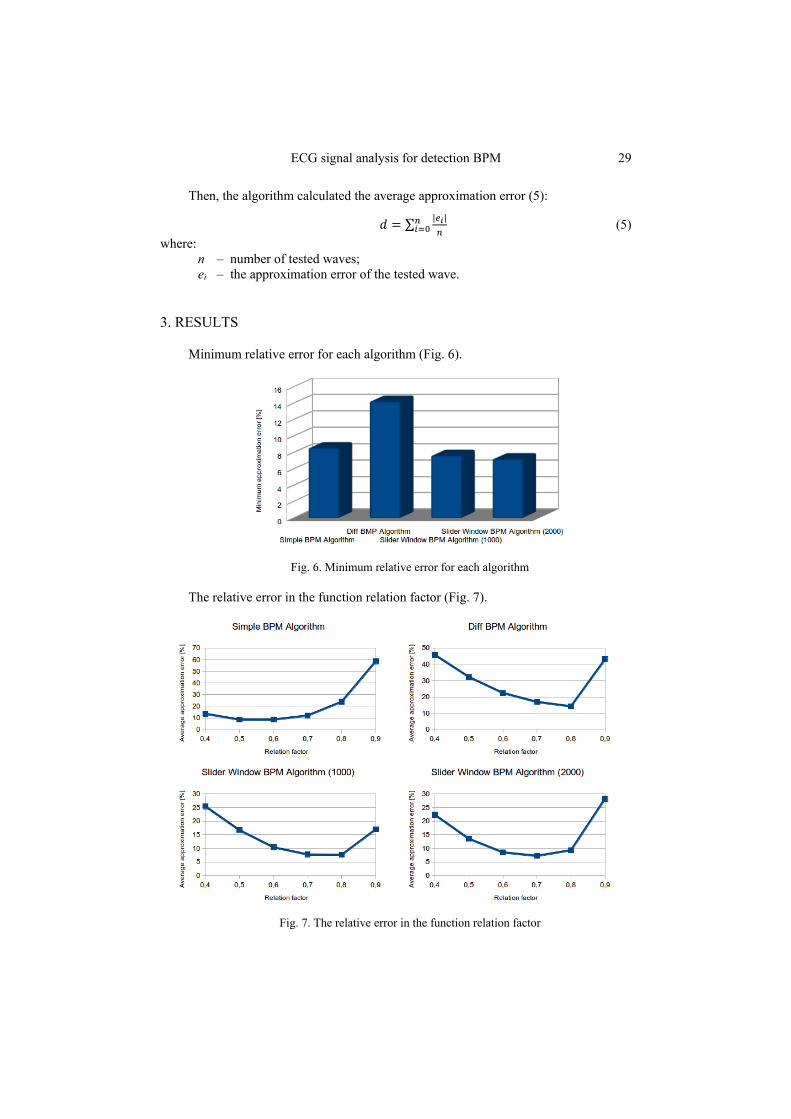
3. RESULTS
Minimum relative error for each algorithm (Fig. 6).
Fig. 6. Minimum relative error for each algorithm The relative error in the function relation factor (Fig. 7).
Fig. 7. The relative error in the function relation factor
30 Sandra Śmigiel, Damian Ledziński
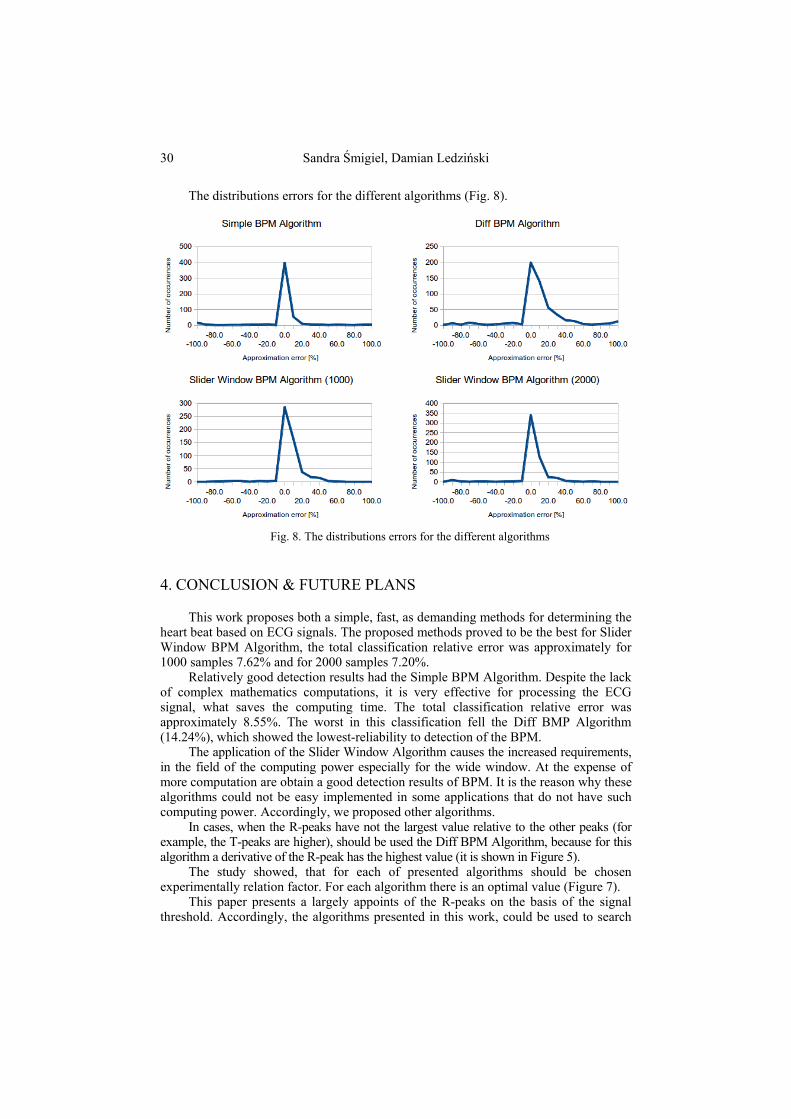
The distributions errors for the different algorithms (Fig. 8).
Fig. 8. The distributions errors for the different algorithms
4. CONCLUSION & FUTURE PLANS
This work proposes both a simple, fast, as demanding methods for determining the heart beat based on ECG signals. The proposed methods proved to be the best for Slider Window BPM Algorithm, the total classification relative error was approximately for 1000 samples 7.62% and for 2000 samples 7.20%.
Relatively good detection results had the Simple BPM Algorithm. Despite the lack of complex mathematics computations, it is very effective for processing the ECG signal, what saves the computing time. The total classification relative error was approximately 8.55%. The worst in this classification fell the Diff BMP Algorithm (14.24%), which showed the lowest-reliability to detection of the BPM.
The application of the Slider Window Algorithm causes the increased requirements, in the field of the computing power especially for the wide window. At the expense of more computation are obtain a good detection results of BPM. It is the reason why these algorithms could not be easy implemented in some applications that do not have such computing power. Accordingly, we proposed other algorithms.
In cases, when the R-peaks have not the largest value relative to the other peaks (for example, the T-peaks are higher), should be used the Diff BPM Algorithm, because for this algorithm a derivative of the R-peak has the highest value (it is shown in Figure 5).
The study showed, that for each of presented algorithms should be chosen experimentally relation factor. For each algorithm there is an optimal value (Figure 7).
This paper presents a largely appoints of the R-peaks on the basis of the signal threshold. Accordingly, the algorithms presented in this work, could be used to search
ECG signal analysis for detection BPM 31
for R-peaks in ECG waves. For this purpose, for each section, which are above defined threshold value, should be appoint a maximum local.
The aim of further work will be apply the developed algorithms in cardiological diagnosis.
BIBLIOGRAPHY
[1] Hillbom S., Lindberg R., Lindberg E., 2014. Realtime BPM and Beat Detection using ADSP-21262 SHARC DSP, Algorithms in Signal Processors, ETIN80.
[2] Last T., Nugent Ch., Owens F.J., 2007. Evaluation of electrocardiogram beat detection algorithms: patient specific versus generic training, Proceedings of the 29th Annual International Conference of the IEEE EMBS.
[3] Pathoumvanh S., Hamamoto K., Indahak P., 2014. Arrhythmias Detection and Classification base on Single Beat ECG Analysis, The 4th Joint International Conference on Information and Communication Technology, Electronic and Electrical Engineering.
[4] Piotrowski Z., Różanowski K., 2010. Robust Algorithm for Heart Rate (HR) Detection and Heart Rate Variability (HRV) Estimation, Acoustic and Biomedical Engineering 118(1).
[5] Pogribny W., Marciniak T., 2002. Location signals on base of noise-like codes, Acta Acustica 88, pp. 678-681.
[6] Sahoo G.K., Ari S., Patra S.K., 2013. ECG signal analysis for detection of Heart Rate and Ischemic Episodes, International Journal of Advanced Computer Research (ISSN) 3(1).
[7] Suárez K.V., Silva J., C., Berthoumieu Y., Gomis P., Najim M., 2007. ECG Beat Detection Using a Geometrical Matching Approach, IEEE TRANSACTIONS ON BIOMEDICAL ENGINEERING 54(4).
[8] Yeh Y.-Ch., Chiang T.-Ch., Lin H.-J., 2011. Principal Component Analysis Method for Detection and Classification of ECG Beat, IEEE International Conference on Bioinformatics and Bioengineering.
WYKRYWANIE HR NA PODSTAWIE SYGNAŁU EKG
Streszczenie
Przedstawiona w pracy metodologia badawcza koncentruje się na rozwoju
inteligentnych algorytmów w obszarze inżynierii biomedycznej, a ściślej w zakresie przetwarzania sygnałów biomedycznych. Celem realizowanych w pracy algorytmów jest ogólnie występujący problem diagnozowania chorób serca, w oparciu o zapis EKG. Niniejszy dokument prezentuje różnego rodzaju algorytmy wykrywające wartości HR, świadczące o częstotliwości pracy serca, które mogą stanowić oparcie dla lekarzy w diagnozowaniu zaburzeń sercowo-naczyniowych. Analizowane algorytmy wykrywają załamki R z zapisu EKG, aby w dalszym etapie obliczyć HR. Proponowane przez autorów rozwiązania umożliwiają wybór jednej z trzech omówionych metod. W każdej z nich został zastosowany inny algorytm wyznaczania załamków R. Wprowadzono m.in. funkcję progu, wyznaczanie pochodnej sygnału oraz okno przesuwne.
Słowa kluczowe: EKG, algorytm, załamek R, HR.

UNIWERSYTET TECHNOLOGICZNO-PRZYRODNICZY IM. JANA I JĘDRZEJA ŚNIADECKICH W BYDGOSZCZY
ZESZYTY NAUKOWE NR 263 TELEKOMUNIKACJA I ELEKTRONIKA 18 (2014) 33-45
TASK SCHEDULING ALGORITHMS FOR MULTI ROBOT ENVIRONMENT
Sandra Śmigiel1, Fatih Zungor2, Hunkar Purtul3, Inanc Inaloz4
1 University of Technology and Life Sciences, Faculty of Telecommunications, Computer Science and Electrical Engineering,
al. prof. S. Kaliskiego 7, 85-789 Bydgoszcz, Poland a [email protected]
2 Sakarya University 3 Karadeniz Technical University
4 Mustafa Kemal University Summary: In recent years, the problem of multi robot task allocation and scheduling is the subject of many research activities. The key of this problem is to allocate proper number of tasks for each robot and schedule the optimal task sequence for each robot. In order to minimize the processing time for robots, were designed algorithms of the sample task scheduling. Determination of the optimal path for robots, taking into account the process of task scheduling, may be an effective strategy to manage and control of tasks in a environment. This paper presents the management and control works of robots in the logistics environment (warehouse), which will be realized by the soft real time systems. The aim of the authors was to develop and compare the optimal algorithms management works systems of multi-robot in warehouse, in terms of number of customer served and consumption energy. To validate the effectiveness of the proposed approach and simulation have been made. The results show that the proposed approach can be an effective approach in the design of optimized multi robots task allocation and scheduling scheme, especially for the Queued Task Algorithm, with 1-element queueCapacity and Nearest Task Algorithm.
Keywords: task scheduling, robot control algorithm, multi-agent system, warehouse.
1. INTRODUCTION
The problems of task scheduling and allocation of resources is accompanied almost every creative of human activity. They are a significant element of the decision-making processes of many issues [1]. These include systems: control and planning of production, supply management and marketing, organization of transport, management of resources, etc. The problem of task scheduling and resource allocation, is one of the basic issues attracted many researchers affection, relating to the field of distributed robot systems. Distributed robot system combines the intelligent planning and control, which consider event-based motion planning and control [3, 5].
34 Sandra Śmigiel, Fatih Zungor, Hunkar Purtul, Inanc Inaloz
Real time systems are those in which the logical correctness or correctly performed calculations are equally important as to keep up with the issues taking place in the surrounding real world. The real-time systems are characterized by the concurrency and conditions of timing. The existence of concurrency is related to the necessity of readiness to handle a multiple, concurrent appearing in any of the time points issues [4]. There are three types of the real time systems: Hard Real Time system, Soft Real Time System and Firm Real Time System. In hard real-time systems, the importance of meeting a task execution deadline is a central issue for correctness and reliability of such systems. In hard real-time systems, the importance of meeting a task execution deadline is a central issue for correctness and reliability of such systems. In this systems missing of task is absolute deadline leads to the catastrophic situation. Whereas in soft real time systems is sporadic acceptable to timeout of issues, so the deadline is tolerable and the system continues to operate. In addition to the hard and soft real time system, is acceptable the existence of firm real-time systems, where the individual requirements of real-time, can have a hard and soft character. In the case of real-time systems desired effect is their continuous operation, since their launch to the removal phase [4].
In recent years, many papers focus on issues related to the control of robots and managing, which affects of many areas. One of these ways is the automation of storage processes [3], in which tested the environment, where the robots transported the tasks in the virtual storage. In this article, has been prepared the task scheduling and allocation of resources in management planning of warehouse, which was based on soft real time systems. Considering the problem of scheduling in soft real time systems, use planning via robots, is must to use two fundamental concepts: task and resources. The task consists of performance the sequence of operations, in which each requires the involvement of specific resources. Analysis of the soft real time systems must to remember that, despite their characteristics, must be limited of delinquency. Order a given task cannot wait for performed. Characteristics of soft real time systems can make to creation of artificial reality, which will be presented in this article [2, 6].
The main purpose of the authors was to develop and compare the path planning of robots and the task scheduling algorithms for robots used for transport in virtual magazines.
2. ENVIRONMENT DESCRIPTION
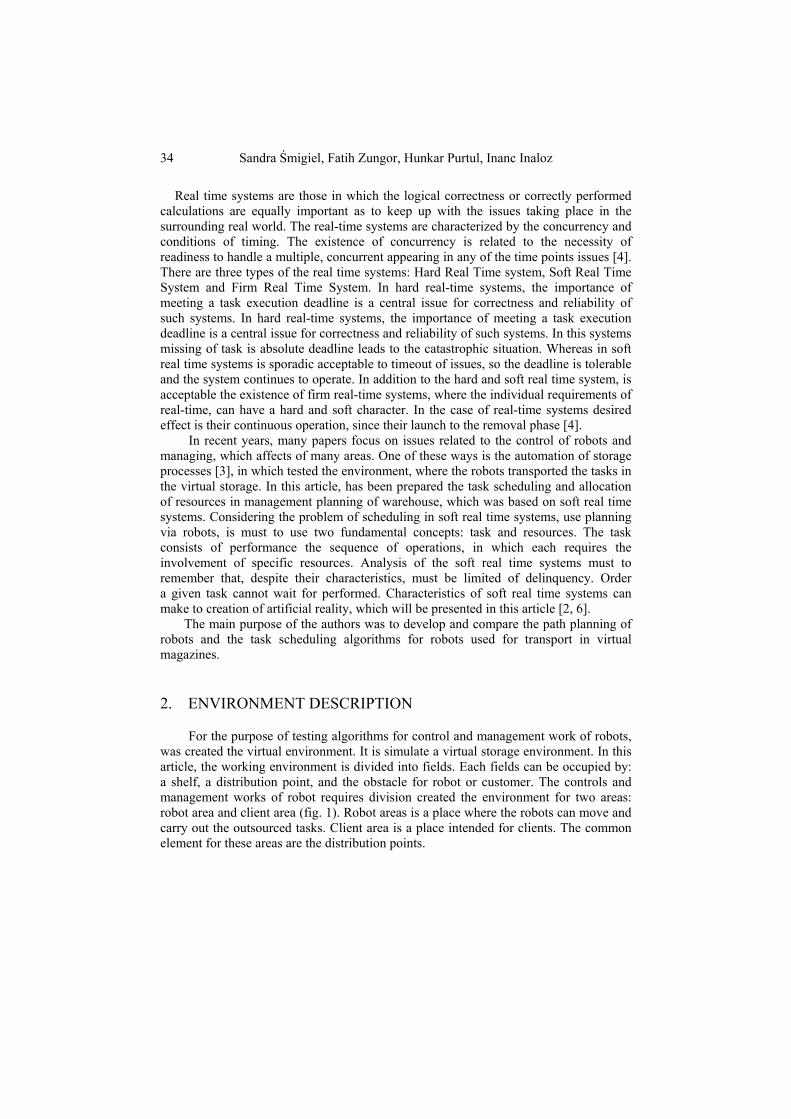
For the purpose of testing algorithms for control and management work of robots, was created the virtual environment. It is simulate a virtual storage environment. In this article, the working environment is divided into fields. Each fields can be occupied by: a shelf, a distribution point, and the obstacle for robot or customer. The controls and management works of robot requires division created the environment for two areas: robot area and client area (fig. 1). Robot areas is a place where the robots can move and carry out the outsourced tasks. Client area is a place intended for clients. The common element for these areas are the distribution points.
Task scheduling algorithms for multi robot environment 35
Fig. 1. Environment
The tasks in a virtual storage environment, for control and management of work robots, involve multiple segments of actions. All segments are logically connected or dependent upon each other logically and temporally. Designing such systems involves two issues: determining the sequence of actions and planning the actions them-self. Both the forward issues: task scheduling and action planning, requires a combination and co-operation two areas: robots and clients. Therefore, the problem of designing a robotic system requires the creation of a some level problem.
In created the environment the customers comes to warehouse, to download and/ or put one or more resources. The customer, when enter to warehouse, shall be referred to the distribution point, where delay the resources, if the customer has another task to delay, and later ordered the resources, which would like to download. If the customer will be served, then he could leave the storage. The basis for proper operation warehouse is the suitable number of customers, located in the warehouse in relation to the number of available distribution points. Each of resources has particular location in warehouse. The task of the robots is to transport the resources between the distribution point and the shelves. One robot at one time can transport a maximum of one resources
The submitted environment is divided into steps. At each step, both the robot and the client can: move forward one square, to make a 90 degree turn, to get/ put a resource to/ from a distribution point or to/ from shelf, in the case robots or wait. In addition, the customer, on single field, at one time, can place an order for the necessary resources, and also input/ output the warehouse (provided that stands on the appropriate field). In the case of robots, any activity via waiting, at one time during one step consumes a unit of energy.
The aim of authors was to present some of algorithms, for control and management of robots, in virtual warehouse. Each of algorithms was assigned to another robots. The operation of algorithms for each robots was divided into smaller groups: Main Algorithm, Routing Algorithm and Task Choosing Algorithm. The principle of the algorithms is follows: performed the single-step by the robot, cause that the simulator queries algorithm for a decision. The algorithm returns the decision and when it is possible, performs the action. In addition, for all instances of algorithms,
36 Sandra Śmigiel, Fatih Zungor, Hunkar Purtul, Inanc Inaloz
there is one central Agent Coordinator. Agent Coordinator has full knowledge about the environment. Function of Agent Coordinator is mainly control and manage of tasks. The task is called a transport the specified resource from point A to B, that is, from the distribution point on the shelf or vice versa. Each of order or a delivery of a specific resource by a client generates a task, which then placed on the list of tasks to be performed. Placed on the list of tasks can be reserved by the robot control algorithms. There is no limit to the amount of task reserved for one algorithm, at one time. Reservations causes to moves the task from the list of tasks to perform to the list of reserved task. Detection of the Agent Coordinator performed tasks (when the resource will be delivered to the destination), what causes that the tasks are moved from the list of tasks reserved to the list of tasks performed.
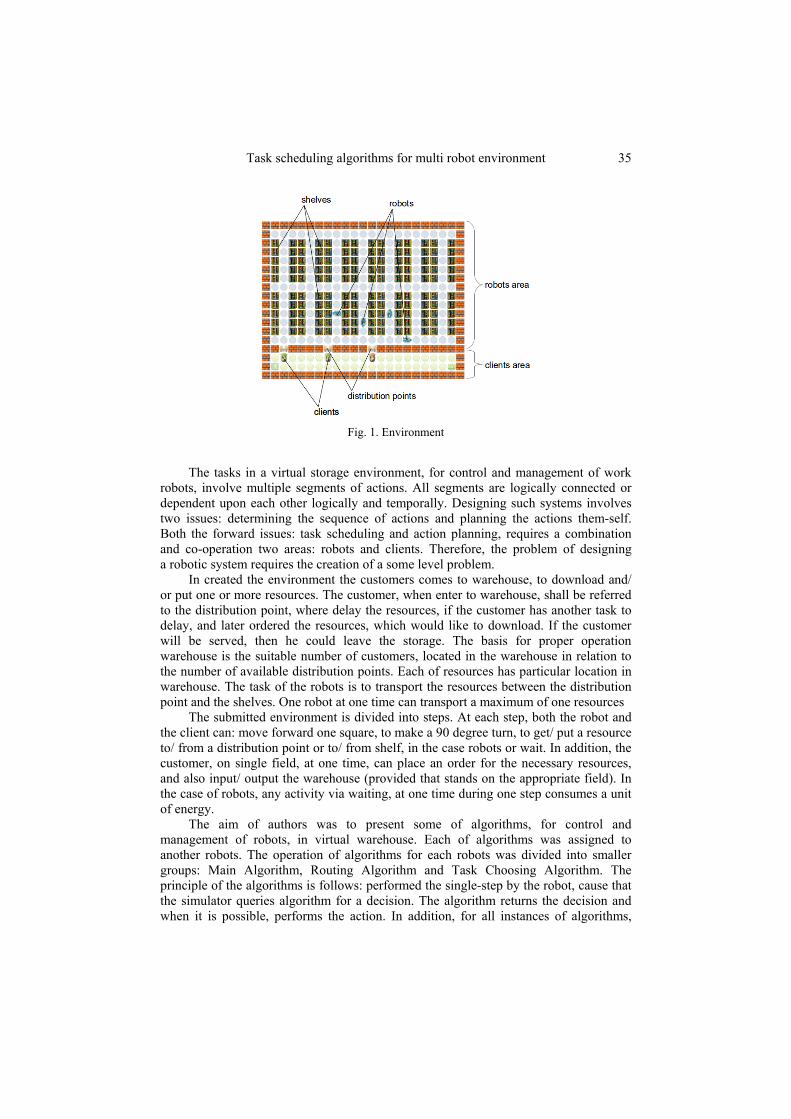
In this article, conducted tests were performed for 2 sizes environment (Fig. 2): medium (2 rows of 7 columns of shelves) and large (3 rows of 10 columns of shelves). Each of test took 10,000 steps. In addition, for each study was set the maximum time customer service.
Fig. 2. a) medium size environment, b) large size environment 2.1. MAIN ALGORITHM
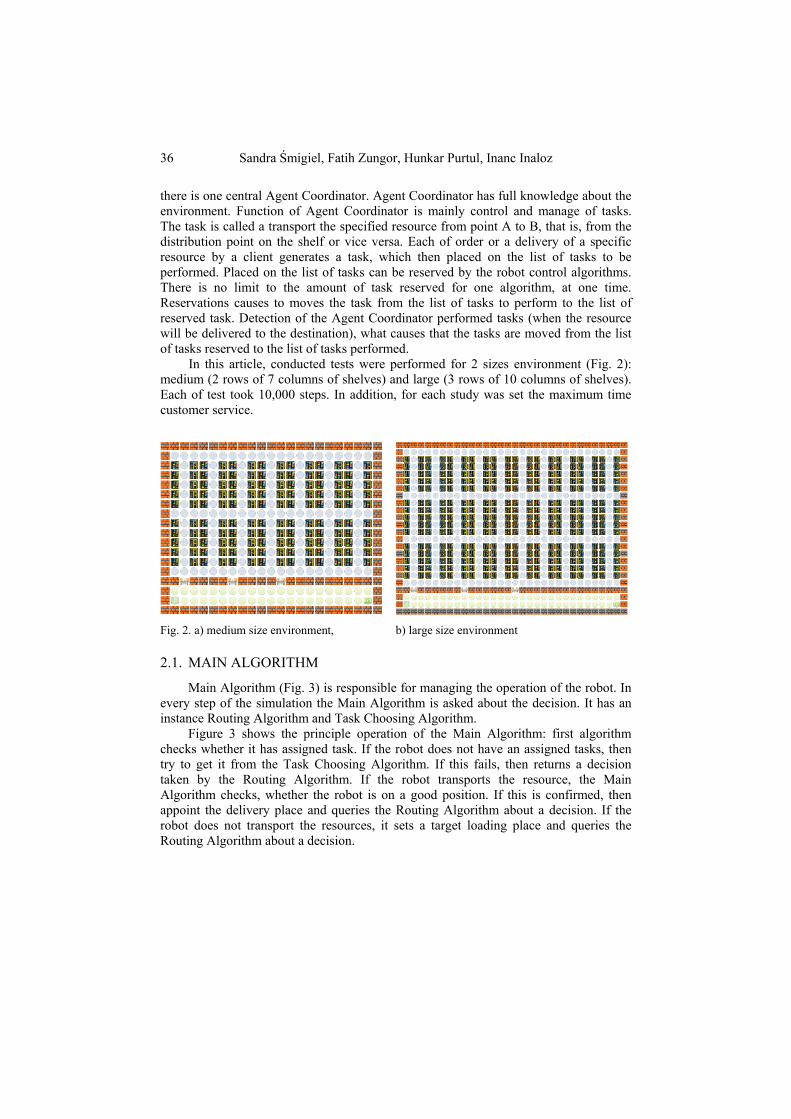
Main Algorithm (Fig. 3) is responsible for managing the operation of the robot. In every step of the simulation the Main Algorithm is asked about the decision. It has an instance Routing Algorithm and Task Choosing Algorithm.
Figure 3 shows the principle operation of the Main Algorithm: first algorithm checks whether it has assigned task. If the robot does not have an assigned tasks, then try to get it from the Task Choosing Algorithm. If this fails, then returns a decision taken by the Routing Algorithm. If the robot transports the resource, the Main Algorithm checks, whether the robot is on a good position. If this is confirmed, then appoint the delivery place and queries the Routing Algorithm about a decision. If the robot does not transport the resources, it sets a target loading place and queries the Routing Algorithm about a decision.
Task scheduling algorithms for multi robot environment 37
Fig. 3. Main Algorithm
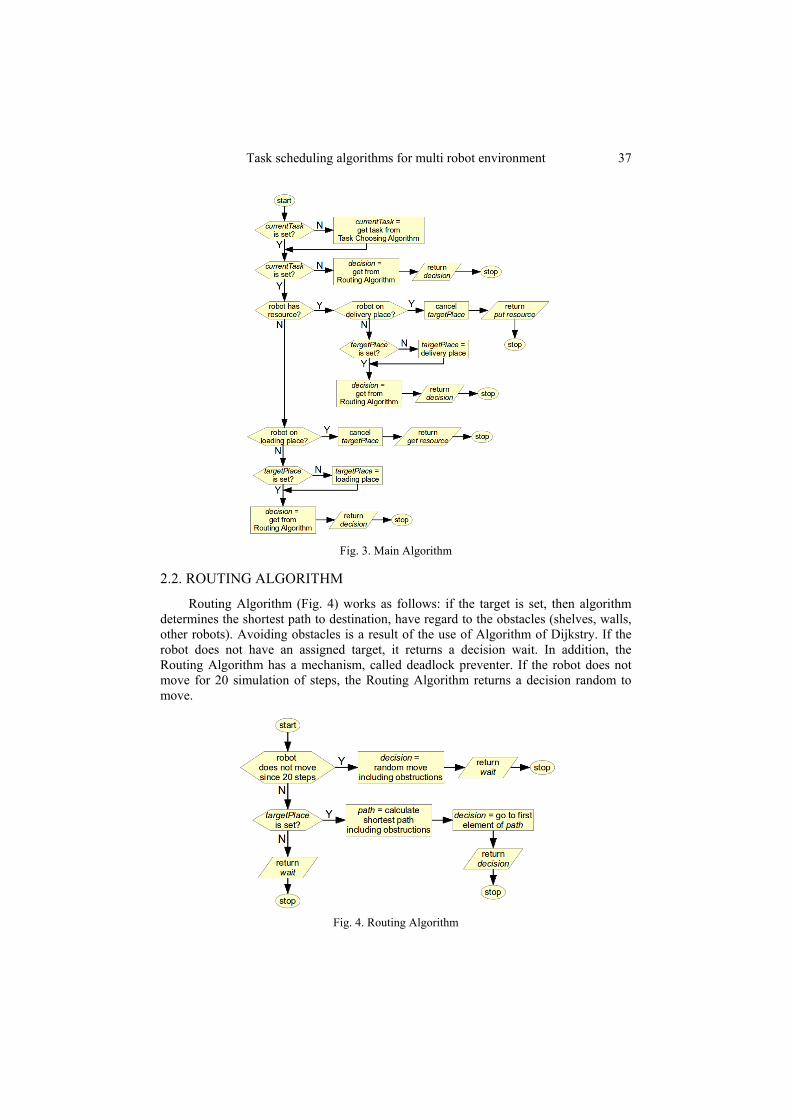
2.2. ROUTING ALGORITHM
Routing Algorithm (Fig. 4) works as follows: if the target is set, then algorithm determines the shortest path to destination, have regard to the obstacles (shelves, walls, other robots). Avoiding obstacles is a result of the use of Algorithm of Dijkstry. If the robot does not have an assigned target, it returns a decision wait. In addition, the Routing Algorithm has a mechanism, called deadlock preventer. If the robot does not move for 20 simulation of steps, the Routing Algorithm returns a decision random to move.
Fig. 4. Routing Algorithm
38 Sandra Śmigiel, Fatih Zungor, Hunkar Purtul, Inanc Inaloz
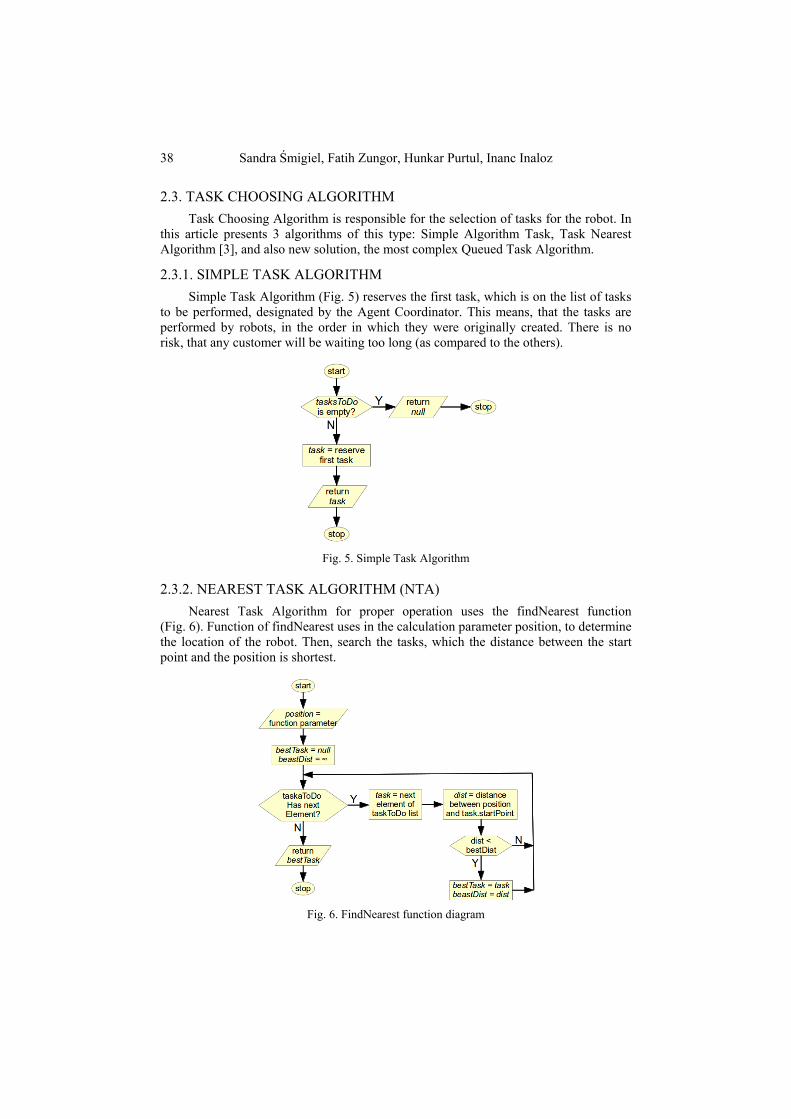
2.3. TASK CHOOSING ALGORITHM
Task Choosing Algorithm is responsible for the selection of tasks for the robot. In this article presents 3 algorithms of this type: Simple Algorithm Task, Task Nearest Algorithm [3], and also new solution, the most complex Queued Task Algorithm.
2.3.1. SIMPLE TASK ALGORITHM
Simple Task Algorithm (Fig. 5) reserves the first task, which is on the list of tasks to be performed, designated by the Agent Coordinator. This means, that the tasks are performed by robots, in the order in which they were originally created. There is no risk, that any customer will be waiting too long (as compared to the others).
Fig. 5. Simple Task Algorithm
2.3.2. NEAREST TASK ALGORITHM (NTA)
Nearest Task Algorithm for proper operation uses the findNearest function (Fig. 6). Function of findNearest uses in the calculation parameter position, to determine the location of the robot. Then, search the tasks, which the distance between the start point and the position is shortest.
Fig. 6. FindNearest function diagram
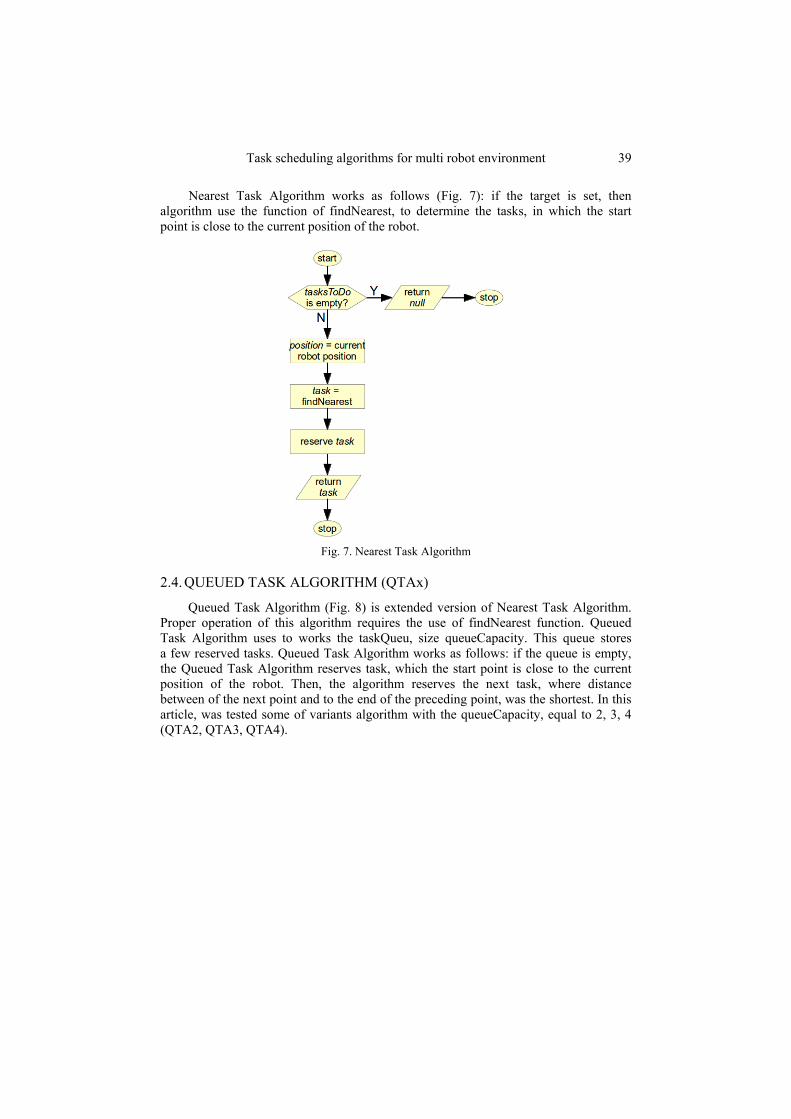
Task scheduling algorithms for multi robot environment 39
Nearest Task Algorithm works as follows (Fig. 7): if the target is set, then algorithm use the function of findNearest, to determine the tasks, in which the start point is close to the current position of the robot.
Fig. 7. Nearest Task Algorithm
2.4. QUEUED TASK ALGORITHM (QTAx)
Queued Task Algorithm (Fig. 8) is extended version of Nearest Task Algorithm. Proper operation of this algorithm requires the use of findNearest function. Queued Task Algorithm uses to works the taskQueu, size queueCapacity. This queue stores a few reserved tasks. Queued Task Algorithm works as follows: if the queue is empty, the Queued Task Algorithm reserves task, which the start point is close to the current position of the robot. Then, the algorithm reserves the next task, where distance between of the next point and to the end of the preceding point, was the shortest. In this article, was tested some of variants algorithm with the queueCapacity, equal to 2, 3, 4 (QTA2, QTA3, QTA4).
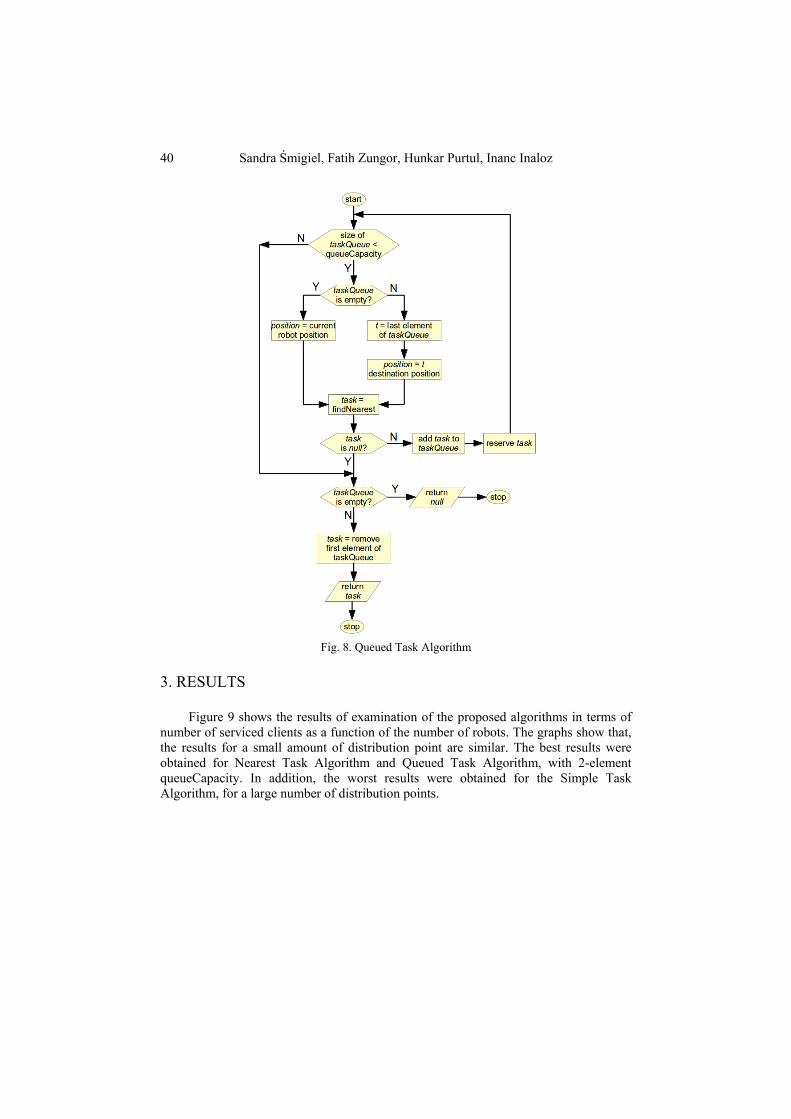
40 Sandra Śmigiel, Fatih Zungor, Hunkar Purtul, Inanc Inaloz
Fig. 8. Queued Task Algorithm
3. RESULTS
Figure 9 shows the results of examination of the proposed algorithms in terms of number of serviced clients as a function of the number of robots. The graphs show that, the results for a small amount of distribution point are similar. The best results were obtained for Nearest Task Algorithm and Queued Task Algorithm, with 2-element queueCapacity. In addition, the worst results were obtained for the Simple Task Algorithm, for a large number of distribution points.
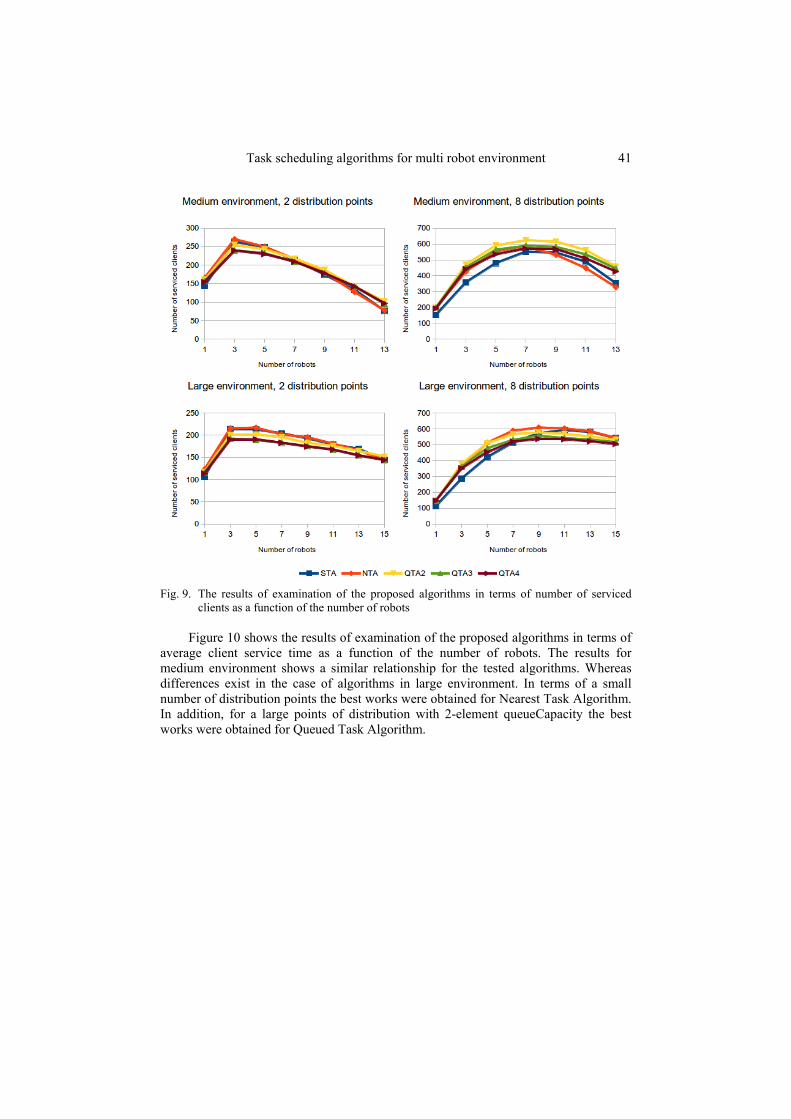
Task scheduling algorithms for multi robot environment 41
Fig. 9. The results of examination of the proposed algorithms in terms of number of serviced
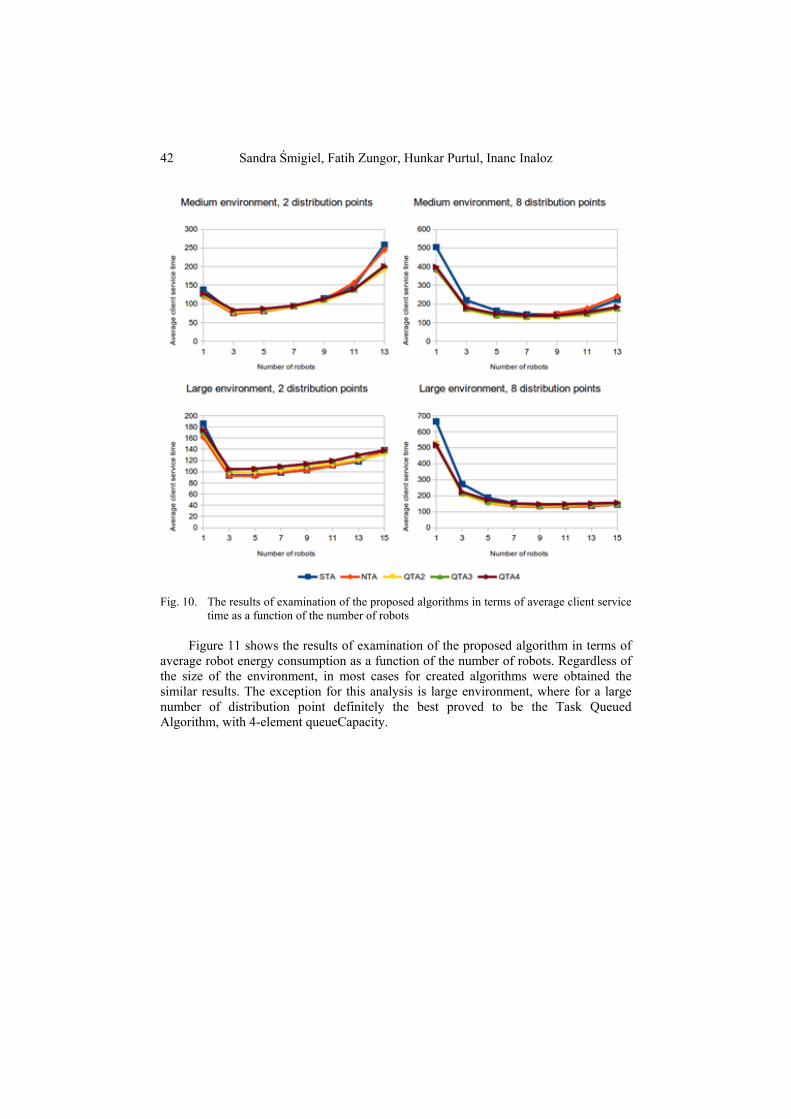
clients as a function of the number of robots Figure 10 shows the results of examination of the proposed algorithms in terms of
average client service time as a function of the number of robots. The results for medium environment shows a similar relationship for the tested algorithms. Whereas differences exist in the case of algorithms in large environment. In terms of a small number of distribution points the best works were obtained for Nearest Task Algorithm. In addition, for a large points of distribution with 2-element queueCapacity the best works were obtained for Queued Task Algorithm.
42 Sandra Śmigiel, Fatih Zungor, Hunkar Purtul, Inanc Inaloz
Fig. 10. The results of examination of the proposed algorithms in terms of average client service
time as a function of the number of robots
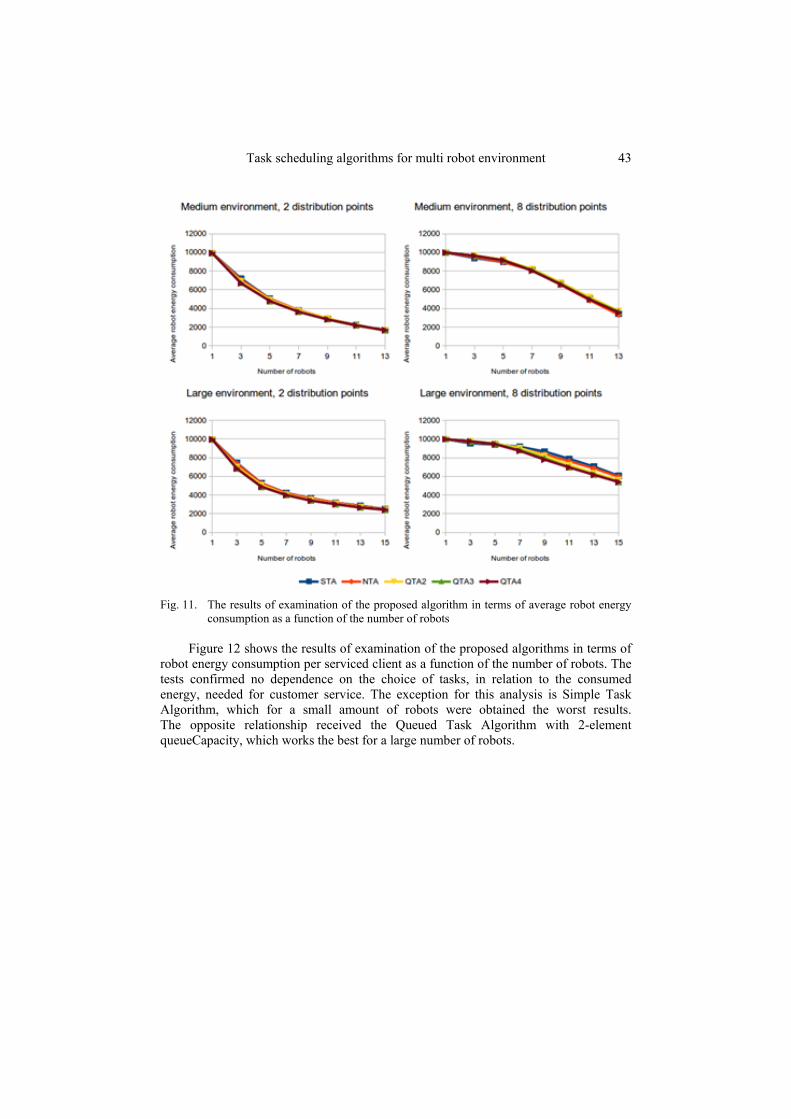
Figure 11 shows the results of examination of the proposed algorithm in terms of average robot energy consumption as a function of the number of robots. Regardless of the size of the environment, in most cases for created algorithms were obtained the similar results. The exception for this analysis is large environment, where for a large number of distribution point definitely the best proved to be the Task Queued Algorithm, with 4-element queueCapacity.
Task scheduling algorithms for multi robot environment 43
Fig. 11. The results of examination of the proposed algorithm in terms of average robot energy
consumption as a function of the number of robots
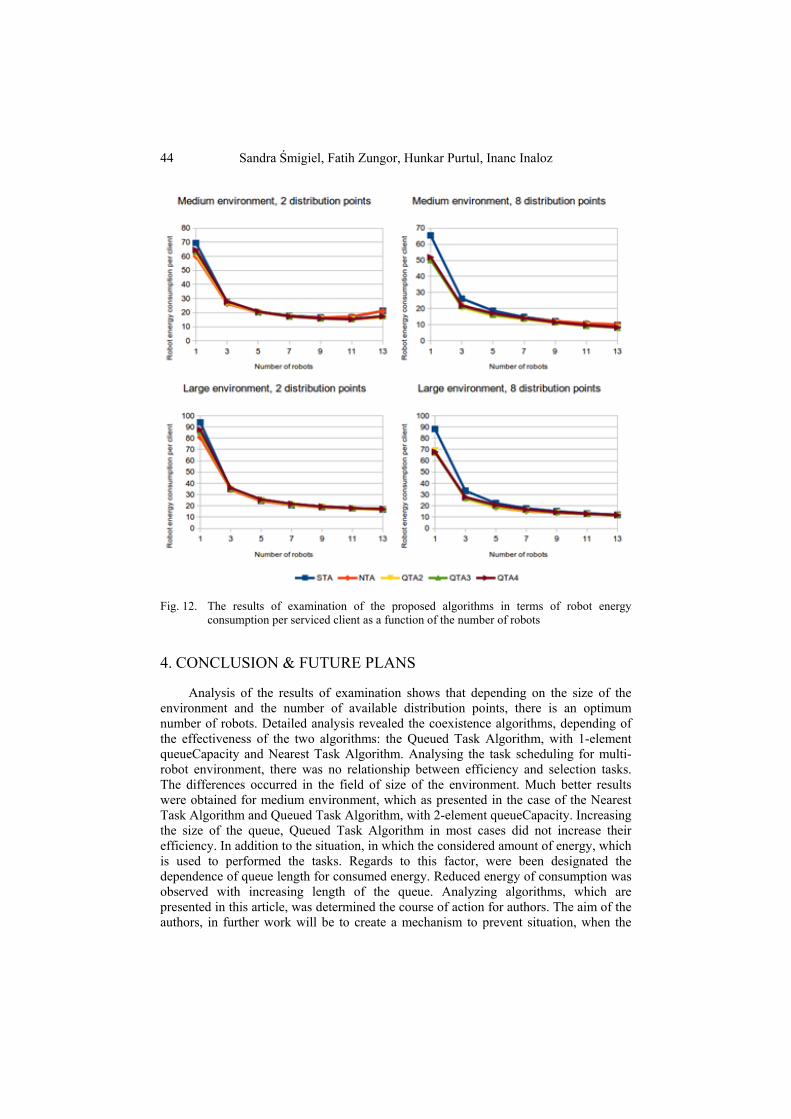
Figure 12 shows the results of examination of the proposed algorithms in terms of robot energy consumption per serviced client as a function of the number of robots. The tests confirmed no dependence on the choice of tasks, in relation to the consumed energy, needed for customer service. The exception for this analysis is Simple Task Algorithm, which for a small amount of robots were obtained the worst results. The opposite relationship received the Queued Task Algorithm with 2-element queueCapacity, which works the best for a large number of robots.
44 Sandra Śmigiel, Fatih Zungor, Hunkar Purtul, Inanc Inaloz
Fig. 12. The results of examination of the proposed algorithms in terms of robot energy consumption per serviced client as a function of the number of robots
4. CONCLUSION & FUTURE PLANS
Analysis of the results of examination shows that depending on the size of the environment and the number of available distribution points, there is an optimum number of robots. Detailed analysis revealed the coexistence algorithms, depending of the effectiveness of the two algorithms: the Queued Task Algorithm, with 1-element queueCapacity and Nearest Task Algorithm. Analysing the task scheduling for multi-robot environment, there was no relationship between efficiency and selection tasks. The differences occurred in the field of size of the environment. Much better results were obtained for medium environment, which as presented in the case of the Nearest Task Algorithm and Queued Task Algorithm, with 2-element queueCapacity. Increasing the size of the queue, Queued Task Algorithm in most cases did not increase their efficiency. In addition to the situation, in which the considered amount of energy, which is used to performed the tasks. Regards to this factor, were been designated the dependence of queue length for consumed energy. Reduced energy of consumption was observed with increasing length of the queue. Analyzing algorithms, which are presented in this article, was determined the course of action for authors. The aim of the authors, in further work will be to create a mechanism to prevent situation, when the
Task scheduling algorithms for multi robot environment 45
customer must wait for service (receive a task). In this paper, this situation was not presented, but be aware that it can occur, for example when the start of point the tasks will be very remote. The next steps, should be tested the algorithms in terms of the distribution times of customer service.
BIBLIOGRAPHY [1] He H., Shi L., 2010. The Application and Research of System Structure for Mobile
Robot Path Planning Based on Multi-Agent, International Conference On Computer Design And Applications (ICCDA 2010), pp. 523-526.
[2] Hu X., 2008. Clonal Selection based Mobile Robot Path Planning, Proceeding of the IEEE, International Conference on Automation and Logistics, pp. 437-442.
[3] Ledziński D., Marciniak T., Maszewski M., Boroński D., 2015. Robot Actions Planning Algorithms in Multi-Agent System, Solid State Phenomena 2015, vol. 223, pp. 221-230.
[4] Kumar P., Sharma R.K., 2013. A Novel Task Scheduling Algorithm for Real-Time Systems, IEEE International Conference on Communication and Signal Processing, pp. 995-998.
[5] Yuan P., Moallen M., Patel R.V., 2004. A Real-Time Task-Oriented Scheduling Algorithm for Distributed Multi-Robot Systems, Proceedings of the IEEE, International Conference on Robotics & Automation, pp. 2562-2567.
[6] Zhang Y., Parker L.E., 2013. Multi-Robot Task Scheduling, IEEE International Conference on Robotics and Automation (ICRA), pp. 2992-2998.
ALGORYTMY PLANOWANIA ZADAŃ W ŚRODOWISKU WIELU ROBOTÓW
Streszczenie
Na przestrzeni ostatnich lat problem poprawnego harmonogramowania zadań,
w środowisku wielu robotów, stał się przedmiotem wielu prac badawczych. Kluczem do tego problemu jest przydzielenie odpowiedniej ilości zadań do zrealizowania dla każdego robota oraz zaplanowanie optymalnej sekwencji ich wykonania. W celu minimalizacji czasu dostarczenia zasobu do punktu docelowego, zaprojektowano algorytmy planowania zadań. Proces ustalenia optymalnej ścieżki dla robota, biorąc pod uwagę sposób doręczenia zasobu, stał się dobrą strategią do zarządzania pracą robotów w wielu środowiskach. Przedstawione w niniejszym artykule algorytmy dotyczą procesu zarządzania i kontroli działań wykonywanych w środowisku logistycznym (magazyn), oparte na systemach miękkich czasu rzeczywistego. Celem autorów było opracowanie i porównanie algorytmów zarządzania w środowisku wielu robotów, pod względem liczby obsłużonych klientów oraz ilości zużytej energii na jej wykonanie. Aby potwierdzić skuteczność proponowanego podejścia, stworzono środowisko na którym przeprowadzono symulacje. Uzyskane wyniki wskazują, że proponowane podejście jest prawidłową drogą do uzyskania optymalizacji w planowaniu zadań i sekwencji ich wykonania, zwłaszcza dla algorytmu Queued Task Algorithm i Nearest Task Algorithm.
Słowa kluczowe: planowanie zadań, algorytmy sterowania robotami, systemy wieloagentowe, magazyn.

Lista recenzentów prac opublikowanych w 2014 roku Reviewers list publication published in 2014
Andrzej Rybarczyk (Politechnika Poznańska) Stanisław Szczepański (Politechnika Gdańska) Andrzej Kukwa (Uniwersytet Warmińsko-Mazurski) Maciej Piechowiak (Uniwersytet Kazimierza Wielkiego) Piotr Kiedrowski (Uniwersytet Technologiczno-Przyrodniczy) Sławomir Gryś (Politechnika Częstochowska) Jens Myrup Pedersen (Aalborg University)