Chest wall – a structure underestimated in ultrasonography ...

STR
UC
TUR
E A
ND
EN
VIR
ON
MEN
T
No.
2/2
018
vol
. 10
STRUCTURE ANDENVIRONMENTSTRUCTURE ANDENVIRONMENTNo. 2/2018 vol. 10 PL ISSN 2081-1500 www.sae.tu.kielce.pl KIELCE UNIVERSITY OF TECHNOLOGY
ARCHITECTURE, CIVIL ENGINEERING, ENVIRONMENTAL ENGINEERING, ENERGY AND GEOMATIC

PRZEMYSŁAW CZAPIK, MATEUSZ CEBULSKI
THE PROPERTIES OF CEMENT MORTAR WITH NATURAL ZEOLITE AND SILICA FUME ADDITIONSWŁAŚCIWOŚCI ZAPRAWY CEMENTOWEJ Z DODATKIEM ZEOLITU NATURALNEGO I PYŁU KRZEMIONKOWEGO ...................... 105
ANNA SKAWIŃSKA, ALEKSANDRA TKOCZ, PELAGIA LASKA-JÓZEFCZAK, TOMASZ FOSZCZ
THE POSSIBILITY OF THE USE OF SECONDARY RAW MATERIALS FROM ENERGY AND IRON&STEEL INDUSTRIES FOR GLASS-CERAMICS PRODUCTIONMOŻLIWOŚĆ WYKORZYSTANIA SUROWCÓW WTÓRNYCH PRZEMYSŁU ENERGETYCZNEGO I HUTNICZEGO DO WYTWARZANIA SZKŁA-CERAMIKI ........................................................................................................ 114
MICHAIL VASILEVICH NEMCHINOV, ANNA GENNADIEVNA IVANOVA
SNOWDRIFT EXTENT ON MOTORWAYS WITH BUSY TRAFFICZASIĘG POKRYWY ŚNIEŻNEJ NA AUTOSTRADACH O DUŻYM NATĘŻENIU RUCHU ................................................................... 122
ANNA BAZAN-KRZYWOSZAŃSKA
GIS TECHNOLOGY AS A TOOL FOR PROTECTING LANDSCAPE AND CULTURAL VALUES IN SPATIAL PLANNINGTECHNOLOGIA GIS NARZĘDZIEM OCHRONY KRAJOBRAZU I WARTOŚCI KULTUROWYCH W PLANOWANIU PRZESTRZENNYM .... 129
LUCJAN W. KAMIONKA
THE IMAGE OF THE CONTEMPORARY ARCHITECTURE OF KIELCE – A REVIEW OF THE SELECTED BUILDINGSOBRAZ WSPÓŁCZESNEJ ARCHITEKTURY KIELC NA PRZYKŁADZIE WYBRANYCH OBIEKTÓW ................................................ 138
VADYM ABYZOV
ARCHITECTURE-&-BUILDING SYSTEMS IN CIVIL CONSTRUCTIONSYSTEMY ARCHITEKTONICZNE I BUDOWLANE W BUDOWNICTWIE CYWILNYM ................................................................... 153
PAWEŁ LESIAK
PASSIVE ENERGY REDUCTION TECHNOLOGIES IN ENVIRONMENTAL ENGINEERINGTECHNOLOGIE PASYWNEGO OGRANICZANIA ZUŻYCIA ENERGII W INŻYNIERII ŚRODOWISKA .............................................. 161
ANDRZEJ BĄKOWSKI, LESZEK RADZISZEWSKI, PAWEŁ ŚWIETLIK, VLADIMIR DEKÝŠ
COMPARATIVE ANALYSIS OF MEASUREMENT DATA RECORDED BY TWO TRAFFIC MONITORING STATIONS ANALIZA PORÓWNAWCZA WYNIKÓW POMIARÓW ZAREJESTROWANYCH PRZEZ DWIE STACJE MONITORUJĄCE RUCH POJAZDÓW DROGOWYCH ...................................................................................................................................... 170
MILAN MALCHO, RICHARD LENHARD, MARTIN VANTÚCH, KATARÍNA KADUCHOVÁ, TOMÁŠ PUCHOR
WORKING PARAMETERS OF GAS HEAT PUMP IN USE WITH LOW-POTENTIAL GEOTHERMAL ENERGYPARAMETRY PRACY GAZOWEJ POMPY CIEPŁA WYKORZYSTUJĄCEJ GEOTERMALNĄ NISKIEJ ENTALPII ................................ 180
MARTIN VANTÚCH, ANDREJ KAPJOR, MICHAL HOLUBčÍK
ALTERNATIVE METHODS OF OBTAINING GEOTHERMAL HEAT FROM THE EARTHALTERNATYWNE METODY POZYSKIWANIA CIEPŁA Z WNĘTRZA ZIEMI ................................................................................. 184
ABSTRACTS ................................................................................................................................................................... 189
HOW TO PREPARE THE MANUSCRIPT .............................................................................................................................. 195
THE REVIEW PROCESS .................................................................................................................................................... 196
Contents

8
Editor-in-Chief:
Prof. Zdzisława OWSIAK – Faculty of Civil Engineering and Architecture, Kielce University of Technology (Poland)
International Advisory Board:
Chairman: Prof. Wiesław TRĄMPCZYŃSKI – Kielce University of Technology (Poland)Prof. Vadim ABIZOW – Kyiev’s National University of Culture and Art (Ukraine)Prof. Satoshi AKAGAWA – Hokkaido University, Sapporo (Japan) Prof. Tomasz ARCISZEWSKI – George Mason University (USA)Prof. Elżbieta BEZAK-MAZUR – Kielce University of Technology (Poland)Prof. Mark BOMBERG – McMaster University (Canada)Prof. Jan BUJNAK – University of Źilina (Slovakia) Prof. Dorota CHWIEDUK – Warsaw University of Technology (Poland)Prof. Barbara GOSZCZYŃSKA – Kielce University of Technology (Poland)Prof. Krystyna GURANOWSKA-GRUSZECKA – Warsaw University of Technology (Poland) Prof. Jerzy HOŁA – Wrocław University of Science and Technology (Poland)Prof. Go IWAHANA – University of Alaska Fairbanks (USA)Prof. Lucjan KAMIONKA – Kielce University of Technology (Poland)Prof. Andrej KAPJOR – University of Zilina (Slovakia)Prof. Zbigniew KOWAL – Kielce University of Technology (Poland)Prof. Tomasz KOZŁOWSKI – Kielce University of Technology (Poland)Prof. Andrzej KULICZKOWSKI – Kielce University of Technology (Poland)Prof. Jozef MELCER – University of Źilina (Slovakia)Prof. Mikhail NEMCHINOV – Moscow State Automobile and Road Technical University MADI (Russia)Prof. Andrzej S. NOWAK – Auburn University (USA)Prof. Ana Cristina Dinis Vicente PARDAL – Polytechnic Institute of Beja (Portugal)Prof. Wojciech G. PIASTA – Kielce University of Technology (Poland)Prof. Jorge Cruz PINTO – Universite de Lisbonne (Portugal)Prof. Jerzy Z. PIOTROWSKI – Kielce University of Technology (Poland)Prof. Karel POSPÍŠIL – The Transport Research Centre CDV (Czech Republic)Prof. Claude VAN ROOTEN – Belgian Road Research Centre (Belgium)Prof. Zbigniew RUSIN – Kielce University of Technology (Poland)Prof. Wacław SERUGA – Kielce University of Technology (Poland)Prof. Jacek SZEWCZYK – Kielce University of Technology (Poland)Prof. Jerzy WAWRZEŃCZYK – Kielce University of Technology (Poland)Prof. Bogdan WOLSKI – Kielce University of Technology (Poland)Prof. Maria ŻYGADŁO – Kielce University of Technology (Poland)
Associate Editors:
Prof. Lidia DĄBEK – Faculty of Environmental, Geomatic and Energy Engineering, Kielce University of Technology (Poland)Prof. Marek IWAŃSKI – Faculty of Civil Engineering and Architecture, Kielce University of Technology (Poland)
Secretary of the Editor Board:
Łukasz ORMAN, Ph.D., D.Sc. – Faculty of Environmental, Geomatic and Energy Engineering, Kielce University of Technology (Poland)
The quarterly printed issues of Structure and Environment are their original versions
The Journal published by the Kielce University of Technology
PL ISSN 2081-1500
© Copyright by Wydawnictwo Politechniki Świętokrzyskiej, 2018 25-314 Kielce, al. Tysiąclecia Państwa Polskiego 7, tel. 41 34 24 581 www.wydawnictwo.tu.kielce.pl
Index Copernicus Value (ICV): 75,2.
The journal is listed in the scored journals list, with the MNiSW score = 9.

105
1. INTRODUCTIONMineral admixtures commonly used for the
production of cement and concrete are classified into chemically inert materials – fillers, and those which react chemically in the cement paste environment, producing cement composites with modified properties [1-21]. The latter type includes pozzolanic materials.
Pozzolans are a broad group of materials comprising both natural and synthetic types. Synthetic materials with pozzolanic properties include fly ash and silica fume [1-12]. Pumice, metakaolin, opal and zeolites are natural pozzolans [2, 13-23].
Pozzolans have an ability to enter into pozzolanic reaction, that is, to produce calcium silicate hydrates
PRZEMYSŁAW CZAPIK1
MATEUSZ CEBULSKI
Kielce University of Technology1 e-mail: [email protected]
THE PROPERTIES OF CEMENT MORTAR WITH NATURAL ZEOLITE AND SILICA FUME ADDITIONS
WŁAŚCIWOŚCI ZAPRAWY CEMENTOWEJ Z DODATKIEM ZEOLITU NATURALNEGO I PYŁU KRZEMIONKOWEGO
DOI: 10.30540/sae-2018-010
1. WPROWADZENIEDodatki mineralne są obecnie powszechnie stosowa-
ne w produkcji cementu i betonu. Wśród nich wyróżnia się zarówno dodatki inertne chemicznie – wypełniacze, jak i takie, które w środowisku zaczynu cementowego wchodzą w reakcje chemiczne, na skutek których uzy-skiwane są kompozyty cementowe o zmodyfikowa-nych właściwościach [1-21]. Do dodatków drugiego rodzaju zalicza się materiały wykazujące właściwości pucolanowe.
Pucolany stanowią szeroką grupę materiałów, po-śród których wyróżnić można pucolany pochodze-nia naturalnego oraz syntetyczne. Do materiałów sztucznych, posiadających właściwości pucolanowe, zalicza się popioły lotne i pył krzemionkowy [1-12].
Manuscript submitted 2017.06.10 – revised 2017.09.29, initially accepted for publication 2017.11.30, published in June 2018
A b s t r a c tThis article reports the results of a study evaluating the effect of natural zeolite and silica fume on the properties of cement mortar. The study used binders in which 20% of portland cement was replaced with the pozzolanic admixtures. Both admixtures were studied separately and combined as a 1:1 blend. Reference samples were produced with non-modified cement binders. The tests were conducted for hydration kinetics on cement pastes, consistencies and strength in flexure and compression on mortars. The results indicated that different pozzolans affected the mortar differently. The effect of zeolite and silica fume blend on the properties of mortars is not an averaged effect of those admixtures used individually.
Keywords: Mortar, Pozzolans, Silica Fume, Zeolite
S t r e s z c z e n i eNiniejsze opracowanie dotyczy wpływu zeolitu naturalnego i pyłu krzemionkowego na właściwości zaprawy cementowej. W tym celu sporządzono spoiwa, w których 20% cementu portlandzkiego zastępowano dodatkami pucolanowymi. Oba dodatki przebadano oddzielnie, jak i łącznie w formie mieszanki pucolan w stosunku 1:1. Próbki odniesienia wykonano z niemodyfikowanego spoiwa cementowego. Wykonano badania kinetyki hydratacji na zaczynach oraz konsystencji, jak również wytrzymałości na zginanie i ściskanie na zaprawach. Wyniki badań wykazały, że wpływ różnych rodzajów puco-lan na właściwości zaprawy jest odmienny. Wpływ mieszanki zeolitu i pyłu krzemionkowego na właściwości zaprawy nie jest uśrednionym wpływem, jaki wywierają te dodatki stosowane oddzielnie.
Słowa kluczowe: zaprawa, pucolana, pył krzemionkowy, zeolit
106
THE PROPERTIES OF CEMENT MORTAR WITH NATURAL ZEOLITE AND SILICA FUME ADDITIONS
(C-S-H) from the reaction with Ca(OH)2 [2-4, 13]. The progress of pozzolanic reaction depends on the form of silica, content of amorphous phase and its structure, and specific surface area of the pozzolan [5, 6, 15, 24]. The higher the specific surface area is, the faster chemical reactions are due to increased contact area [3, 5, 17, 24]. Considering the development of the specific area, special attention should be paid to volcanic ash, calcined clays (tras), metakaolin, silica fume and zeolites [3, 13-17].
Produced by arc electric furnaces during the production of silicon or ferrosilicon alloys, silica fume is characterized by high specific surface area due to very fine spherical particles made mostly of amorphous silica (> 85%). Considering rheology and reinforcement protection in concrete, it is recommended not to use more than 10% of silica as cement replacement [1, 3, 4, 7].
Zeolites, which are components of volcanic tuffs, are aluminosilicates with a characteristic loose structure in which cage-like cavities and channels [25] can be distinguished, responsible for the significant nanoporosity of these materials. Because of their porosity, they may exhibit high surface area for pozzolanic reaction to occur. This is due to the dissolution of zeolites in a strongly alkaline environment, whereby silicon ions become available for reaction [4, 18, 25]. Cement can be replaced by zeolite up to 40% [18-20]. Higher zeolite fraction contributes to a significant deterioration of consistency and strength parameters [18-21]. It may also reduce concrete durability [19]. According to Ahmadi and Shekarchi [18], the use of zeolite in the amount of up to 10% by cement-zeolite binder mass may, however, result in a more gas-tight microstructure than with the use of silica fume.
Cement and concrete are often produced with only one of the known mineral admixtures. It is also possible to use a blend of several admixtures in one binder. Attention should be paid to the characteristics of these materials that may impair the properties of the fresh and hardened mortar [4, 7]. For zeolites used with other mineral admixtures, the results of studies of blends of zeolite and fly ash or granulated blast furnace slag [22] are reported in the literature. Silica fume used together with fly ash improves fly ash concrete properties [26, 27].
This article reports the effect of addition of natural zeolite and silica fume, used both separately and in the form of a mixture, on the properties of cement mortar.
Wśród pucolan naturalnych można wymienić pu-meks, metakaolin, opal i zeolity [2, 13-23].
Pucolany to materiały zdolne do wchodzenia w re-akcję pucolanową, czyli wytwarzania uwodnionych krzemianów wapnia (fazy C-S-H) na skutek reakcji z Ca(OH)2 [2-4, 13]. Przebieg tej reakcji uzależnio-ny jest od składu chemicznego, formy występowania krzemionki, zawartości fazy amorficznej i jej struktu-ry oraz od powierzchni właściwej pucolany [5, 6, 15, 24]. Im większa jest powierzchnia właściwa materia-łu, tym reakcje chemiczne mogą zachodzić szybciej, gdyż większa jest powierzchnia kontaktu [3, 5, 17, 24]. Pod względem rozwinięcia powierzchni właściwej, na szczególną uwagę zasługują takie materiały pucolano-we, jak pyły wulkaniczne, prażone gliny (tras), meta-kaolin oraz pył krzemionkowy i zeolity [3, 13-17].
Powstający w piecach łukowych podczas produkcji krzemu lub stopów żelazokrzemowych pył krzemion-kowy cechuje się dużą powierzchnią właściwą, po-nieważ składa się z bardzo drobnych, kulistych czą-stek. Zbudowane są one przede wszystkim (> 85%) z amorficznej krzemionki. Ze względu na właściwości reologiczne i ochronę zbrojenia w betonie niezalecane jest stosowanie tego dodatku mineralnego do cementu w ilości przekraczającej 10% [1, 3, 4, 7].
Zeolity będące składnikami tufów wulkanicznych są glinokrzemianami o charakterystycznej luźnej struktu-rze, w której wyróżnić można komory i kanały [25] odpowiedzialne za znaczną nanoporowatość tych ma-teriałów. Ze względu na porowatość mogą one wyka-zywać duże rozwinięcie powierzchni, na której docho-dzi do reakcji pucolanowej. Następuje ona na skutek rozpuszczania się zeolitów w silnie zasadowym środo-wisku, dzięki czemu jony krzemotlenowe stają się do-stępne dla reakcji [4, 18, 25]. Cement może być zastę-powany przez zeolit w ilości do 40% [18-20]. Wyższy udział zeolitu przyczynia się do znacznego pogorsze-nia konsystencji i parametrów wytrzymałości [18-21]. Może też być przyczyną obniżonej trwałości betonu [19]. Według Ahmadi i Shekarchi [18] stosowanie ze-olitu w ilości do 10% masy spoiwa cementowo-zeoli-towego skutkować może jednak uzyskaniem bardziej gazoszczelnej mikrostruktury niż podczas stosowania pyłu krzemionkowego.
Do produkcji cementów i betonów często wyko-rzystuje się tylko jeden ze znanych dodatków mine-ralnych. Możliwe jest też wykorzystanie w jednym spoiwie mieszaniny kilku dodatków. Podczas wpro-wadzania mieszaniny dodatków należy zwracać uwa-gę na te ich cechy, które mogą pogorszyć właściwości świeżej i stwardniałej zaprawy [4, 7]. W odniesieniu
107
WŁAŚCIWOŚCI ZAPRAWY CEMENTOWEJ Z DODATKIEM ZEOLITU NATURALNEGO I PYŁU KRZEMIONKOWEGO
2. MATERIALS AND METHODSCement CEM I 42.5R, Transcarpathian zeolite and
silica fume, with chemical compositions as in Table 1, were used in this study. Transcarpathian zeolite, mined in the Transcarpathian region of western Ukraine [28, 29], is an aleurite-psammite vitrocrystalloclastic tuff, zeoliticized due to the interaction of low-temperature hydrothermal solutions. It contains up to 84% clinoptilolite by weight, accompanied by volcanic glass [23, 25, 28, 29]. Quartz, plagioclase and biotite make up the remaining 16%. All of the above materials were sieved through a 0.063 mm sieve prior to application, and the pozzolans were examined for particle size distribution with a laser diffractometer.
Table 2 compiles the composition of binders made from the materials above. The binders were mixed with water to obtain the pastes for evaluating the progress of hydration. Consistency and strength in flexure and compression were determined on mortars. The pastes and mortars were made with water-binder ratio, w/b = 0.5.
do zeolitów stosowanych z innymi dodatkami mine-ralnymi, można znaleźć wyniki badań nad mieszan-kami zeolitu i popiołu lotnego albo granulowanego żużla wielkopiecowego [22]. Pył krzemionkowy sto-sowany wraz z pyłem lotnym poprawia z kolei wła-ściwości betonu popiołowego [26, 27].
W prezentowanej pracy przedstawiono wpływ do-datku zeolitu naturalnego i pyłu krzemionkowego, stosowanych zarówno oddzielnie, jak i w formie mie-szanki na właściwości zaprawy cementowej.
2. MATERIAŁY I METODY BADAńW badaniach zastosowano cement portlandzki CEM
I 42,5R, zeolit zakarpacki i pył krzemionkowy o skła-dach chemicznych podanych w tabeli 1. Zeolit zakar-packi to zeolit wydobywany na obszarze Zakarpacia położonego na zachodzie Ukrainy [28, 29]. Jest to zeolityzowany, wskutek oddziaływania niskotempe-raturowych roztworów hydrotermalnych aleurytowo--psamitowy, tuf witro-krystaloklastyczny. Zawiera on w swym składzie do 84% masy klinoptilolit, któremu towarzyszy szkliwo wulkaniczne [23, 25, 28, 29].
Pozostałe 16% stanowią kwarc, plagioklazy i biotyt. Wszystkie powyższe materiały przed zastosowaniem przesiano przez sito 0,063 mm, a pucolany przebada-no pod względem rozkładu uziarnienia dyfraktome-trem laserowym.
Z tych materiałów wytworzono spoiwa o składzie przedstawionym w tabeli 2. Spoiwa zarabiano wodą aby otrzymać zaczyny do badania postępu hydrata-cji. Dla zapraw określono konsystencję oraz wytrzy-małości na zginanie i ściskanie. Zaczyny i zaprawy sporządzono z zachowaniem współczynnika wodno--spoiwowego w/s = 0,5.
Badanie kinetyki hydratacji przeprowadzono meto-dą kalorymetrii semiadiabatycznej [3]. W tym celu 5 g
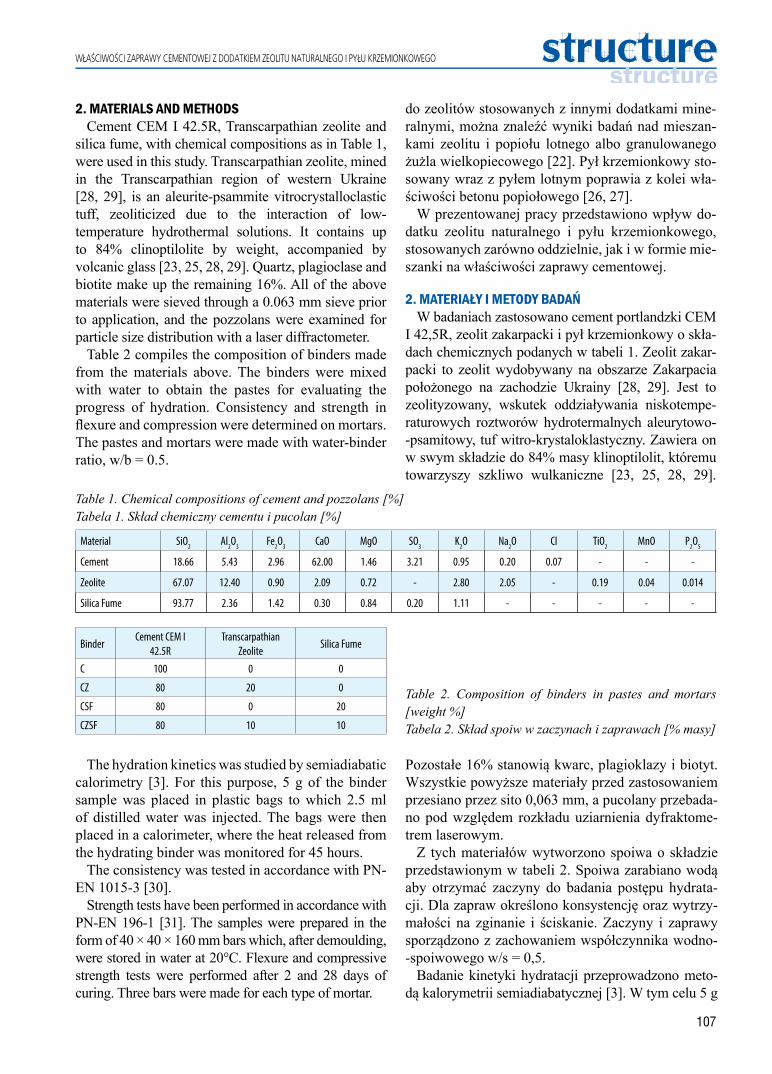
Table 1. Chemical compositions of cement and pozzolans [%]Tabela 1. Skład chemiczny cementu i pucolan [%]
Material SiO2 Al2O3 Fe2O3 CaO MgO SO3 K2O Na2O Cl TiO2 MnO P2O5
Cement 18.66 5.43 2.96 62.00 1.46 3.21 0.95 0.20 0.07 - - -
Zeolite 67.07 12.40 0.90 2.09 0.72 - 2.80 2.05 - 0.19 0.04 0.014
Silica Fume 93.77 2.36 1.42 0.30 0.84 0.20 1.11 - - - - -
BinderCement CEM I
42.5RTranscarpathian
ZeoliteSilica Fume
C 100 0 0
CZ 80 20 0
CSF 80 0 20
CZSF 80 10 10
The hydration kinetics was studied by semiadiabatic calorimetry [3]. For this purpose, 5 g of the binder sample was placed in plastic bags to which 2.5 ml of distilled water was injected. The bags were then placed in a calorimeter, where the heat released from the hydrating binder was monitored for 45 hours.
The consistency was tested in accordance with PN-EN 1015-3 [30].
Strength tests have been performed in accordance with PN-EN 196-1 [31]. The samples were prepared in the form of 40 × 40 × 160 mm bars which, after demoulding, were stored in water at 20°C. Flexure and compressive strength tests were performed after 2 and 28 days of curing. Three bars were made for each type of mortar.
Table 2. Composition of binders in pastes and mortars [weight %]Tabela 2. Skład spoiw w zaczynach i zaprawach [% masy]
108
THE PROPERTIES OF CEMENT MORTAR WITH NATURAL ZEOLITE AND SILICA FUME ADDITIONS
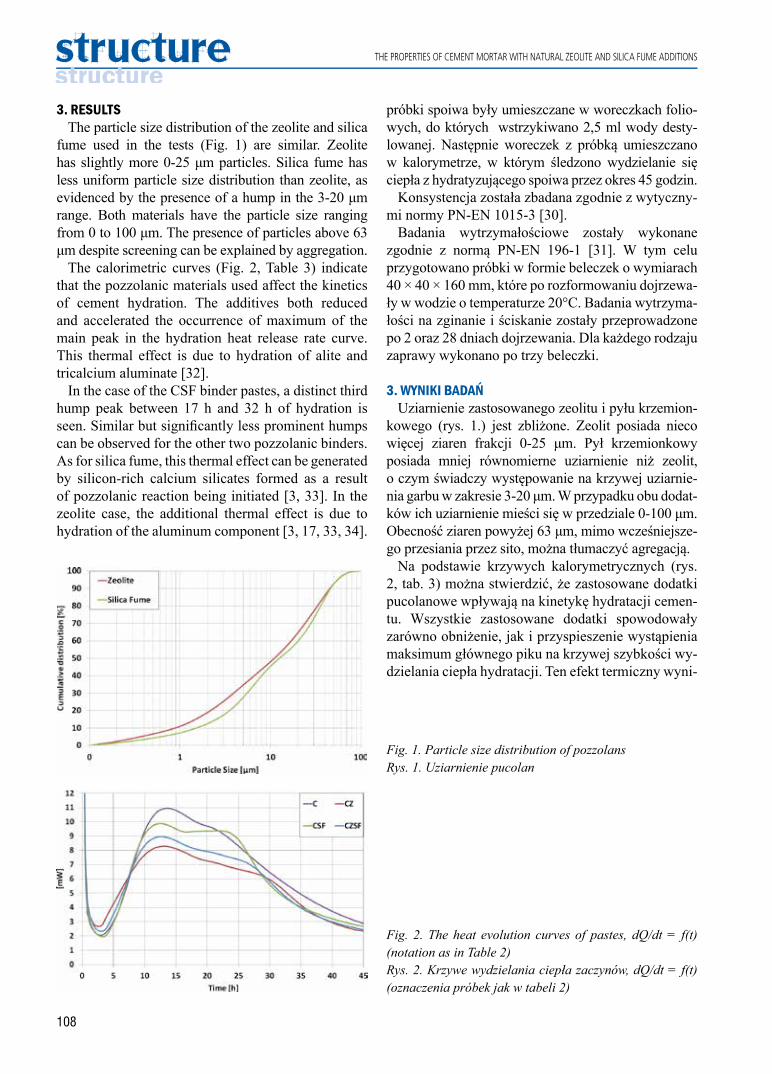
3. RESULTS The particle size distribution of the zeolite and silica
fume used in the tests (Fig. 1) are similar. Zeolite has slightly more 0-25 μm particles. Silica fume has less uniform particle size distribution than zeolite, as evidenced by the presence of a hump in the 3-20 μm range. Both materials have the particle size ranging from 0 to 100 μm. The presence of particles above 63 μm despite screening can be explained by aggregation.
The calorimetric curves (Fig. 2, Table 3) indicate that the pozzolanic materials used affect the kinetics of cement hydration. The additives both reduced and accelerated the occurrence of maximum of the main peak in the hydration heat release rate curve. This thermal effect is due to hydration of alite and tricalcium aluminate [32].
In the case of the CSF binder pastes, a distinct third hump peak between 17 h and 32 h of hydration is seen. Similar but significantly less prominent humps can be observed for the other two pozzolanic binders. As for silica fume, this thermal effect can be generated by silicon-rich calcium silicates formed as a result of pozzolanic reaction being initiated [3, 33]. In the zeolite case, the additional thermal effect is due to hydration of the aluminum component [3, 17, 33, 34].
próbki spoiwa były umieszczane w woreczkach folio-wych, do których wstrzykiwano 2,5 ml wody desty-lowanej. Następnie woreczek z próbką umieszczano w kalorymetrze, w którym śledzono wydzielanie się ciepła z hydratyzującego spoiwa przez okres 45 godzin.
Konsystencja została zbadana zgodnie z wytyczny-mi normy PN-EN 1015-3 [30].
Badania wytrzymałościowe zostały wykonane zgodnie z normą PN-EN 196-1 [31]. W tym celu przygotowano próbki w formie beleczek o wymiarach 40 × 40 × 160 mm, które po rozformowaniu dojrzewa-ły w wodzie o temperaturze 20°C. Badania wytrzyma-łości na zginanie i ściskanie zostały przeprowadzone po 2 oraz 28 dniach dojrzewania. Dla każdego rodzaju zaprawy wykonano po trzy beleczki.
3. WYNIKI BADAń Uziarnienie zastosowanego zeolitu i pyłu krzemion-
kowego (rys. 1.) jest zbliżone. Zeolit posiada nieco więcej ziaren frakcji 0-25 μm. Pył krzemionkowy posiada mniej równomierne uziarnienie niż zeolit, o czym świadczy występowanie na krzywej uziarnie-nia garbu w zakresie 3-20 μm. W przypadku obu dodat-ków ich uziarnienie mieści się w przedziale 0-100 μm. Obecność ziaren powyżej 63 μm, mimo wcześniejsze-go przesiania przez sito, można tłumaczyć agregacją.
Na podstawie krzywych kalorymetrycznych (rys. 2, tab. 3) można stwierdzić, że zastosowane dodatki pucolanowe wpływają na kinetykę hydratacji cemen-tu. Wszystkie zastosowane dodatki spowodowały zarówno obniżenie, jak i przyspieszenie wystąpienia maksimum głównego piku na krzywej szybkości wy-dzielania ciepła hydratacji. Ten efekt termiczny wyni-
Fig. 1. Particle size distribution of pozzolansRys. 1. Uziarnienie pucolan
Fig. 2. The heat evolution curves of pastes, dQ/dt = f(t) (notation as in Table 2)Rys. 2. Krzywe wydzielania ciepła zaczynów, dQ/dt = f(t) (oznaczenia próbek jak w tabeli 2)
109
WŁAŚCIWOŚCI ZAPRAWY CEMENTOWEJ Z DODATKIEM ZEOLITU NATURALNEGO I PYŁU KRZEMIONKOWEGO
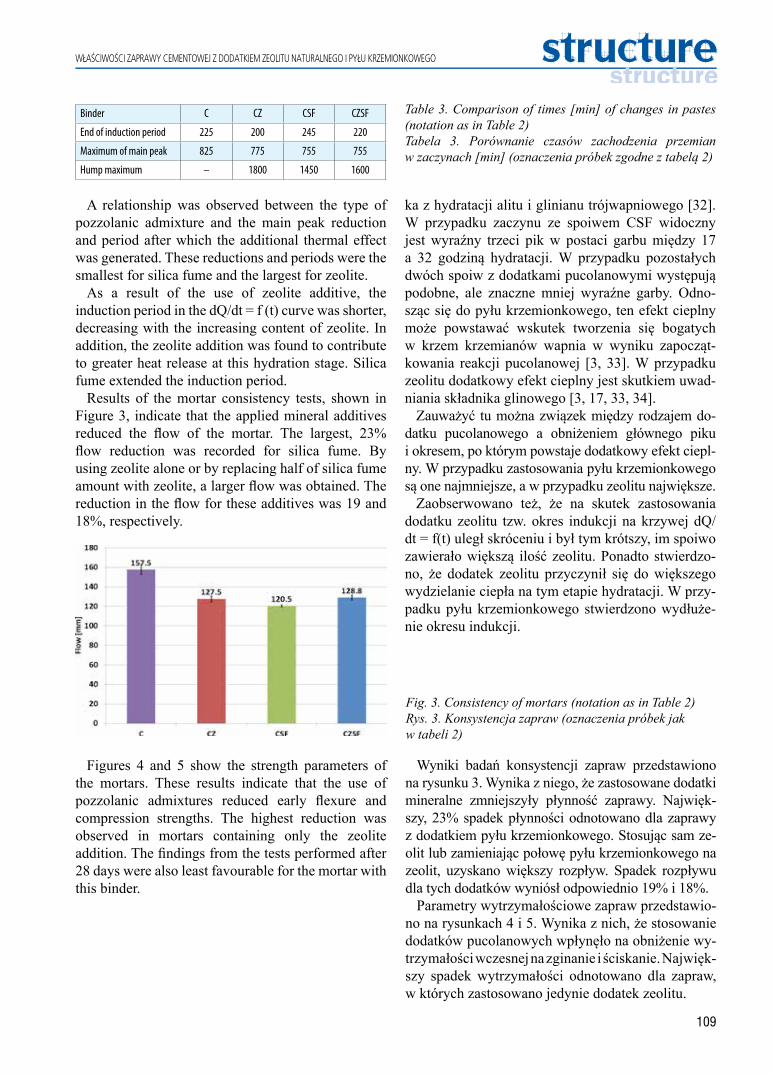
Binder C CZ CSF CZSF
End of induction period 225 200 245 220
Maximum of main peak 825 775 755 755
Hump maximum – 1800 1450 1600
A relationship was observed between the type of pozzolanic admixture and the main peak reduction and period after which the additional thermal effect was generated. These reductions and periods were the smallest for silica fume and the largest for zeolite.
As a result of the use of zeolite additive, the induction period in the dQ/dt = f (t) curve was shorter, decreasing with the increasing content of zeolite. In addition, the zeolite addition was found to contribute to greater heat release at this hydration stage. Silica fume extended the induction period.
Results of the mortar consistency tests, shown in Figure 3, indicate that the applied mineral additives reduced the flow of the mortar. The largest, 23% flow reduction was recorded for silica fume. By using zeolite alone or by replacing half of silica fume amount with zeolite, a larger flow was obtained. The reduction in the flow for these additives was 19 and 18%, respectively.
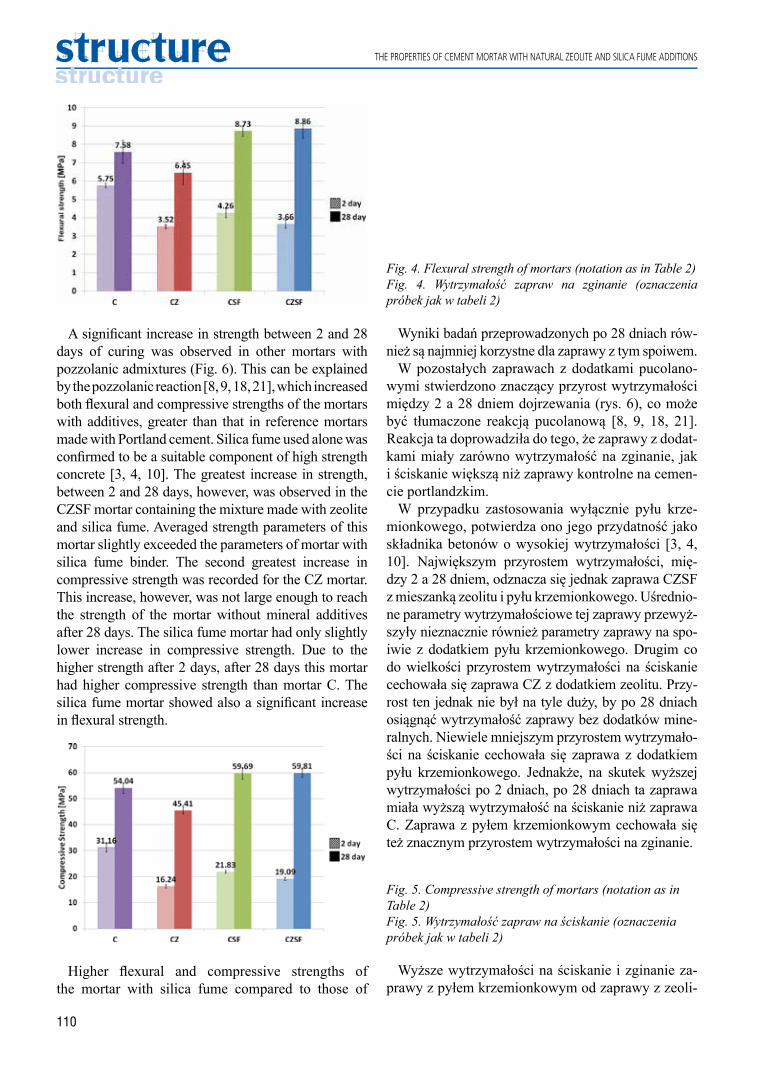
Figures 4 and 5 show the strength parameters of the mortars. These results indicate that the use of pozzolanic admixtures reduced early flexure and compression strengths. The highest reduction was observed in mortars containing only the zeolite addition. The findings from the tests performed after 28 days were also least favourable for the mortar with this binder.
ka z hydratacji alitu i glinianu trójwapniowego [32]. W przypadku zaczynu ze spoiwem CSF widoczny jest wyraźny trzeci pik w postaci garbu między 17 a 32 godziną hydratacji. W przypadku pozostałych dwóch spoiw z dodatkami pucolanowymi występują podobne, ale znaczne mniej wyraźne garby. Odno-sząc się do pyłu krzemionkowego, ten efekt cieplny może powstawać wskutek tworzenia się bogatych w krzem krzemianów wapnia w wyniku zapocząt-kowania reakcji pucolanowej [3, 33]. W przypadku zeolitu dodatkowy efekt cieplny jest skutkiem uwad-niania składnika glinowego [3, 17, 33, 34].
Zauważyć tu można związek między rodzajem do-datku pucolanowego a obniżeniem głównego piku i okresem, po którym powstaje dodatkowy efekt ciepl-ny. W przypadku zastosowania pyłu krzemionkowego są one najmniejsze, a w przypadku zeolitu największe.
Zaobserwowano też, że na skutek zastosowania dodatku zeolitu tzw. okres indukcji na krzywej dQ/dt = f(t) uległ skróceniu i był tym krótszy, im spoiwo zawierało większą ilość zeolitu. Ponadto stwierdzo-no, że dodatek zeolitu przyczynił się do większego wydzielanie ciepła na tym etapie hydratacji. W przy-padku pyłu krzemionkowego stwierdzono wydłuże-nie okresu indukcji.
Fig. 3. Consistency of mortars (notation as in Table 2)Rys. 3. Konsystencja zapraw (oznaczenia próbek jak w tabeli 2)
Wyniki badań konsystencji zapraw przedstawiono na rysunku 3. Wynika z niego, że zastosowane dodatki mineralne zmniejszyły płynność zaprawy. Najwięk-szy, 23% spadek płynności odnotowano dla zaprawy z dodatkiem pyłu krzemionkowego. Stosując sam ze-olit lub zamieniając połowę pyłu krzemionkowego na zeolit, uzyskano większy rozpływ. Spadek rozpływu dla tych dodatków wyniósł odpowiednio 19% i 18%.
Parametry wytrzymałościowe zapraw przedstawio-no na rysunkach 4 i 5. Wynika z nich, że stosowanie dodatków pucolanowych wpłynęło na obniżenie wy-trzymałości wczesnej na zginanie i ściskanie. Najwięk-szy spadek wytrzymałości odnotowano dla zapraw, w których zastosowano jedynie dodatek zeolitu.
Table 3. Comparison of times [min] of changes in pastes (notation as in Table 2)Tabela 3. Porównanie czasów zachodzenia przemian w zaczynach [min] (oznaczenia próbek zgodne z tabelą 2)
110
THE PROPERTIES OF CEMENT MORTAR WITH NATURAL ZEOLITE AND SILICA FUME ADDITIONS
Wyniki badań przeprowadzonych po 28 dniach rów-nież są najmniej korzystne dla zaprawy z tym spoiwem.
W pozostałych zaprawach z dodatkami pucolano-wymi stwierdzono znaczący przyrost wytrzymałości między 2 a 28 dniem dojrzewania (rys. 6), co może być tłumaczone reakcją pucolanową [8, 9, 18, 21]. Reakcja ta doprowadziła do tego, że zaprawy z dodat-kami miały zarówno wytrzymałość na zginanie, jak i ściskanie większą niż zaprawy kontrolne na cemen-cie portlandzkim.
W przypadku zastosowania wyłącznie pyłu krze-mionkowego, potwierdza ono jego przydatność jako składnika betonów o wysokiej wytrzymałości [3, 4, 10]. Największym przyrostem wytrzymałości, mię-dzy 2 a 28 dniem, odznacza się jednak zaprawa CZSF z mieszanką zeolitu i pyłu krzemionkowego. Uśrednio-ne parametry wytrzymałościowe tej zaprawy przewyż-szyły nieznacznie również parametry zaprawy na spo-iwie z dodatkiem pyłu krzemionkowego. Drugim co do wielkości przyrostem wytrzymałości na ściskanie cechowała się zaprawa CZ z dodatkiem zeolitu. Przy-rost ten jednak nie był na tyle duży, by po 28 dniach osiągnąć wytrzymałość zaprawy bez dodatków mine-ralnych. Niewiele mniejszym przyrostem wytrzymało-ści na ściskanie cechowała się zaprawa z dodatkiem pyłu krzemionkowego. Jednakże, na skutek wyższej wytrzymałości po 2 dniach, po 28 dniach ta zaprawa miała wyższą wytrzymałość na ściskanie niż zaprawa C. Zaprawa z pyłem krzemionkowym cechowała się też znacznym przyrostem wytrzymałości na zginanie.
A significant increase in strength between 2 and 28 days of curing was observed in other mortars with pozzolanic admixtures (Fig. 6). This can be explained by the pozzolanic reaction [8, 9, 18, 21], which increased both flexural and compressive strengths of the mortars with additives, greater than that in reference mortars made with Portland cement. Silica fume used alone was confirmed to be a suitable component of high strength concrete [3, 4, 10]. The greatest increase in strength, between 2 and 28 days, however, was observed in the CZSF mortar containing the mixture made with zeolite and silica fume. Averaged strength parameters of this mortar slightly exceeded the parameters of mortar with silica fume binder. The second greatest increase in compressive strength was recorded for the CZ mortar. This increase, however, was not large enough to reach the strength of the mortar without mineral additives after 28 days. The silica fume mortar had only slightly lower increase in compressive strength. Due to the higher strength after 2 days, after 28 days this mortar had higher compressive strength than mortar C. The silica fume mortar showed also a significant increase in flexural strength.
Higher flexural and compressive strengths of the mortar with silica fume compared to those of
Fig. 4. Flexural strength of mortars (notation as in Table 2)Fig. 4. Wytrzymałość zapraw na zginanie (oznaczenia próbek jak w tabeli 2)
Fig. 5. Compressive strength of mortars (notation as in Table 2)Fig. 5. Wytrzymałość zapraw na ściskanie (oznaczenia próbek jak w tabeli 2)
Wyższe wytrzymałości na ściskanie i zginanie za-prawy z pyłem krzemionkowym od zaprawy z zeoli-

111
WŁAŚCIWOŚCI ZAPRAWY CEMENTOWEJ Z DODATKIEM ZEOLITU NATURALNEGO I PYŁU KRZEMIONKOWEGO
the mortar with zeolite can be explained by higher chemical activity of silica [3, 5, 6, 24]. Silica fume alone may be responsible for the high strength of the mixture with both zeolite and silica fume (10%), but a considerable strength increase between days 2 and 28 remains unexplained. The high strength of these mortars can also be related to the uniform distribution of pozzolan particles in the mixture, which additionally seals the mortar microstructure [3, 4]. Another factor may be the spread in time of pozzolanic processes, when silica fume reacts faster and zeolite react slower, as demonstrated by the results of calorimeter tests.
High strength of mortars is also correlated with an adequate consistency [10]. More flowable consistency contributes to easier mortar densification and air pore removal. The presented results indicate that the mortar containing a mixture of zeolite and silica fume also had the highest flow of all mortars being analysed.
4. CONCLUSIONSThe following conclusions summarize the findings
of the tests: 1. A blend of zeolite and silica fume improves the
parameters of the cement paste compared to the effects of the two materials used individually. Replacement of 20% cement by weight by the zeolite-silica fume mixture added at the 1:1 ratio provides the mortar with consistency similar to that when 20% zeolite is used, but with the strength of a 20% silica fume mortar. Addition of zeolite-silica fume blend will improve the strength of the mortar and decrease its flow compared to the mortar with silica fume used alone.
2. The effect of the zeolite-silica fume mixture on the consistency and flexural and compressive strength
tem można tłumaczyć większą aktywnością chemicz-ną amorficznej krzemionki [3, 5, 6, 24]. Za wysoką wytrzymałość zaprawy z mieszanką zeolitu i pyłu krzemionkowego mógłby odpowiadać sam pył, któ-rego zwykle stosuje się w ilości do 10%, ale nie tłu-maczy to znacznego przyrostu wytrzymałości między 2 i 28 dniem.
Wysoka wytrzymałość tych zapraw może być też związana z równomierniejszym rozłożeniem ziaren pucolan w mieszance, przez co lepiej mogą doszczel-niać mikrostrukturę zaprawy [3, 4]. Korzystne może być też rozłożenie w czasie procesów pucolanowych, kiedy to szybciej przereagowuje pył krzemionkowy, a wolniej zeolit. Świadczą o tym wyniki badań kalo-rymetrycznych.
Wysoka wytrzymałość zapraw powiązana jest rów-nież z odpowiednią konsystencją [10]. Bardziej płynna konsystencja przyczynia się do łatwiejszego zagęsz-czania zaprawy i usuwania porów powietrznych. Na podstawie przedstawionych wyników można stwier-dzić, że największą płynnością spośród zapraw zawie-rających dodatki pucolanowe cechowała się również zaprawa z mieszanką zeolitu i pyłu krzemionkowego.
Fig. 6. Strength gain between 2 and 28 day (notation as in Table 2)Rys. 6. Przyrost wytrzymałości między 2 a 28 dniem (oznaczenia próbek zgodne z tabelą 2)
4. WNIOSKIZ przeprowadzonych badań można wyciągnąć na-
stępujące wnioski: 1. Stosowanie mieszanki zeolitu i pyłu krzemionkowe-
go, zamiast każde z tych pucolan osobno, korzyst-nie wpływa na parametry zaprawy cementowej. Za-stępując 20% masy cementu przez mieszankę zeoli-tu naturalnego i pyłu krzemionkowego o stosunku 1:1, otrzymuje się zaprawę o konsystencji zbliżonej do konsystencji zaprawy z dodatkiem 20% zeolitu, ale o wytrzymałości zaprawy z 20% udziałem pyłu krzemionkowego. Tym samym, stosując taki doda-tek, zwiększeniu ulega wytrzymałość zaprawy przy mniejszym spadku jej płynności w porównaniu do zaprawy z pyłem krzemionkowym.
2. Wpływ mieszanki zeolitu naturalnego i pyłu krze-mionkowego na konsystencję oraz wytrzymałość

112
THE PROPERTIES OF CEMENT MORTAR WITH NATURAL ZEOLITE AND SILICA FUME ADDITIONS
of the mortar is not an averaged effect that either of the materials provides. Further studies are needed to have a better understanding of this phenomenon. The studies should also cover determining the long-term influence of the two admixtures on the strength of mortars, and their combined influence on the mortar properties when added at different ratios.
3. Partial replacement of silica fume by zeolite offers cost-related advantage due to limited availability and price of the silica fume [3, 4]. Lower flow reduction, compensated by the use of plasticizers and superplasticizers [4, 10, 18, 21], may contribute to the reduction in their use thus decreasing the mortar production costs.
na zginanie i ściskanie zaprawy nie jest uśrednio-nym wpływem, jaki wywiera na nie każda z tych pucolan z osobna. W celu wyjaśnienia tego zjawi-ska należy podjąć dalsze badania. Dalsze badania powinny też objąć swym zakresem, określenie długoterminowego wpływu zastosowanych dodat-ków mineralnych na wytrzymałość zapraw. Nale-ży też przebadać wpływ na właściwości zaprawy łącznego dodatku zeolitu i pyłu krzemionkowego mieszanych w innych proporcjach.
3. Możliwość częściowego zastąpienia pyłu krze-mionkowego przez zeolit, ze względu na ograni-czoną dostępność i cenę pyłu, jest korzystna ekono-micznie [3, 4]. Mniejszy spadek płynności, niwelo-wany przez stosowanie plastyfikatorów i superpla-styfikatorów [4, 10, 18, 21], przyczynić się może do ograniczenia ich zużycia, a przez to również do ograniczenia kosztów produkcji zaprawy.
References [1] PN-EN 197-1:2012 Cement. Composition, specifications and conformity criteria for common cements. [2] Pacheco-Torgal F., Jalali S., Labrincha J., John V.M., Eco-efficient concrete, Elsevier, 2013. [3] Nocuń-Wczelik W., Pył krzemionkowy – właściwości i zastosowanie w betonie, Stowarzyszenie Producentów
Cementu, Kraków 2005. [4] Kurdowski W., Chemia cementu i betonu, SPC, Kraków 2010. [5] Tkaczewska E., Effect of size fraction and glass structure of siliceous fly ashes on fly ash cement hydration, Journal
of Industrial and Engineering Chemistry 20/1 (2014), pp. 315-321. [6] Tkaczewska E., Małolepszy J., The properties of glass in siliceous fly ash, Cement Wapno Beton 14 (2009), pp.
148-153. [7] Jasiczak J., Mikołajczak P., Technologia betonu modyfikowanego domieszkami i dodatkami, Politechnika Poznańska,
Poznań 2003. [8] Kotwa A., Spychał E., Influence of mineral additives properties of concrete, Structure and Environment 8/2 (2016),
pp. 15-20. [9] Owsiak Z., The hydration of Portland cement with fly ash, Cement Wapno Beton 5/1 (2000), pp. 29-31.[10] Jasiczak J., Wdowska A., Rudnicki T., Betony ultrawysokowartościowe – właściwości, technologie, zastosowanie,
Polski Cement, Kraków 2008. [11] Nocuń-Wczelik W., Nowak M., Kapeluszna E., Lightweight mortars with expanded perlite modified by admixtures,
Structure and Environment 9/2 (2017), pp. 102-111.[12] Owsiak Z., Wójcik A., The influence of co-combusted biomass-coal fly ash on limiting alkali-silica reaction,
Structure and Environment 6/2 (2014), pp. 26-31.[13] Mansour M.S., Abadlia M. T., Jauberthie R., Messaoudene I., Metakaolin as a pozzolan for high-performance
mortar, Cement Wapno Beton 17/2 (2012), pp. 102-108.[14] Małolepszy J., Pytel Z. Effect of Metakaolinite on Strength and Chemical Resistance of Cement Mortars, (in) Proc.
of Fifth International Conference “Durability of Concrete, Vol I” Ed. by V.M. Malhotra, Spain, Barcelona 2000.[15] Wala D., Rosiek G., The clay minerals as pozzolanic addition for water cements, Cement Wapno Beton 8/1 (2003),
pp. 27-33.[16] Pytel Z., Małolepszy J., Effects of parameters of thermal treatment on the pozzolanic properties of burnt kaolin clay,
Cement Wapno Beton 4/3 (1999), pp. 80-83.[17] Czapik P., Czechowicz M., Effects of natural zeolite particle size on the cement paste properties, Structure and
Environment 9/3 (2017), pp. 180-190.[18] Ahmadi B., Shekarchi M., Use of natural zeolite as a supplementary cementitious material, Cement and Concret
Composites 32/2 (2010), pp. 134-141.

113
WŁAŚCIWOŚCI ZAPRAWY CEMENTOWEJ Z DODATKIEM ZEOLITU NATURALNEGO I PYŁU KRZEMIONKOWEGO
[19] Vejmelková E., Keppert M., Ondráček M., Černý R., Effect of natural zeolite on the properties of high performance concrete, Cement Wapno Beton 18/3 (2013), pp. 150-159.
[20] Siemaszko-Lotkowska D., Gajewski R., Właściwości zeolitu w aspekcie zastosowania w betonie (2008), pp. 1101-1108.
[21] Małolepszy J., Grabowska E., Wpływ zeolitów na proces hydratacji spoiw mineralnych, Budownictwo i Architektura 12/3 (2013), pp. 185-192.
[22] Karakurt C., Topçu İ.B., Effect of blended cements produced with natural zeolite and industrial by-products on alkali-silica reaction on sulfate resistance of concrete, Construction and Building Materials 25/4 (2011), pp. 1789-1795.
[23] Czapik P., Aktywność zeolitu naturalnego w środowisku zaczynu cementowego, (in) Proc. of 14th Conference of the Scientific Conference for Civil Engineering PhD Students „Wiedza i eksperymenty w budownictwie” Ed. by J. Bzówka, Politechnika Śląska, Gliwice 2014.
[24] Broekmans M.A.T.M., Structural properties of quartz and their potential role for ASR, Materials Characterization 53/2-4 (2004), pp. 129-140.
[25] Ciciszwili G.W., Zeolity naturalne, Wydawnictwo Naukowo-Techniczne, Warszawa 1990.[26] Gil D.M., Golewski G.L., Wpływ dodatku pyłu krzemionkowego (SF) i krzemionkowych popiołów lotnych (FA) na
krytyczny współczynnik intensywności naprężeń betonu, Materiały Budowlane 1 (2017), pp. 48-49.[27] Giergiczny Z., Cementy popiołowe z dodatkami pyłu krzemionkowego, Cement Wapno Beton 1 (1995), pp. 17-22. [28] Pieczonka J., Piestrzyński A., Parańko I., Geologia wybranych złóż surowców mineralnych Ukrainy, AGH,
Kraków 2011.[29] Barnat-Hunek D., Siddique R., Klimek B., Franus M., The use of zeolite, lightweight aggregate and boiler slag in
restoration renders, Construction and Building Materials 142/1 (2017), pp. 162-174.[30] PN-EN 1015-3:2000 Methods of test for mortar for masonry. Determination of consistence of fresh mortar (by flow
table). [31] PN-EN 196-1:2016-07 Methods of testing cement. Determination of strength.[32] Zhang M.-H., Sisomphon K., Ng T.S., Sun D.J., Effect of superplasticizers on workability retention and initial
setting time of cement pastes, Construction and Building Materials 24/9 (2010), pp. 1700-1707.[33] Taylor H.F.W., Cement Chemistry, Academic Press, London 1990.[34] Usherov-Marshak A.V.V., Ciak M.J., Isothermal calorimetry in the standard ASTM C1679-08, Cement Wapno
Beton 15/2 (2010), pp. 108-110.
Acknowledgments:This work was supported by Kielce University of Technology, Grant No. 02.0.05.00/2.01.01.02.0057 MNSC.BKTO.15.005
Podziękowania:Praca była finansowana przez Politechnikę Świętokrzyską, grant nr 02.0.05.00/2.01.01.02.0057 MNSC.BKTO.15.005
114
ANNA SKAWIŃSKA1
ALEKSANDRA TKOCZPELAGIA LASKA-JÓZEFCZAK TOMASZ FOSZCZ
Institute of Ceramics and Building Materials, Glass and Building Materials Division in Cracow1 e-mail: [email protected]
THE POSSIBILITY OF THE USE OF SECONDARY RAW MATERIALS FROM ENERGY AND IRON&STEEL INDUSTRIES FOR
GLASS-CERAMICS PRODUCTIONMOŻLIWOŚĆ WYKORZYSTANIA SUROWCÓW WTÓRNYCH
PRZEMYSŁU ENERGETYCZNEGO I HUTNICZEGO DO WYTWARZANIA SZKŁA-CERAMIKI
DOI: 10.30540/sae-2018-011
1. INTRODUCTIONThe wastes have always accompanied people.
For many years, they have been thrown directly into the surrounding environment, which caused contamination with toxic substances. Materials defined as “wastes” are subject to strict legal regulations. In accordance with the Act of 27 April 2001 on wastes (Journal of Laws 2007, No. 39, item 251 – consolidated text) “wastes” shall mean all substances or objects in the categories set out in Annex 1 of the Act, which the holder discards (or is required to discard) [1]. Siliceous fly ash and granulated blast-
1. WPROWADZENIEOdpady towarzyszą człowiekowi od zawsze. Przez
lata były wyrzucane bezpośrednio do otaczającego środowiska, przez co dochodziło do skażenia sub-stancjami toksycznymi. Materiały charakteryzowa-ne jako „odpady” podlegają ścisłym uregulowaniom prawnym. Zgodnie z ustawą z dnia 27 kwietnia 2001 roku o odpadach (Dz.U. z 2007 r., nr 39, poz. 251 – tekst jednolity) odpady oznaczają każdą substancję lub przedmiot należący do jednej z kategorii, określonych w załączniku nr 1 do ustawy, których posiadacz po-zbywa się (lub do ich pozbycia jest zobowiązany) [1].
Manuscript submitted 2017.10.17 – revised 2017.12.15, initially accepted for publication 2017.12.19, published in June 2018
A b s t r a c tAn effective way to glass strengthening is controlled crystallization, which results in obtaining the material with very favourable mechanical properties compared to parent glass. Crystallization process is conducted between glass transformation temperature and liquidus temperature. Information concerning the production of glass-ceramics material, as well as materials, which are the most commonly used in its production, were analyzed in this paper.
Keywords: wastes, glass-ceramics, blast-furnace slag, siliceous fly ash
S t r e s z c z e n i eSkutecznym sposobem wzmocnienia szkła jest kontrolowana krystalizacja, co skutkuje otrzymaniem materiału o bardzo dobrych właściwościach mechanicznych w porównaniu do szkła macierzystego. Proces krystalizacji prowadzony jest pomiędzy temperaturą transformacji szkła a temperaturą likwidusu. W artykule przenalizowano informacje dotyczące otrzymywania tworzywa szkło-ceramiki, jak również materiałów najczęściej wykorzystywanych podczas produkcji tego materiału.
Słowa kluczowe: odpady, szkło-ceramika, żużel wielkopiecowy, popiół lotny krzemionkowy

115
MOŻLIWOŚĆ WYKORZYSTANIA SUROWCÓW WTÓRNYCH PRZEMYSŁU ENERGETYCZNEGO I HUTNICZEGO DO WYTWARZANIA ...
furnace slag are classified as ecologically safe green wastes, according to Waste Shipment Regulation No 1013/2006 [2].
The use of green listed wastes in contemporary production technologies is part of the sustainable development strategy, in which environmental protection is one of the assumptions. Definition of sustainable development, which was approved in Rio de Janeiro in 1992 on Earth Summit, is as follows: „Development that meets the needs of the present without compromising the ability of future generations to meet their own needs”. Currently, it is expected that manufacturing industry does not emit harmful substances to the environment, and obtained products are friendly and suitable for recycling. Glass is both human and environmental friendly, but it is material with some defects. The main problem is glass fragility, which is the reason of striving for the improvement of mechanical properties by controlled crystallization. Additionally, secondary raw materials are increasingly used due to environmental protection and obtaining better mechanical properties of glass-ceramics [3-5].
Fly ash is one of the by-products of energy industry, which can be used in glass-ceramics production. The production of electricity in Poland is mainly based on coal (96%), and the side effect is huge amount of furnace wastes. From this reason, the main aim and the priority of environmental policy of the state is protection of natural environment by searching for new ways of waste management. Various types of coal and varieties of power boilers cause that fly ash has variable properties, which is very important in their re-use in industry. Currently, fly ash is used on a large scale in cement industry, road construction, ceramics, agriculture or plastics and paint industries [6-8].
The most common and the most important hydraulic additive used in cement production is granulated blast-furnace slag. Despite the fact that it is a waste, it is also used in the production of masonry mortars, slag bricks and as a material for the construction of roads and highways. Granulated blast-furnace slag was one of the first secondary raw materials used in glass-ceramics production [9].
Glass strengthening by controlled crystallization is not used on large scale in Poland, and therefore this paper focuses on the possibility of using the aforementioned secondary raw materials in glass-ceramics production.
Popiół lotny krzemionkowy oraz granulowany żużel wielkopiecowy klasyfikowany jest według Dyrektywy Nr 1013/2006 „Waste Shipment Regulation” jako ekologicznie bezpieczne odpady zielone [2].
Zastosowanie zielonych surowców odpadowych we współczesnych technologiach produkcji wpisuje się w strategię zrównoważonego rozwoju, w której jednym z założeń jest ochrona środowiska naturalnego. Defini-cja zrównoważonego rozwoju, którą przyjęto w Rio de Janeiro w 1992 r. na „Szczycie Ziemi”, jest następują-ca: „Rozwój zaspokajający potrzeby dzisiejszej genera-cji bez konieczności ograniczania możliwości zaspoka-jania potrzeb przyszłych pokoleń”. Obecnie dąży się do tego, aby przemysł produkcyjny nie emitował substan-cji szkodliwych dla środowiska, a otrzymany wyrób był przyjazny i nadawał się do recyklingu. Szkło jest materiałem przyjaznym zarówno dla człowieka, jak i środowiska naturalnego, jednak nie jest materiałem pozbawionym wad. Głównym problemem jest jego kruchość, w związku z tym w technologii materiało-wej dąży się do poprawy właściwości mechanicznych tego materiału przez kierowaną krystalizację. Dodatko-wo, ze względu na ochronę środowiska oraz uzyskanie lepszych właściwości mechanicznych szkła-ceramiki, coraz częściej stosowane są surowce wtórne [3-5].
Jednym z ubocznych produktów przemysłu ener-getycznego, które mogą być stosowane w produkcji szkło-ceramika, są popioły lotne. Produkcja energii elektrycznej w Polsce bazuje głównie na węglu (96%), a efektem ubocznym jest ogromna ilość odpadów pa-leniskowych. Dlatego też głównym celem oraz prio-rytetem polityki ekologicznej państwa jest ochrona środowiska naturalnego przez poszukiwanie nowych sposobów zagospodarowania odpadów. Różne gatunki węgla oraz odmiany kotłów energetycznych przyczy-niają się do tego, że popioły lotne mają różnorakie wła-ściwości, co ma istotne znaczenie do ich ponownego wykorzystania w przemyśle. Obecnie popioły są wy-korzystywane na szeroką skalę w przemyśle cemen-towym, drogownictwie, ceramice, rolnictwie czy też w przemyśle tworzyw i farb [6-8].
Najpowszechniejszym i najważniejszym dodatkiem hydraulicznym stosowanym w produkcji cementu jest granulowany żużel wielkopiecowy. Mimo tego że jest to odpad, znajduje on zastosowanie również w produkcji zapraw murarskich, cegieł żużlowych, jak również jako materiał do budowy dróg i auto-strad. Granulowany żużel wielkopiecowy był jednym z pierwszych surowców wtórnych stosowanych pod-czas produkcji szkło-ceramika [9].
116
THE POSSIBILITY OF THE USE OF SECONDARY RAW MATERIALS FROM ENERGY AND IRON&STEEL INDUSTRIES FOR GLASS-CERAMICS ...
2. PRODUCTION OF GLASS-CERAMICS MATERIALGlass-ceramics material was discovered in 1953.
It is polycrystalline material obtained by controlled crystallization, which results in formation of a material with very favourable mechanical, chemical and thermal properties [3].
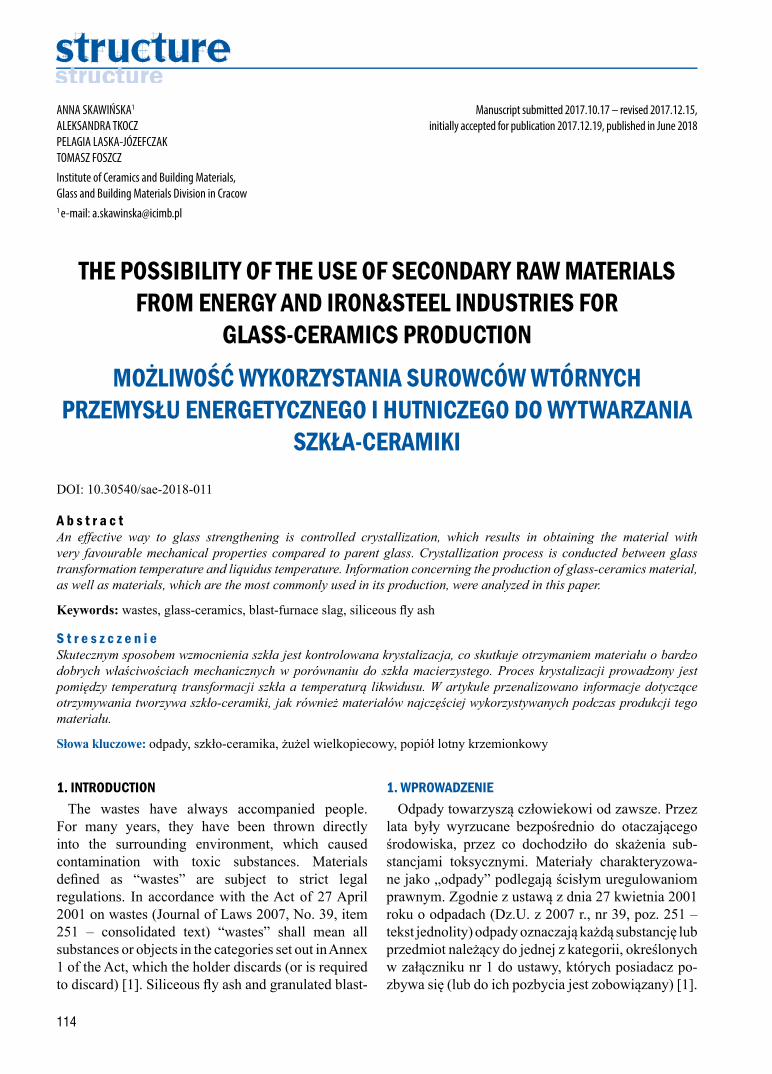
Glass devitrification is heterogeneous transformation, which consists of two stages: nucleation stage and crystallization stage (Fig. 1). Nucleation stage involves material heating to the maximum nucleation temperature, and then its holding in furnace by specified time. During nucleation stage, small, stable crystalline products are formed in positions previously occupied by parent glass or free spaces. The latter are usually undesirable, because large oriented crystals, which are formed, are detrimental to mechanical properties of glass-ceramics material. Nucleation stage ends when stable nucleus has been formed and the crystals growth has been occured, thus the movement of atoms/molecules from the glass, across the glass-crystal interface, and into the crystal. Then, temperature increases to TG. Nucleation (TN) and crystallization temperatures (TG) are determined on the basis of differential thermal analysis – DTA [3].
Glass-ceramics material is not fully crystalline – typical microstructure of glass-ceramics consists of crystalline products from 55% to 95%, while the rest is residual glass. One or more phases are formed during controlled crystallization. The quantity and also the type of formed phases mainly depend on composition of parent glass and used reaction accelerators [3].
W Polsce wzmocnienie szkła przez kierowaną kry-stalizację nie jest wykorzystywane na szeroką skalę, dlatego w artykule skupiono się nad możliwością wykorzystania wyżej wymienionych surowców wtór-nych w produkcji szkło-ceramika.
2. OTRZYMYWANIE MATERIAŁU SZKŁO-CERAMIKATworzywo szkło-ceramika zostało odkryte w 1953
roku. Jest to materiał polikrystaliczny, otrzymywany przez kierowaną krystalizację, która prowadzi do otrzy-mania tworzywa o bardzo dobrych właściwościach me-chanicznych, chemicznych i termicznych [3].
Dewitryfikacja szkła jest reakcją heterogeniczną, któ-ra przebiega w dwóch etapach: zarodkowanie (nukle-acja) oraz krystalizacja (rys. 1). Etap nukleacji polega na wygrzewaniu materiału do maksymalnej tempera-tury zarodkowania, a następnie przebywaniu materiału przez określony czas w piecu. Podczas zarodkowania powstają niewielkie, stabilne produkty krystaliczne w miejscach szkła macierzystego lub w wolnych przestrzeniach. Te ostatnie są zwykle niepożądane, ponieważ powstające duże zorientowane kryształy wpływają na pogorszenie właściwości mechanicznych tworzywa szkło-ceramika. Etap zarodkowania koń-czy się, gdy powstanie stabilne jądro oraz dojdzie do wzrostu kryształów, czyli ruchu atomów/molekuł ze szkła przez powierzchnię międzyfazową do kryształu. Następnie ma miejsce wzrost temperatury do TG. Tem-peraturę zarodkowania (TN) oraz krystalizacji (TG) wy-znacza się na podstawie analizy termicznej DTA [3].
Fig. 1. Glass crystallization results in glass-ceramics formation [3]Rys. 1. Krystalizacja szkła prowadząca do otrzymania szkła-ceramiki [3]

117
MOŻLIWOŚĆ WYKORZYSTANIA SUROWCÓW WTÓRNYCH PRZEMYSŁU ENERGETYCZNEGO I HUTNICZEGO DO WYTWARZANIA ...
3. WASTE MATERIALS USED DURING GLASS-CERAMICS PRODUCTION
Many papers presenting various examples of the use of secondary raw materials for glass-ceramics production are available. It is important that such secondary raw materials contain alkali oxides (Na2O, K2O) and minor oxides (e.g. TiO2). The occurrence of these oxides affects, for example, the reduction of temperature of glass formation. It should be underlined that properties of glass-ceramics material depend on recrystallization degree, microstructure and properties of glassy phase remaining in the material.
There are several basic reasons for the utilization and re-use of secondary raw materials in the production of glass-ceramic material. One of them concerns the reduction of costs of secondary raw materials removal, the second is associated with minimizing of the use of natural resources, and the other one concerns the possibility of obtaining the material with better physical or mechanical properties compared to the material without waste materials [3-10].
The use of granulated blast-furnace slag and siliceous fly ash for glass-ceramics production is described in this paper.
3.1. Granulated blast-furnace slagMetallurgical slag is one of the most differential
secondary raw materials. Chemical composition of granulated blast-furnace slag is changeable and depends on the type of raw material used in a given metallurgical process. Complex nature of raw material depends on chemical composition of final product and waste material formed at the same time. Exemplary chemical composition and microstructure of blast-furnace slag are presented in Table 1 and Figure 2.
Chemical composition [%]
L.O.I. 0.02
SiO2 40.39
Al2O3 7.77
Fe2O3 0.99
CaO 43.69
MgO 3.77
Na2O 0.53
K2O 0.54
TiO2 0.33
P2O5 0.02
SO3 1.62
Mn2O3 0.29
SrO 0.04
Tworzywo szkło-ceramika nie jest w pełni mate-riałem krystalicznym – typowa mikrostruktura szkło--ceramika to od 55% do 95% produkty krystaliczne, zaś resztę stanowi szkło szczątkowe. Podczas kon-trolowanej krystalizacji powstaje jedna bądź więcej faz. Ilość, jak również rodzaj powstających faz zależy głównie od składu szkła wyjściowego oraz użytych katalizatorów reakcji [3].
3. MATERIAŁY ODPADOWE STOSOWANE PODCZAS PRODUKCJI SZKŁO-CERAMIKA
W literaturze można znaleźć wiele przykładów wy-korzystania surowców wtórnych przy produkcji szkła--ceramiki. Ważne jest to, aby takie surowce zawierały tlenki alkaliów (Na2O, K2O) oraz tlenki akcesoryczne (np. TiO2). Obecność tych tlenków wpływa między innymi na obniżenie temperatury powstawania szkła. Należy w tym miejscu zaznaczyć, że na właściwości tworzywa szkło-ceramicznego wpływać będzie sto-pień przekrystalizowania, mikrostruktura oraz właści-wości pozostałej w materiale fazy szklistej.
Istnieje kilka zasadniczych przesłanek za utyliza-cją i ponownym wykorzystaniem surowców wtórnych w produkcji tworzywa szkło-ceramicznego. Jeden z nich dotyczy zmniejszenia kosztów usuwania su-rowców wtórnych, drugi odnosi się do zminimalizo-wania wykorzystania surowców naturalnych, zaś ko-lejny do możliwości uzyskania materiału o lepszych właściwościach fizycznych bądź mechanicznych, w porównaniu do tworzywa bez dodatku surowców odpadowych [3-10].
W niniejszym artykule zostanie omówione wyko-rzystanie granulowanego żużla wielkopiecowego oraz popiołów lotnych krzemionkowych do produk-cji szkło-ceramika.
3.1. Granulowany żużel wielkopiecowyŻużle hutnicze stanowią jeden z najbardziej zróż-
nicowanych surowców wtórnych. Skład chemiczny granulowanego żużla wielkopiecowego jest zmienny i zależy od rodzaju materiału wsadowego stosowane-go w danym procesie hutniczym. Złożony charakter materiału wsadowego wpływa na skład chemiczny produktu końcowego oraz powstającego równolegle
Table 1. Chemical composition of granulated blast-furnace slag. Source: own elaborationTabela 1. Skład chemiczny granulowanego żużla wielko-piecowego. Źródło: opracowanie własne
118
THE POSSIBILITY OF THE USE OF SECONDARY RAW MATERIALS FROM ENERGY AND IRON&STEEL INDUSTRIES FOR GLASS-CERAMICS ...
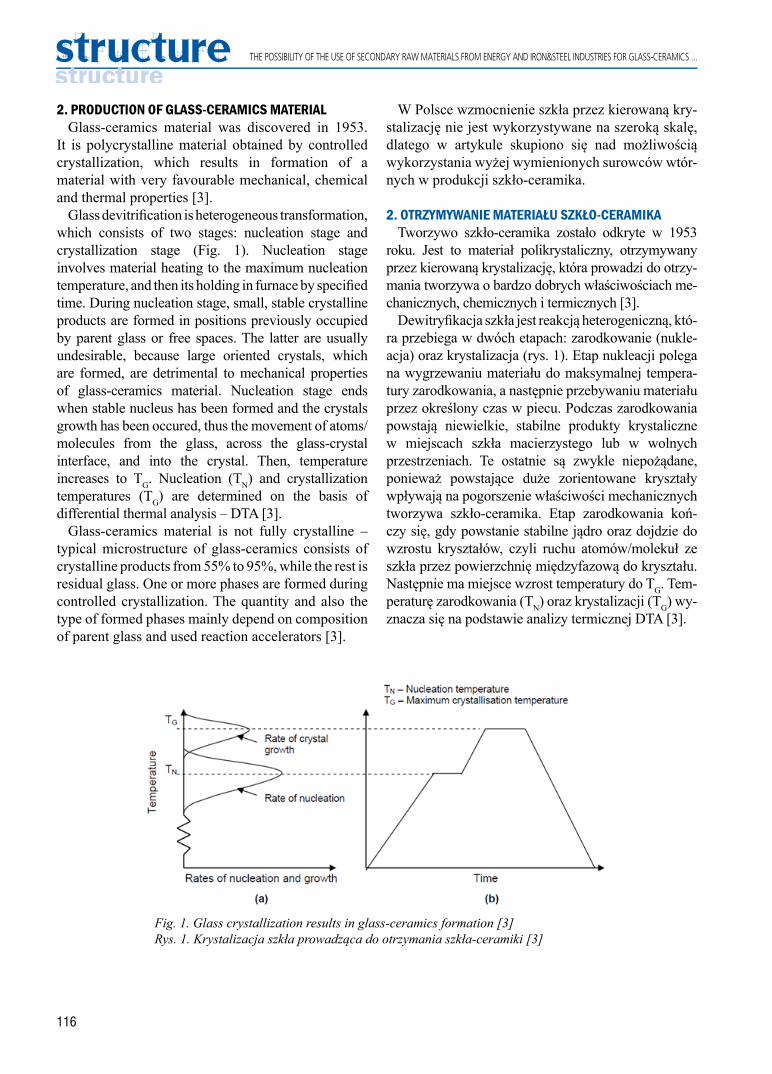
Granulated blast-furnace slag was the first waste material used in glass-ceramics production in 1960, known as „Slagceram”. Slag mainly consists of such oxides as CaO, SiO2, Al2O3 and MgO, the rest are oxides occuring in small amounts. Small content of titanium oxide has a beneficial effect of the first stage of controlled crystallization, thus nucleation, which includes the entire volume. In the case of absence of TiO2 the crystallization proceeds only on the surface. Nucleation temperature of slag is about 725ºC, and crystallization temperature is 950-1100ºC. The crystallization is not completed below 950ºC. Small amounts of gehlenite (Ca2Al2SiO7) and merwinite [Ca3Mg(SiO4)2] are observed as final product. In the case of titanium oxide addition from 2% to 5%, melilites containing gehlenite and akermanite (Ca2MgSi2O7) are observed [3, 9, 11].
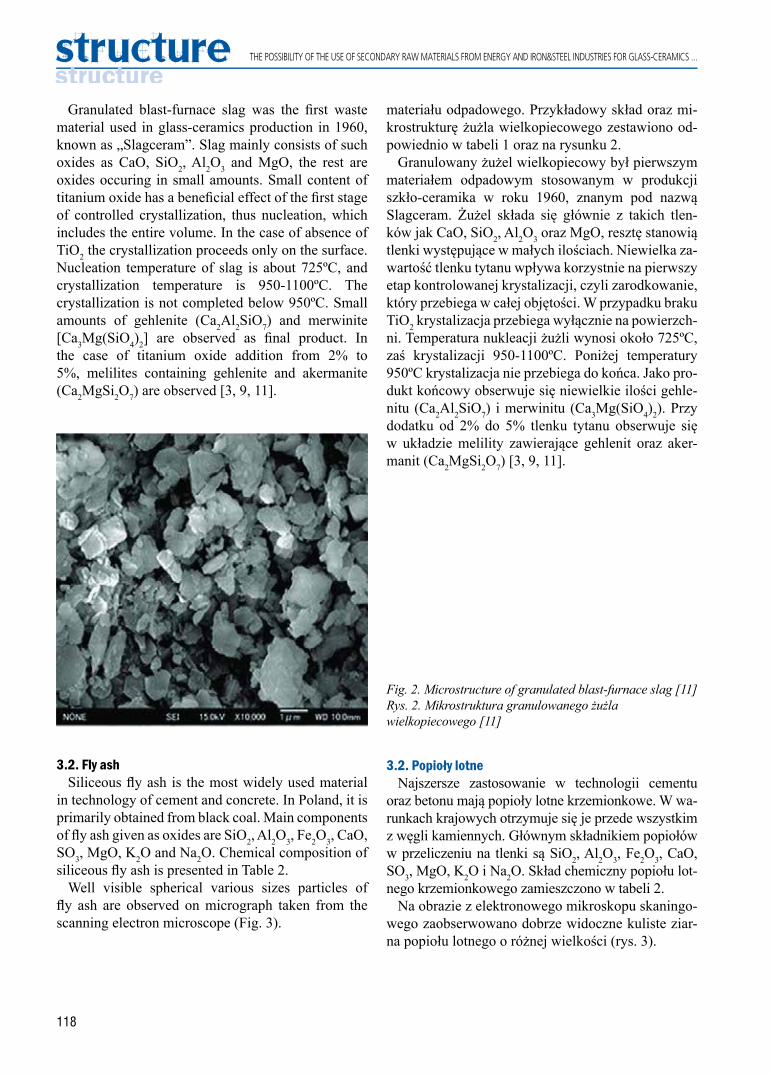
3.2. Fly ash Siliceous fly ash is the most widely used material
in technology of cement and concrete. In Poland, it is primarily obtained from black coal. Main components of fly ash given as oxides are SiO2, Al2O3, Fe2O3, CaO, SO3, MgO, K2O and Na2O. Chemical composition of siliceous fly ash is presented in Table 2.
Well visible spherical various sizes particles of fly ash are observed on micrograph taken from the scanning electron microscope (Fig. 3).
materiału odpadowego. Przykładowy skład oraz mi-krostrukturę żużla wielkopiecowego zestawiono od-powiednio w tabeli 1 oraz na rysunku 2.
Granulowany żużel wielkopiecowy był pierwszym materiałem odpadowym stosowanym w produkcji szkło-ceramika w roku 1960, znanym pod nazwą Slagceram. Żużel składa się głównie z takich tlen-ków jak CaO, SiO2, Al2O3 oraz MgO, resztę stanowią tlenki występujące w małych ilościach. Niewielka za-wartość tlenku tytanu wpływa korzystnie na pierwszy etap kontrolowanej krystalizacji, czyli zarodkowanie, który przebiega w całej objętości. W przypadku braku TiO2 krystalizacja przebiega wyłącznie na powierzch-ni. Temperatura nukleacji żużli wynosi około 725ºC, zaś krystalizacji 950-1100ºC. Poniżej temperatury 950ºC krystalizacja nie przebiega do końca. Jako pro-dukt końcowy obserwuje się niewielkie ilości gehle-nitu (Ca2Al2SiO7) i merwinitu (Ca3Mg(SiO4)2). Przy dodatku od 2% do 5% tlenku tytanu obserwuje się w układzie melility zawierające gehlenit oraz aker-manit (Ca2MgSi2O7) [3, 9, 11].
Fig. 2. Microstructure of granulated blast-furnace slag [11]Rys. 2. Mikrostruktura granulowanego żużla wielkopiecowego [11]
3.2. Popioły lotne Najszersze zastosowanie w technologii cementu
oraz betonu mają popioły lotne krzemionkowe. W wa-runkach krajowych otrzymuje się je przede wszystkim z węgli kamiennych. Głównym składnikiem popiołów w przeliczeniu na tlenki są SiO2, Al2O3, Fe2O3, CaO, SO3, MgO, K2O i Na2O. Skład chemiczny popiołu lot-nego krzemionkowego zamieszczono w tabeli 2.
Na obrazie z elektronowego mikroskopu skaningo-wego zaobserwowano dobrze widoczne kuliste ziar-na popiołu lotnego o różnej wielkości (rys. 3).

119
MOŻLIWOŚĆ WYKORZYSTANIA SUROWCÓW WTÓRNYCH PRZEMYSŁU ENERGETYCZNEGO I HUTNICZEGO DO WYTWARZANIA ...
Chemical composition [%]
L.O.I. 2.44
SiO2 49.57
Al2O3 27.96
Fe2O3 9.03
CaO 3.21
MgO 2.09
Na2O 1.42
K2O 2.59
TiO2 1.19
ZnO 0.05
SO3 0.03
P2O5 0.31
Mn2O3 0.06
SrO 0.05
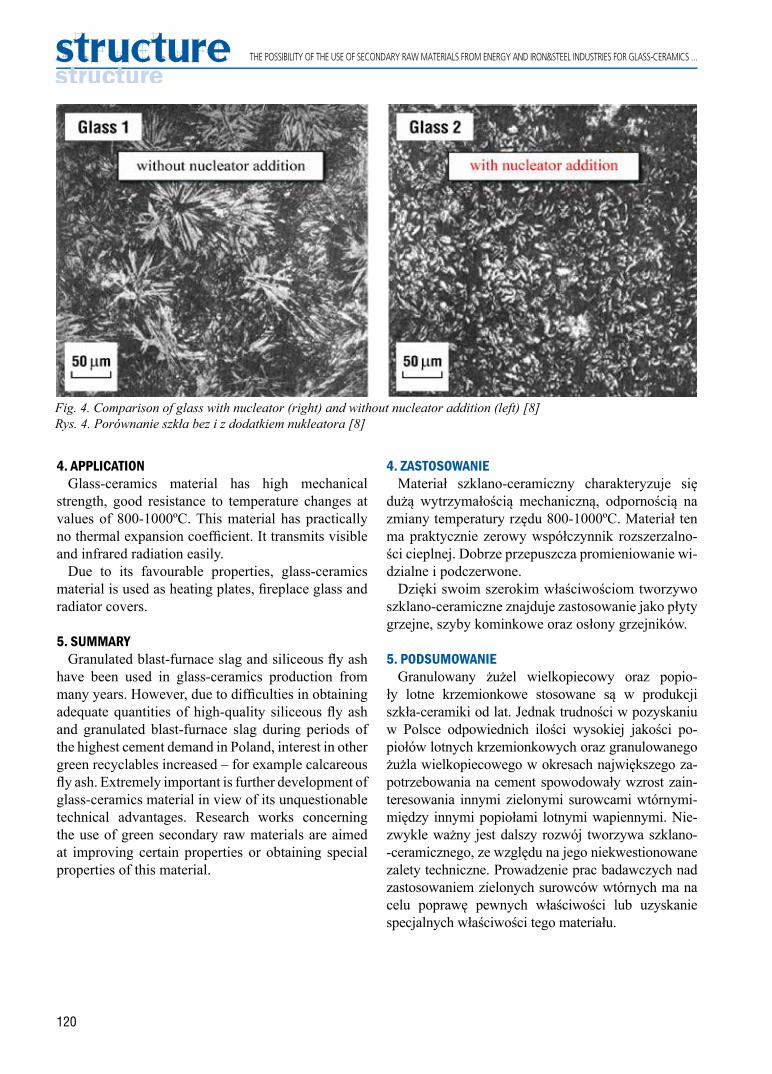
The first attempts to produce glass-ceramics from fly ash were taken in the 1980s by DeGuire and Risbud. Siliceous fly ash was melted at temperature of 1500ºC, and then controlled crystallization was conducted at temperature of 650-700ºC and 1000ºC, respectively for 2 and 5 hours. As the authors have observed, content of crystalline products was low (about 25%), which they attributed to the limited amount of TiO2 as a factor facilitating nucleation (heterogeneous nucleation). Cumposton et al., by using 20% of CaCO3 and TiO2 as nucleators, have obtained material with content of crystalline products over 40%, in which anorthite Ca[Al2Si2O8] was the main phase. Additionally, the occurrence of calcium carbonate influenced the decrease of viscosity and glass melting temperature by 100ºC (1400ºC). Small TiO2 addition influences the microstructure change, as well as the reduction of temperature of glass devitrification (Fig. 4) [3, 4, 6-8, 10].
Table 2. Chemical composition of siliceous fly ash. Source: own elaborationTabela 2. Skład chemiczny popiołu lotnego krzemionkowego. Źródło: opracowanie własne
Pierwsze próby otrzymania szkła-ceramiki z po-piołów zostały podjęte w latach 80. przez DeGuire i Risbuda. Popioły lotne krzemionkowe zostały sto-pione w temperaturze 1500ºC, a następnie poddane kontrolowanej krystalizacji w temperaturze 650-700ºC oraz 1000ºC, odpowiednio przez 2 i 5 godzin. Jak zauważyli autorzy, zawartość produktów kry-stalicznych była mała (około 25%), co przypisywali ograniczonej ilości TiO2 jako czynnika ułatwiającego zarodkowanie (nukleacja heterogeniczna). Cumpo-ston i inni, przy użyciu 20% CaCO3 oraz TiO2 jako nukleatorów, otrzymali ponad 40% zawartość pro-duktów krystalicznych, w której główną fazą był anortyt Ca[Al2Si2O8]. Dodatkowo obecność węglanu wapnia wpłynęła na obniżenie lepkości oraz tempe-ratury topnienia szkła o 100ºC (1400ºC). Niewiel-ki dodatek TiO2 wpływa na zmianę mikrostruktury, jak również na obniżenie temperatury dewitryfikacji szkła (rys. 4) [3, 4, 6-8, 10].
Fig. 3. Microstructure of siliceous fly ash [12]Rys. 3. Mikrostruktura popiołu lotnego krzemionkowego [12]
120
THE POSSIBILITY OF THE USE OF SECONDARY RAW MATERIALS FROM ENERGY AND IRON&STEEL INDUSTRIES FOR GLASS-CERAMICS ...
4. ZASTOSOWANIEMateriał szklano-ceramiczny charakteryzuje się
dużą wytrzymałością mechaniczną, odpornością na zmiany temperatury rzędu 800-1000ºC. Materiał ten ma praktycznie zerowy współczynnik rozszerzalno-ści cieplnej. Dobrze przepuszcza promieniowanie wi-dzialne i podczerwone.
Dzięki swoim szerokim właściwościom tworzywo szklano-ceramiczne znajduje zastosowanie jako płyty grzejne, szyby kominkowe oraz osłony grzejników.
5. PODSUMOWANIE Granulowany żużel wielkopiecowy oraz popio-
ły lotne krzemionkowe stosowane są w produkcji szkła-ceramiki od lat. Jednak trudności w pozyskaniu w Polsce odpowiednich ilości wysokiej jakości po-piołów lotnych krzemionkowych oraz granulowanego żużla wielkopiecowego w okresach największego za-potrzebowania na cement spowodowały wzrost zain-teresowania innymi zielonymi surowcami wtórnymi- między innymi popiołami lotnymi wapiennymi. Nie-zwykle ważny jest dalszy rozwój tworzywa szklano--ceramicznego, ze względu na jego niekwestionowane zalety techniczne. Prowadzenie prac badawczych nad zastosowaniem zielonych surowców wtórnych ma na celu poprawę pewnych właściwości lub uzyskanie specjalnych właściwości tego materiału.
4. APPLICATIONGlass-ceramics material has high mechanical
strength, good resistance to temperature changes at values of 800-1000ºC. This material has practically no thermal expansion coefficient. It transmits visible and infrared radiation easily.
Due to its favourable properties, glass-ceramics material is used as heating plates, fireplace glass and radiator covers.
5. SUMMARY Granulated blast-furnace slag and siliceous fly ash
have been used in glass-ceramics production from many years. However, due to difficulties in obtaining adequate quantities of high-quality siliceous fly ash and granulated blast-furnace slag during periods of the highest cement demand in Poland, interest in other green recyclables increased – for example calcareous fly ash. Extremely important is further development of glass-ceramics material in view of its unquestionable technical advantages. Research works concerning the use of green secondary raw materials are aimed at improving certain properties or obtaining special properties of this material.
Fig. 4. Comparison of glass with nucleator (right) and without nucleator addition (left) [8]Rys. 4. Porównanie szkła bez i z dodatkiem nukleatora [8]
121
MOŻLIWOŚĆ WYKORZYSTANIA SUROWCÓW WTÓRNYCH PRZEMYSŁU ENERGETYCZNEGO I HUTNICZEGO DO WYTWARZANIA ...
References [1] Dziennik Ustaw z 2007, nr 39, poz. 251. [2] Rozporządzenie (WE) Nr 1013/2006 Parlamentu Europejskiego i Rady z dnia 14 czerwca 2006. www.eurlex.europa.
eu w sprawie przemieszczania odpadów, odwiedzono 25.10.2017 r. [3] Rawlings R.D., Wu J.P., Boccaccini A.R., Glass-ceramics: Their production from wastes- A Review, Journal of
Materials Science, vol. 41, Issue 3, 2006, 733-761. [4] Erol M., Küҫükbayrak, Ersoy-Meriҫboyu A., Production of glass-ceramics obtained from industrial wastes by means
of controlled nucleation and crystallization, Chemical Engineering Journal 132, 2007, 335-343. [5] Zanotto E.D., A bright future for glass-ceramics, The American Ceramic Society Bulletin 89, 8, 2010, 19-27. [6] Erol M., Genҫ A., Ӧveҫoĝlu M.L., Yücelen E., Küҫükbayrak, Taptık Y., Characterization of a glass-ceramic
produced from thermal power plant fly ashes, Journal of European Ceramic Society 20, 2000, 2209-2214. [7] Leroy C., Ferro M.C., Monteiro R.C.C, Fernandes M.H.V., Production of glass-ceramics from coal ashes, Journal of
European Ceramic Society 21, 2001, 195-202. [8] Bernardo E., Castellan R., Hreglich S., Sintered glass-ceramics from mixtures of wastes, Ceramics International 33,
2007, 27-33. [9] Liu H., Lu H., Chen D., Wang H., Xu H., Zhang R., Preparation and properties of glass-ceramics derived from blast-
furnace slag by a ceramic-sintering process, Ceramics International 35, 2009, 3181-3184.[10] Peng F., Liang K., Hu A., Nano-crystal glass-ceramics obtained from high alumina coal fly ash, Fuel 84, 2005,
341-346.[11] Khan S.U., Nuruddin M.F., Ayub T., Shafiq N., Effects of Different Mineral Admixtures on the Properties of Fresh
Concrete, The Scientific World Journal, 2014, 1-11. [12] Chaipanich A., Nochaiya T., Wongkeo W., Torkittikul P., Compressive strength and microstructure of carbon
nanotubes–fly ash cement composites, Materials Science and Engineering A 527, 2010, 1063-1067.
Podziękowania:Praca finansowana przez Ministerstwo Nauki i Szkolnictwa Wyższego, praca statutowa nr 3NS11K17 – Instytut Ceramiki i Materiałów Budowlanych Oddział Szkła i Materiałów Budowlanych w Krakowie
Acknowledgments:This work was supported by Ministry of Science and Higher Education, Grant No. 3NS11K17 – Institute of Ceramics and Building Materials, Glass and Building Materials Division in Cracow
122
1. INTRODUCTIONRussia is a northern country with long winters,
low below-zero temperatures, harsh winds, snow falls and snowstorms. Hence, it has a vast experience successfully preventing and removing snow drifts from auto roads. In recent years, however, it has become clear that all this is no longer enough: the main auto roads equipped with powerful snow removing systems and protection means against snow drifts witness prolonged many kilometers long traffic jams caused by snow drifts on the traffic bearing part of auto roads. This means that old, tried-and-true methods and ways do not suffice any more. Why is it?
2. THEORETICAL ANALYSISPresence of cars on the traffic-bearing surface of the
road affects snow relocation over the road drastically. Most diagrams describing wind-blown snow stream
MICHAIL VASILEVICH NEMCHINOV
ANNA GENNADIEVNA IVANOVA1
Moscow Automobile and Road Construction State Technical University (MADI)1 e-mail: [email protected]
SNOWDRIFT EXTENT ON MOTORWAYS WITH BUSY TRAFFICZASIĘG POKRYWY ŚNIEŻNEJ NA AUTOSTRADACH
O DUŻYM NATĘŻENIU RUCHUDOI: 10.30540/sae-2018-012
Manuscript submitted 2018.01.16 – revised 2018.03.08, initially accepted for publication 2018.03.23, published in June 2018
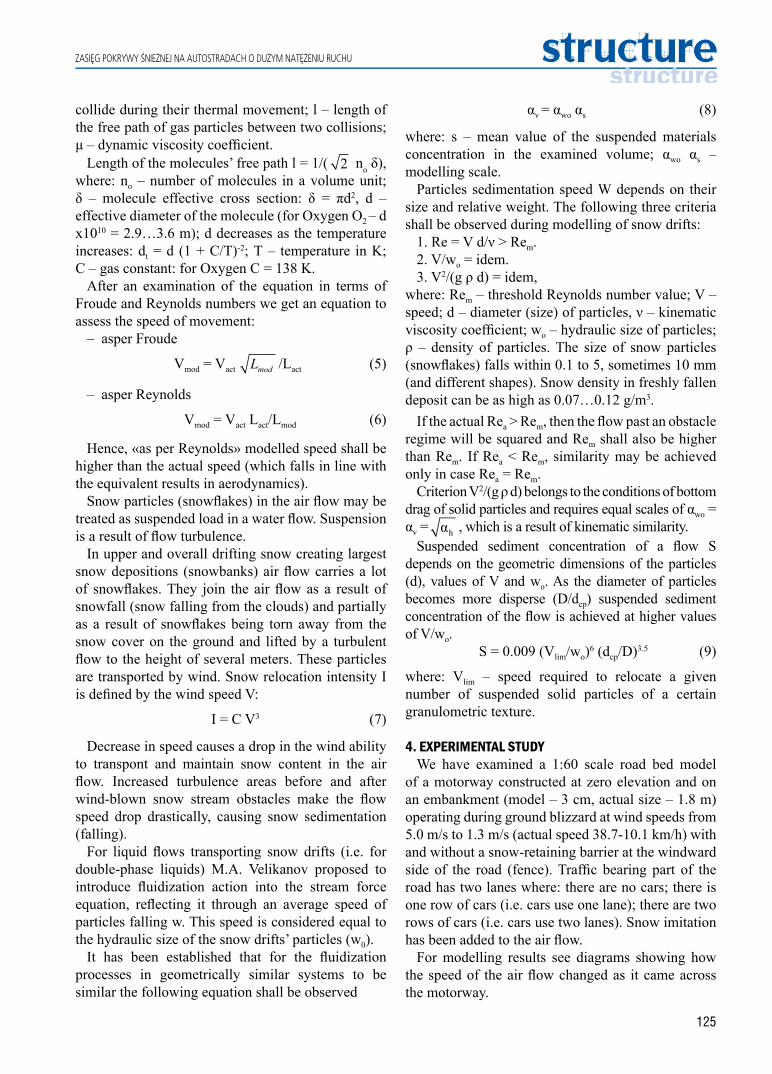
A b s t r a c tThe paper examines the problem of snow-drafts on roads and ways of mitigating them. The results of theoretical analyses of development of snow-drafts and experimental investigations with road models are presented. Authors examined low and high blowing snows with different wind velocities, roads with road bed at terrain elevation and situated on an embankment, with and without snow protective facilities and with variable amount of traffic. Based on the conducted analyses a set of recommendations for snow protection of roads are provided.
Keywords: snow-drift, snow-fall, wind velocity, snow-protection, snow removal, roadway, car, traffic, model, experiment
S t r e s z c z e n i eW artykule dokonano analizy problemu występowania zaśnieżania dróg oraz opisano sposoby ich ochrony przed tym zjawiskiem. Przedstawiono także wyniki analizy teoretycznej przyczyn zaśnieżania dróg oraz wyniki badań eksperymentalnych z wykorzystaniem modeli dróg. Badano wpływ małych i dużych opadów śniegu występujących przy różnej prędkości wiatru na drogę usytuowaną w poziomie terenu (zero niwelety) i na nasypie, z uwzględnieniem wpływu obecności zasłon przeciwśnieżnych oraz niewielkiego ruchu pojazdów Na podstawie wykonanych analiz sformułowano zalecenia dotyczące ochrony drogi przed opadami śniegu.
Słowa kluczowe: zaspy śnieżne, opady śniegu, prędkość wiatru, ochrona przed śniegiem, odśnieżanie, jezdnia, samochód, ruch drogowy, model, eksperyment
coming across road bed of the motorways and snow-retaining barriers along the roads work for the cases when there is no traffic on the road [5-10]. Hardly any diagram features a car. Safety barriers are also predominantly absent. That was true at times when traffic was small. Nowadays, however, the conditions have changed drastically – even local roads in winter have relatively busy car traffic. Taking into account fast-paced motorization of the society we can expect further increase in traffic. This feature – lack or presence of a car, several raws of cars on the traffic-bearing surface of the road – changes the aerodynamic system on the road bed drastically and therefore changes blowing snow accumulation. A car on the road, safety barriers on the road shoulders (mandatory for embankments 2 and more m high), on motorways in the centre of the road bed – all of them obstruct wind-blown snow stream with the expected results.
123
ZASIĘG POKRYWY ŚNIEŻNEJ NA AUTOSTRADACH O DUŻYM NATĘŻENIU RUCHU
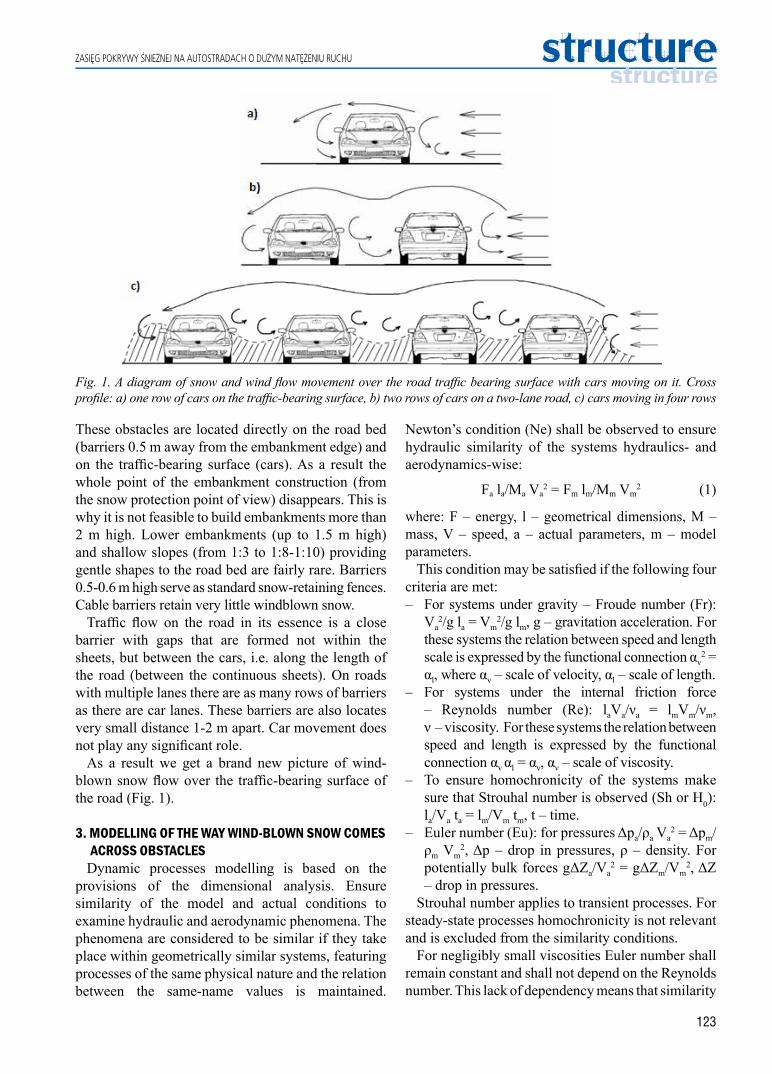
These obstacles are located directly on the road bed (barriers 0.5 m away from the embankment edge) and on the traffic-bearing surface (cars). As a result the whole point of the embankment construction (from the snow protection point of view) disappears. This is why it is not feasible to build embankments more than 2 m high. Lower embankments (up to 1.5 m high) and shallow slopes (from 1:3 to 1:8-1:10) providing gentle shapes to the road bed are fairly rare. Barriers 0.5-0.6 m high serve as standard snow-retaining fences. Cable barriers retain very little windblown snow.
Traffic flow on the road in its essence is a close barrier with gaps that are formed not within the sheets, but between the cars, i.e. along the length of the road (between the continuous sheets). On roads with multiple lanes there are as many rows of barriers as there are car lanes. These barriers are also locates very small distance 1-2 m apart. Car movement does not play any significant role.
As a result we get a brand new picture of wind-blown snow flow over the traffic-bearing surface of the road (Fig. 1).
3. MODELLING OF THE WAY WIND-BLOWN SNOW COMES ACROSS OBSTACLES
Dynamic processes modelling is based on the provisions of the dimensional analysis. Ensure similarity of the model and actual conditions to examine hydraulic and aerodynamic phenomena. The phenomena are considered to be similar if they take place within geometrically similar systems, featuring processes of the same physical nature and the relation between the same-name values is maintained.
Newton’s condition (Ne) shall be observed to ensure hydraulic similarity of the systems hydraulics- and aerodynamics-wise:
Fa la/Ma Va2 = Fm lm/Mm Vm
2 (1)
where: F – energy, l – geometrical dimensions, M – mass, V – speed, a – actual parameters, m – model parameters.
This condition may be satisfied if the following four criteria are met:– For systems under gravity – Froude number (Fr):
Va2/g la = Vm
2/g lm, g – gravitation acceleration. For these systems the relation between speed and length scale is expressed by the functional connection αv
2 = αl, where αv – scale of velocity, αl – scale of length.
– For systems under the internal friction force – Reynolds number (Re): laVa/νa = lmVm/νm, ν – viscosity. For these systems the relation between speed and length is expressed by the functional connection αv αl = αν, αν – scale of viscosity.
– To ensure homochronicity of the systems make sure that Strouhal number is observed (Sh or H0): la/Va ta = lm/Vm tm, t – time.
– Euler number (Eu): for pressures Δpa/ρa Va2 = Δpm/
ρm Vm2, Δp – drop in pressures, ρ – density. For
potentially bulk forces gΔZa/Va2 = gΔZm/Vm
2, ΔZ – drop in pressures.
Strouhal number applies to transient processes. For steady-state processes homochronicity is not relevant and is excluded from the similarity conditions.
For negligibly small viscosities Euler number shall remain constant and shall not depend on the Reynolds number. This lack of dependency means that similarity
Fig. 1. A diagram of snow and wind flow movement over the road traffic bearing surface with cars moving on it. Cross profile: а) one row of cars on the traffic-bearing surface, b) two rows of cars on a two-lane road, c) cars moving in four rows
124
SNOWDRIFT EXTENT ON MOTORWAYS WITH BUSY TRAFFIC
in this case is established automatically provided similarity condition and geometrical similarity of the systems are observed. The main indication that the systems are similar is the equality of the resistance factors of the model and actual flows.
Years-long practice of modelling hydraulic and aerodynamic processes shows that all similarity criteria cannot be achieved simultaneously. This is why we will examine the listed criteria in relation to the examined scenario and will chose the most determinant one.
In this case we are examining a set air flow regime (hence, Strouhal number is excluded from the similarity conditions). Wind-blown snow viscosity is negligibly small, which means that Euler number does not depend on Reynolds number. So Euler number may also be excluded from the similarity condition.
Reynolds number reflects the effect of inner friction forces (i.e. viscosity of the moving medium) on the dynamic process. For wind-blown snow stream air flow friction against ground surface free from any obstacles shall be evaluated in different ways: for ground blizzards (low drifting snow) it is quite high as it tears snow particles away from the snow cover and relocates them (movement by saltation); for upper drifting snow it is low, as the snow mainly enters air flow through snowfall. In case there are obstacles (bushes, trees, fences, etc.) the friction increases sharply which affects dynamics and travel time characteristics of the air (wind-blown snow stream) flow. Cars on the traffic bearing surface of the road also serve as considerable obstacles generating the flow. This is why Reynolds number shall be taken into consideration during modelling of blizzards on the roads.
Froude number which reflects gravity effects and therefore snow sedimentation and snowbanks formation shall also be taken into account during modelling of snowdrifts.
Hence, the analysis has showed that there are two primary similarity criteria: Reynolds number (reflecting travel time characteristics of the flow) and Froude number (reflecting the turbulence of the flow and flow particles settling). However the correlation of modelling scales for these criteria and geometrical scale (mandatory for each case) is different:
– as per Froude αv = αl,– as per Reynolds αv αl = αν.Same similarity criteria are also used in aerodynamics:
Froude number, Reynolds number Fr = V2∞/L g,
Re = L V∞/ν (2)
For example, for airborne vehicles actual drag “X” and model drag are connected through an equation Хa = Хm сa qa Sa/сm qm Sm, where: с – drag factor; q – velocity head pressure (V2/2g); S – reference area. Main parameters of the oncoming flow are: speed (V∞), pressure (p∞), density (ρ∞), temperature (Т∞), dynamic viscosity coefficient (μ∞) or kinematic viscosity coefficient (ν∞).
For aerodynamic processes like an air vehicle air flow Froude number is fairly insignificant as the effect of gas weight on the motion is negligibly small. However, for wind-blown snow stream with a large number of snow particles this criterion is as important as it is in hydrodynamics.
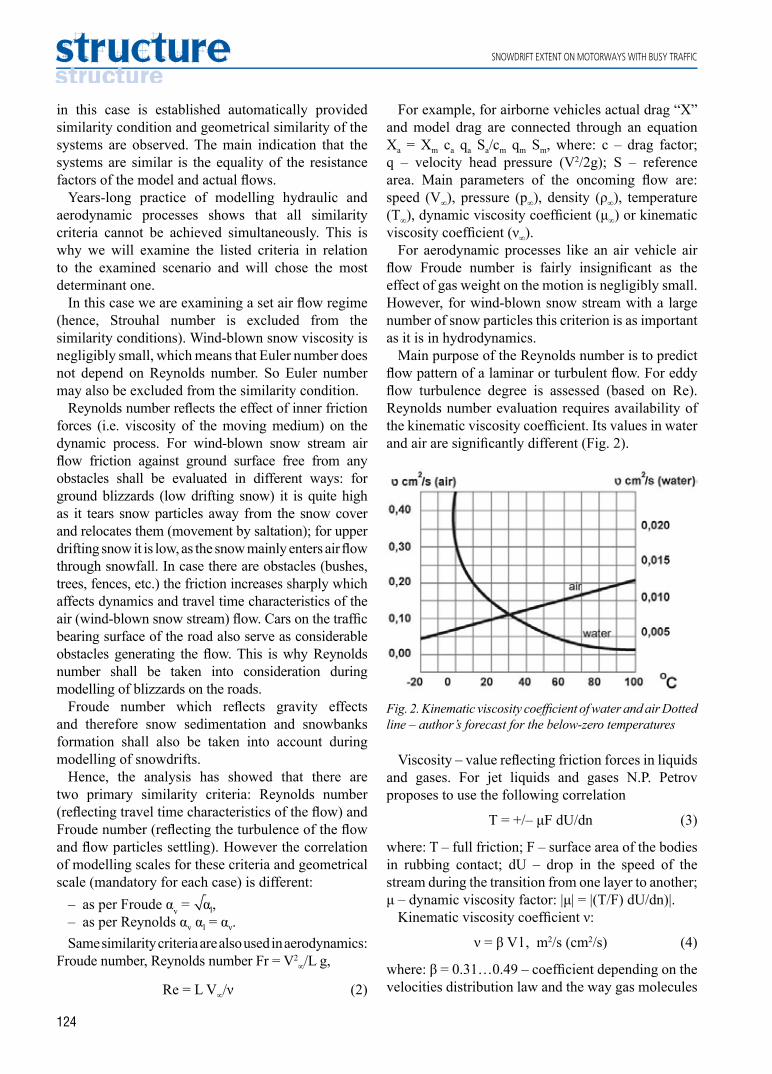
Main purpose of the Reynolds number is to predict flow pattern of a laminar or turbulent flow. For eddy flow turbulence degree is assessed (based on Re). Reynolds number evaluation requires availability of the kinematic viscosity coefficient. Its values in water and air are significantly different (Fig. 2).
Fig. 2. Kinematic viscosity coefficient of water and air Dotted line – author’s forecast for the below-zero temperatures
Viscosity – value reflecting friction forces in liquids and gases. For jet liquids and gases N.P. Petrov proposes to use the following correlation
Т = +/– μF dU/dn (3)
where: T – full friction; F – surface area of the bodies in rubbing contact; dU – drop in the speed of the stream during the transition from one layer to another; μ – dynamic viscosity factor: |μ| = |(Т/F) dU/dn)|.
Kinematic viscosity coefficient ν:
ν = β V l , m2/s (cm2/s) (4)
where: β = 0.31…0.49 – coefficient depending on the velocities distribution law and the way gas molecules
125
ZASIĘG POKRYWY ŚNIEŻNEJ NA AUTOSTRADACH O DUŻYM NATĘŻENIU RUCHU
collide during their thermal movement; l – length of the free path of gas particles between two collisions; μ – dynamic viscosity coefficient.
Length of the molecules’ free path l = 1/( 2 no δ), where: no – number of molecules in a volume unit; δ – molecule effective cross section: δ = πd2, d – effective diameter of the molecule (for Oxygen О2 – d х1010 = 2.9…3.6 m); d decreases as the temperature increases: dt = d (1 + C/T)-2; Т – temperature in K; С – gas constant: for Oxygen С = 138 K.
After an examination of the equation in terms of Froude and Reynolds numbers we get an equation to assess the speed of movement:
– asper Froude
Vmod = Vact modL /Lact (5)
– asper Reynolds
Vmod = Vact Lact/Lmod (6)
Hence, «as per Reynolds» modelled speed shall be higher than the actual speed (which falls in line with the equivalent results in aerodynamics).
Snow particles (snowflakes) in the air flow may be treated as suspended load in a water flow. Suspension is a result of flow turbulence.
In upper and overall drifting snow creating largest snow depositions (snowbanks) air flow carries a lot of snowflakes. They join the air flow as a result of snowfall (snow falling from the clouds) and partially as a result of snowflakes being torn away from the snow cover on the ground and lifted by a turbulent flow to the height of several meters. These particles are transported by wind. Snow relocation intensity I is defined by the wind speed V:
I = C V3 (7)
Decrease in speed causes a drop in the wind ability to transpont and maintain snow content in the air flow. Increased turbulence areas before and after wind-blown snow stream obstacles make the flow speed drop drastically, causing snow sedimentation (falling).
For liquid flows transporting snow drifts (i.e. for double-phase liquids) M.А. Velikanov proposed to introduce fluidization action into the stream force equation, reflecting it through an average speed of particles falling w. This speed is considered equal to the hydraulic size of the snow drifts’ particles (w0).
It has been established that for the fluidization processes in geometrically similar systems to be similar the following equation shall be observed
αv = αwо αs (8)
where: s – mean value of the suspended materials concentration in the examined volume; αwо αs –modelling scale.
Particles sedimentation speed W depends on their size and relative weight. The following three criteria shall be observed during modelling of snow drifts:
1. Re = V d/ν > Rem. 2. V/wo = idem. 3. V2/(g ρ d) = idem,
where: Rem – threshold Reynolds number value; V – speed; d – diameter (size) of particles, ν – kinematic viscosity coefficient; wo – hydraulic size of particles; ρ – density of particles. The size of snow particles (snowflakes) falls within 0.1 to 5, sometimes 10 mm (and different shapes). Snow density in freshly fallen deposit can be as high as 0.07…0.12 g/m3.
If the actual Rea > Rem, then the flow past an obstacle regime will be squared and Rem shall also be higher than Rem. If Rea < Rem, similarity may be achieved only in case Rea = Rem.
Criterion V2/(g ρ d) belongs to the conditions of bottom drag of solid particles and requires equal scales of αwо = αv =
hα , which is a result of kinematic similarity.Suspended sediment concentration of a flow S
depends on the geometric dimensions of the particles (d), values of V and wо. As the diameter of particles becomes more disperse (D/dср) suspended sediment concentration of the flow is achieved at higher values of V/wо.
S = 0.009 (Vlim/wо)6 (dср/D)3.5 (9)
where: Vlim – speed required to relocate a given number of suspended solid particles of a certain granulometric texture.
4. EXPERIMENTAL STUDYWe have examined a 1:60 scale road bed model
of a motorway constructed at zero elevation and on an embankment (model – 3 cm, actual size – 1.8 m) operating during ground blizzard at wind speeds from 5.0 m/s to 1.3 m/s (actual speed 38.7-10.1 km/h) with and without a snow-retaining barrier at the windward side of the road (fence). Traffic bearing part of the road has two lanes where: there are no cars; there is one row of cars (i.e. cars use one lane); there are two rows of cars (i.e. cars use two lanes). Snow imitation has been added to the air flow.
For modelling results see diagrams showing how the speed of the air flow changed as it came across the motorway.
126
SNOWDRIFT EXTENT ON MOTORWAYS WITH BUSY TRAFFIC
Fig. 3. Ground blizzard. Road bed at ‘elevation zero’. No snow-retaining barrier. Cars form 1 (Fig. 3a) and 2 (Fig. 3b) rows. There are 2 curves on the diagram showing velocity profile of the air flow for different initial air flow speeds
Fig. 4. Ground blizzard. Road bed at ‘elevation zero’. There is a snow-retaining barrier in front of the road. Cars on the road form 1 (Fig. 4a) and 2 (Fig. 4b) rows
Fig. 5. Ground blizzard. Road bed on an embankment. No snow-retaining barrier. Cars form 1 (Fig. 5a) and 2 (Fig. 5b) rows
Fig. 6. Ground blizzard. Road bed on an embankment. There is a snow-retaining barrier in front of the road. Cars form 1 (Fig. 6a) and 2 (Fig. 6b) rows
а) b)
а) b)
а) b)
а) b)

127
ZASIĘG POKRYWY ŚNIEŻNEJ NA AUTOSTRADACH O DUŻYM NATĘŻENIU RUCHU
For visual representation of snow drifts sedimentation refer to Figures 7-9.
Fig. 7. Top view of the snow drift build-up close to cars on the traffic-bearing surface of the road. Road bed at ‘elevation zero’, no snow-retaining barrier
Fig. 8. Sedimentation of snow drifts on the traffic-bearing surface of the road (embanked section) during ground blizzard. No snow-retaining barrier
Fig. 9. Sedimentation of snow drifts on the traffic-bearing surface of the road built on an embankment with a snow-retaining barrier. Ground blizzard
5. RESULTSChanges in the air speed over traffic-bearing surface
of the road showed that in ground blizzard (air flow height up to 2…3 m) car flow on the surface of the road contributes to blizzard drifts and therefore – formation of snow drifts. Regardless whether there is a snow-retaining barrier in front of the road or not. The number of car rows is important. Two occupied lanes creates several sharp speed drop areas: before and after the first lane, before and after the second one. The rate at which the wind speed decreases grows (sometimes down to 0 m/s). The lower the wind speed during snow drift, the more prominent this drop becomes. At high wind speeds solid particles are blown away from the traffic-bearing surfaces through the space between the cars in the lane and while the amount of snow is larger, on the whole the amount of solid drifts is less than with blizzards with relatively low wind speed. The study goes on. However already it is safe to say that snow barriers placed to the windward side of roads with busy traffic shall be retained to catch the snow carried by low drifts and ground blizzards; they shall be reinforced with blow-over snow fences (with or without a clearance in the bottom part) on the edge of the road bed – like noise-abatement walls – to ensure protection against snow carried by the high-up drifting snow.
References[1] Mihailovsky E.V., Aerodynamics of a car. Mashinostroenie, Moscow 1973.[2] Krasnov N.F., Aerodinamics. Vysshaya Shkola, Moscow 1971.[3] Hucho W.-H., Aerodynamik des Automobils. Vogel-Verlag, Wurzburg 1981.[4] Dunin A.K., Road maintenance in winter. Transport, Moscow 1983.[5] Reference book for road engineers. Road maintenance and reconditioning. Transport, Moscow 1974.

128
SNOWDRIFT EXTENT ON MOTORWAYS WITH BUSY TRAFFIC
[6] Leonovich I.I., Road use and traffic management. Vysheishaya Shkola, Minsk 1988.[7] Alder B., Ferbaneh S., Rotenberg M., Fundamental Methods in Hydrodynamics. Academic press, New York and
London 1964.[8] Chugaev R.R., Hydraulics. Gosenergoizdat, Leningrad 1963.[9] Bogomolov A.B., Mihailov K.A., Hydraulics. Izdatelstvo literatury po stroitelstvu, Moscow 1965.
[10] Levi I.I., Model analysis of hydraulic l phenomena. Gosenergoizdat, Moscow – Leningrad 1960. [11] Ushakov V.V., Korneeva D.Yu., Protection Of High Speed Roads And Trailers From Snow Drum. Transport construction.
2014. № 5, pp. 27-28.[12] Gladysheva O.V., Shiryaeva S.M., The Broadcasting Of The Authority Of The Streets Of Automobile Roads. Roads
and bridges. 2013. Vol. 1, No. 29, pp. 125-137.[13] Stolyarov V.V., Trusikhin A.V., The Account Of The Effects Of The Demand Height Of A Road Site On The Risk Of
Its Family Darkeness. Mathematical methods in engineering and technology – MMTT. 2014. No. 9 (68).
129
1. INTRODUCTIONMunicipal spatial policy, characterized through
historical and cultural values and landscape protection is based on the Polish legal system, on the Act on Spatial Planning and Development [1] and the Construction Law act [2]. Both documents along with implementation rules are the foundations of an investment process. With regard to the municipal spatial policy, based primarily on records of planning documents, including a Study of the Conditions and Directions of Spatial Planning and a Zoning Plan, the issue of protection of cultural values and the landscape seems to have a significant impact. The lack
1. WPROWADZENIEPolityka przestrzenna gmin, charakteryzowana
przez pryzmat wartości historycznych i kulturowych oraz ochronę krajobrazu, w obowiązującym w Polsce systemie prawnym, oparta została przez ustawodaw-cę o treść ustawy o planowaniu i zagospodarowaniu przestrzennym [1] oraz ustawy Prawo budowlane [2]. Oba akty prawne, wraz z przepisami wykonawczymi, stanowią w Polsce fundamenty prawne procesu inwe-stycyjnego. W odniesieniu do polityki przestrzennej gmin, opartej przede wszystkim na zapisach dokumen-tów planistycznych, do których należą studium uwa-runkowań i kierunków zagospodarowania przestrzen-
ANNA BAZAN-KRZYWOSZAŃSKA
University of Zielona Góra
e-mail: [email protected]
GIS TECHNOLOGY AS A TOOL FOR PROTECTING LANDSCAPE AND CULTURAL VALUES IN SPATIAL PLANNING
TECHNOLOGIA GIS NARZĘDZIEM OCHRONY KRAJOBRAZU I WARTOŚCI KULTUROWYCH W PLANOWANIU PRZESTRZENNYM
DOI: 10.30540/sae-2018-013
Manuscript submitted 2017.11.20 – revised 2018.01.10, initially accepted for publication 2018.03.02, published in June 2018
A b s t r a c tThe issue of a landscape protection is quite a significant element of municipal spatial policy. Currently, there is no legal obligation to implement, within the statutory activities of institutions responsible for the landscape protection, guidance documents prior to work on the development of the municipality. Space management, through planning a development and land use or the landscape protection, requires access to comprehensive and reliable information. The use of GIS technology in spatial analysis and monitoring changes in space, for the landscape and cultural values protection, provides opportunities to assist decisions on the destination and land use in spatial planning carried out using planning documents (A study of the conditions and directions of the spatial planning and the local zoning plan).
Keywords: landscape protection, GIS, spatial planning, planning documents
S t r e s z c z e n i eW odniesieniu do polityki przestrzennej gmin, problematyka ochrony krajobrazu stanowi element dość znaczący. Aktu-alnie brak jest prawnego obowiązku realizacji, w ramach działań statutowych instytucji odpowiedzialnych za ochronę krajobrazu, dokumentów o charakterze wytycznych wyprzedzających prace nad kierunkami rozwoju gminy. Zarządzanie przestrzenią, przez planowanie rozwoju oraz sposobu zagospodarowania terenu lub ochrony krajobrazu wymaga dostępu do wszechstronnej i wiarygodnej informacji. Wykorzystanie technologii GIS w ramach analiz przestrzennych oraz mo-nitoringu zmian zagospodarowania przestrzeni na potrzeby ochrony krajobrazu i wartości kulturowych daje możliwości wspomagające decyzje dotyczące przeznaczenia i sposobu zagospodarowania przestrzeni w planowaniu przestrzennym, realizowanym za pomocą dokumentów planistycznych gmin (studium uwarunkowań i kierunków zagospodarowania prze-strzennego gminy i miejscowego planu zagospodarowania).
Słowa kluczowe: ochrona krajobrazu, GIS, planowanie przestrzenne, dokumenty planistyczne

130
GIS TECHNOLOGY AS A TOOL FOR PROTECTING LANDSCAPE AND CULTURAL VALUES IN SPATIAL PLANNING
of regulations on the obligation to implement, within statutory activities of public administration institutions (regional or municipal Restorer, Town/City Mayor) guideline documents, which indicate conditions for the development of municipalities, is highly negative for items requiring protection, and for the investment process. Acknowledging the legislators’ view that the stage of agreement on a zoning documentation project, will verify the mentioned arrangements are a mistake. The complexity of the issues and the scope of the findings of planning documents indicate that the phase of implementing the mentioned documents containing condition-like elements should precede planning activities.
Regardless, land destination and restrictions on the land use are the foundation for spatial information, that undoubtedly affects the economic value of an area, determines the development of a region and results directly in the way of human functioning in terms of investment, economics, environmental protection, nature conservation, security, or the protection of the landscape and cultural values. The use of GIS technology in planning design, in the local, regional or national scale enables, considering the accessible information on land and its use, to develop simulations of individual variants of spatial development models (3D and 4D) while maintaining the principles of sustainable development and respect for natural resources and the cultural values. Such form of spatial planning also becomes a helpful tool in the presentation of planning solutions in public. GIS technology, as an integrated system of management and presentation of spatial data, can be a tool to solve problems and achieve a compromise. It is primarily due to the presentation of various studies results that take into account the aspects of space impossible to be presented in a 2D model (physiography, terrain models, technical infrastructure, formal considerations, landscape attractiveness, elements of spatial composition, a perception of cityscapes from certain viewpoints).
2. LEGAL STATUSAccording to the Spatial Planning and Land
Development Act [1], here referred to as the SPaLD Act, a study of the conditions and directions of spatial planning, as the document shaping the municipal spatial policy, shall take into account conditions arising in particular from: previous destination, land use and land utilities, spatial order and the requirements of its protection, the condition of the
nego gminy oraz miejscowy plan zagospodarowania przestrzennego, problematyka ochrony wartości kul-turowych i krajobrazu stanowi element mający dość znaczny wpływ. Brak prawnych uregulowań dotyczą-cych obowiązku realizacji, w ramach działań statuto-wych poszczególnych instytucji administracji publicz-nej (wojewódzki lub miejski konserwator zabytków, wójt, burmistrz, prezydent miasta), dokumentów o charakterze wytycznych, stanowiących swego rodza-ju wskazanie uwarunkowań dla kierunków rozwoju gmin, uznać należy za wysoce niekorzystny zarówno na przykład dla elementów wymagających ochrony, jak i dla samego procesu inwestycyjnego. Przyjęcie bowiem za ustawodawcą, iż etap uzgodnień projektu dokumen-tacji planistycznej zweryfikuje ostatecznie ustalenia w ww. zakresie jest błędem. Złożoność problematyki i zakres ustaleń dokumentów planistycznych wskazu-ją, iż etap realizacji opracowań zawierających elemen-ty stanowiące swego rodzaju uwarunkowania powi-nien wyprzedzać działania planistyczne.
Przeznaczenie terenu oraz obostrzenia dotyczące jego sposobu zagospodarowania stanowią fundament in-formacji przestrzennej, która niewątpliwie wpływa na wartość ekonomiczną przestrzeni, determinuje rozwój regionu, jak również przekłada się bezpośrednio na spo-sób funkcjonowania człowieka w rozumieniu inwesty-cyjnym, ekonomicznym, ochrony środowiska, ochro-ny przyrody, bezpieczeństwa czy ochrony krajobrazu i wartości kulturowych. Wykorzystanie technologii GIS w lokalnej, regionalnej czy krajowej skali projek-towania planistycznego daje możliwość, przy uwzględ-nieniu dostępnych informacji o terenie i sposobie jego zagospodarowania, opracowania symulacji poszcze-gólnych wariantów modeli (3D i 4D) zagospodarowa-nia przestrzeni, z zachowaniem zasad zrównoważone-go rozwoju i poszanowania zasobów naturalnych oraz zasobów stanowiących wartości kulturowe. Taka forma planowania przestrzennego staje się również pomoc-nym narzędziem w procesie prezentowania rozwiązań planistycznych na forum publicznym.
Technologia GIS, jako zintegrowany system za-rządzania i prezentacji danych przestrzennych, może stanowić narzędzie rozwiązania problemów oraz osią-gnięcia kompromisu, głównie przez sposób prezenta-cji wyników określonych analiz, uwzględniających aspekty przestrzeni niemożliwe do zaprezentowania w modelu 2D (fizjografia, model terenu, infrastruktura techniczna, uwarunkowania formalnoprawne, atrak-cyjność krajobrazowa, elementy kompozycji urbani-stycznej, sposób odbioru panoram miasta z określo-nych punktów widokowych).

131
TECHNOLOGIA GIS NARZĘDZIEM OCHRONY KRAJOBRAZU I WARTOŚCI KULTUROWYCH W PLANOWANIU PRZESTRZENNYM
environment, including, inter alia, the requirements of protecting the environment, nature, cultural landscape, the condition of cultural heritage and historical monuments and contemporary cultural property.
Given the findings of the study, it must be assumed that considering the issue of the landscape protection, it reflects the records of the Act on the protection and care of monuments [3]. It must be noted that article 145 of the mentioned act expands the scope of the arrangements introduced to a study by conservation protection authorities virtually without limitations. By making the character and scope of claims, regarding a planning document, dependent on the date of the founding of the municipal register of historical monuments.
The conclusions of the conservation protection services, required by law, collected in accordance with the SPaLD Act, containing cultural values and indicated an optimal way of protection, necessary to include in the study project, play a significant role in determining the municipal spatial policy that is included on the next stage of the study implementation [4, p. 6]. The same applies to the implementation procedure of the local zoning plan.
This is a direct cause of situations when under the Act on the protection and care of monuments, an assessment authority-a Restorer indicates that, in order to conform to applicable law, at the stage of implementation of the study, a study of the cultural landscape of the municipality should be drawn up as a supporting document. A cultural landscape, as defined in art. 3 point 14 of the Act on the protection and care of monuments is understood as space historically shaped as a result of human activity, including the creations of civilization and natural elements. According to the authority on the protection of monuments, the conclusions in the study of the cultural landscape of the municipality are required to be included in the study of the conditions and directions of the spatial planning of the municipality [5, p. 55-60].
The complexity of the issues of the protection of cultural landscape, the conclusions of monuments’ protection services, on considering the work on the study of the cultural landscape protection while implementing the study, seem to be reasonable, regardless of the fact that the obligation of having the mentioned documents is considered to be illegal. It is far from being applicable to any laws.
2. STAN PRAWNYNa podstawie zapisów ustawy o planowaniu i zago-
spodarowaniu przestrzennym [1], zwanej dalej ustawą o pizp, w studium uwarunkowań i kierunków zagospo-darowania przestrzennego, jako dokumencie kształtu-jącym kierunki polityki przestrzennej gminy, uwzględ-nia się uwarunkowania wynikające w szczególności z: dotychczasowego przeznaczenia, zagospodarowania i uzbrojenia terenu, stanu ładu przestrzennego i wymo-gów jego ochrony, stanu środowiska, w tym między in-nymi wymogów ochrony środowiska, przyrody i kra-jobrazu kulturowego, stanu dziedzictwa kulturowego i zabytków oraz dóbr kultury współczesnej.
Biorąc pod uwagę zakres ustaleń studium, przy-jąć należy, iż w odniesieniu do tematyki związanej z ochroną krajobrazu jest on odzwierciedleniem za-pisów zawartych w ramach ustawy o ochronie zabyt-ków i opiece nad zabytkami [3]. Przy czym zazna-czyć należy, iż art. 145 ww. ustawy rozszerza zakres ustaleń wprowadzanych przez organy ochrony kon-serwatorskiej do studium praktycznie bez ograniczeń, uzależniając charakter i rozmiary roszczeń, w stosun-ku do dokumentu planistycznego, od terminu założe-nia gminnej ewidencji zabytków.
Ustawowo wymagane od służb ochrony konser-watorskiej wnioski, zbierane w myśl zapisów ustawy o pizp, zawierające konieczny do uwzględnienia w pro-jekcie studium zasób wartości kulturowych i wskazany optymalny sposób jego ochrony, pełnią znaczącą rolę w określeniu polityki przestrzennej gminy uwzględnio-nej na kolejnym etapie realizacji studium [4, s. 6]. Po-dobnie rzecz się ma w przypadku procedury realizacji miejscowego planu zagospodarowania przestrzennego.
Przedstawiony stan jest bezpośrednią przyczyną sytuacji, w których, w myśl ustawy o ochronie zabyt-ków i opiece nad zabytkami, organ opiniujący – kon-serwator zabytków – wskazuje, iż w celu dostoso-wania do obowiązujących przepisów prawa, na etapie realizacji studium, należy sporządzić dokument po-mocniczy, jakim jest studium krajobrazu kulturo-wego gminy. Za krajobraz kulturowy, zdefiniowany w art. 3 pkt 14 ustawy o ochronie zabytków i opie-ce nad zabytkami, uznaje się przestrzeń historycznie ukształtowaną w wyniku działalności człowieka, za-wierającą wytwory cywilizacji oraz elementy przy-rodnicze. Zgodnie ze stanowiskiem organu ochrony zabytków, wnioski zawarte w studium krajobrazu kulturowego gminy mają obowiązek zostać uwzględ-nione w studium uwarunkowań i kierunków zagospo-darowania przestrzennego gminy [5, s. 55-60].

132
GIS TECHNOLOGY AS A TOOL FOR PROTECTING LANDSCAPE AND CULTURAL VALUES IN SPATIAL PLANNING
3. SPACE MANAGEMENT – MODEL 2D Poland is a country with a diversity of space
functioning which is distinctive in Europe, but at the same time, with severe processes of spatial order and landscape physiognomy degradation and growing problems with management of cities and municipalities land use [6, pp. 5-18]. It is caused, inter alia, by the lack of clear assumptions indicating and interpreting ways of acting spaces eg. valuable culturally and historically, as well as the absence of a system of analysis and monitoring of changes in land development, taking into account the elements which are especially valuable and require protection. A way of regulating interactions plays a very important role in landscape systems. A mechanism based on an adaptation of the system to the conditions arising from changes in the environment, seems to be most appropriate. However, to make this mechanism work,a clear definition of the circumstances, indicating e.g., elements which must be regarded as protected, is necessary.
Management of space by planning for its way of use or protection requires access, and considering comprehensive and reliable information. Linking a number of databases and their correlation are the basis for the implementation of the analysis, then creating variants of the solutions and modeling changes in space, finally monitoring its transformations over time.
The records of planning documents for the city of Zielona Góra of 2015 can be an example of thinking about space limited to 2D model. Based on the findings of the study of the conditions and directions of the city spatial planning (Fig. 1),a zoning plan has been developed (Fig. 2), concerning with its arrangements, a part Zielona Góra center, including the area which covers quarters adjacent directly to the old market. The north frontage of Konstytucji 3 Maja street was characterized by the view into the W. Sikorskiego street ended by dominating tower of the City Hall (Fig. 3). The introduction of the detailed findings of the plan and the arrangements on the obligatory course of buildings and the maximum height of buildings, but without a broader analysis, in this case concerning the terrain, the relative height of buildings, or the composition of urban planning, has led to the accomplishment of the Kepler’s Science Center project, losing completely the original layout of W. Sikorskiego street (Fig. 4). The above example indicates a strong correlation between spatial policy document and a local law. Effects of negligence or lack of relevant studies seem irreversible.
Złożoność problematyki związanej z ochroną kra-jobrazu kulturowego oraz wnioski służb ochrony zabytków, dotyczące uwzględnienia w ramach re-alizacji studium wyników prac nad studium ochrony krajobrazu kulturowego, wydają się być jak najbar-dziej uzasadnionymi, niezależnie od faktu, iż proce-durę wymagalności tych dokumentów uznać należy za bezprawną. Niepoparta jest ona bowiem żadnym z obowiązujących przepisów prawa.
3. ZARZĄDZANIE PRZESTRZENIĄ – MODEL 2D Polska jest krajem o wyróżniającej się w Europie
różnorodności sposobu funkcjonowania przestrzeni, ale jednocześnie o bardzo nasilonych procesach degra-dacji ładu przestrzennego i fizjonomii krajobrazu oraz narastających problemach zarządzania zagospodaro-waniem obszarów miast i gmin [6, s. 5-18]. Przyczyną takiego stanu jest między innymi brak jasnych założeń wskazujących i interpretujących sposób działania prze-strzeni, np. cennych kulturowo i historycznie, a także brak systemu analiz i monitorowania zmian w zagospo-darowaniu przestrzeni, przy uwzględnieniu elementów szczególnie cennych i wymagających ochrony.
Bardzo ważną rolę w systemach krajobrazowych odgrywa sposób regulacji wzajemnych oddziaływań. Mechanizm oparty na adaptacji dostosowującej sys-tem do warunków wynikających ze zmian zachodzą-cych w otoczeniu wydaje się najwłaściwszy.
Aby jednak ten mechanizm zadziałał, potrzebna jest jasno określona definicja uwarunkowań wskazu-jących na przykład na to, które elementy bezwzględ-nie należy uznać za podlegające ochronie.
Zarządzanie przestrzenią przez planowanie jej spo-sobu zagospodarowania lub ochrony wymaga dostę-pu oraz uwzględnienia wszechstronnej i wiarygodnej informacji. Powiązanie ze sobą szeregu baz danych i ich wzajemna korelacja stanowią podstawę do reali-zacji analiz, następnie tworzenia wariantów rozwiązań i modelowania zmian zachodzących w przestrzeni, aż po możliwość monitorowania jej przekształceń w czasie.
Przykładem sposobu myślenia o przestrzeni, w ogra-niczonym do modelu 2D systemie, mogą być zapisy dokumentów planistycznych dla miasta Zielona Góra z 2015 r. Na podstawie ustaleń studium uwarunkowań i kierunków zagospodarowania przestrzennego miasta (rys. 1) opracowany został miejscowy plan zagospo-darowania przestrzennego (rys. 2), obejmujący swoimi ustaleniami część śródmieścia miasta Zielona Góra, w tym obszar, w skład którego wchodzą kwartały sąsia-dujące bezpośrednio ze Starym Rynkiem. Widok wnę-trza ulicy W. Sikorskiego zakończony dominantą w po-

133
TECHNOLOGIA GIS NARZĘDZIEM OCHRONY KRAJOBRAZU I WARTOŚCI KULTUROWYCH W PLANOWANIU PRZESTRZENNYM
Fig. 1. Map extract from the study of the conditions and directions of spatial planning of Zielona Gora [7]Rys. 1. Wyrys ze studium uwarunkowań i kierunków zago-spodarowania przestrzennego miasta Zielona Góra [7]
Fig. 2. Map extract from the local plan of land use in Zielona Góra – Śródmieście 9 [8]Rys. 2. Wyrys z miejscowego plan zagospodarowania prze-strzennego w Zielonej Górze – Śródmieście 9 [7]
Fig. 3. View of the Town Hall from the side of Gen. W. Sikorskiego street in Zielona Góra. Year 2013. Source: https://www.google.pl/maps/@51.935545,15.506222,3a,75y,90t/data =! 3m4! 1e1! 3 m 2! 1sSa2oUtzSsKGwmXXlRaXZUQ! 2e0, date of access: 14.05.2015)Rys. 3. Widok na wieżę Ratusza od strony ul. gen. W. Sikorskiego w Zielonej Górze. Rok 2013. Źródło: https://www.google.pl/maps/@51.935545,15.506222,3a,75y,90t/data=!3m4!1e1!3m2!1sSa2oUtzSsKGwmXXlRaXZUQ!2e0, data do-stępu: 14/05.2015r.)
Fig. 4. View of the Town Hall from the side of Gen. W. Sikorskiego street in Zielona Góra. Year 2015. Source: authorRys. 4. Widok na wieżę Ratusza od strony ul. gen. W. Sikorskiego w Zielonej Górze. Rok 2015. Źródło: autor

134
GIS TECHNOLOGY AS A TOOL FOR PROTECTING LANDSCAPE AND CULTURAL VALUES IN SPATIAL PLANNING
4. EXAMPLE OF THE USE OF GIS TECHNOLOGY – 3D MODEL
Taking into account the development of GIS technology, the use of its capabilities in spatial policy and space management seems inevitable. Implementation of the zoning plan, limited only to legalizing new investment should be in the present state of knowledge, treated as an abuse in relation to the public space owned by its users- residents. The perception of an object due to its relationship with the environment, mainly through the financial implications related to the execution of a planning document, should be one of the elements affecting the final location decision.
Analysis of effects and aspects of the spatial implementations of individual investments in internal or external views rendering panorama layout, using GIS models (3D) seem to be already an indispensable a tool to help in the selection of the most advantageous variant of the space management. Selection of views and indicating viewpoints, topographical analysis of land, protection of open and closed landscapes, height of buildings and its harmonious combination with greenery complemented by architectural accents, identifying and distinguishing the space [9], enable to analyze the properties of space in a way incomparable to the 2D model (Fig. 5 and Fig. 6).
Local law, also regarding municipal spatial policy, is next to common law, the most important tool for the implementation of, inter alia, the protection of cultural heritage. To ensure the effectiveness of these activities, it is necessary to take an attitude that the protection of cultural values, including the cultural landscape is
staci wieży Ratusza charakteryzował pierzeję północną ulicy Konstytucji 3 Maja (rys. 3). Wprowadzenie ustaleń szczegółowych planu miejscowego, jak i ustaleń doty-czących przebiegu obowiązującej zabudowy oraz wy-sokości maksymalnej budynków, jednak bez szerszych analiz dotyczących w tym wypadku ukształtowania te-renu, wysokości względnych budynków czy elementów kompozycji urbanistycznych, doprowadziło w konse-kwencji do realizacji obiektu Centrum Nauki Keplera, zaburzając całkowicie pierwotny układ ulicy W. Sikor-skiego (rys. 4). Przykład ten wskazuje na silne współ-zależności między dokumentem polityki przestrzennej a prawem lokalnym. Skutki niedopatrzenia lub braku stosownych analiz wydają się nieodwracalne.
4. PRZYKŁAD WYKORZYSTANIA TECHNOLOGII GIS – MODEL 3D
Biorąc pod uwagę rozwój technologii GIS, wykorzy-stanie jej możliwości w polityce przestrzennej i syste-mie zarządzania przestrzenią wydaje się nieuniknione. Realizacja planu miejscowego w mieście, ograniczona jedynie do zalegalizowania nowo powstającej inwe-stycji, powinna być w obecnym stanie wiedzy trak-towana jako nadużycie w odniesieniu do przestrzeni publicznej, której właścicielami są jej użytkownicy – mieszkańcy. Postrzeganie obiektu ze względu na jego relacje z otoczeniem, głównie za sprawą skut-ków finansowych związanych z realizacją dokumentu planistycznego, powinno stanowić jeden z elementów wpływających na ostateczną decyzję lokalizacyjną.
Analizy aspektów i skutków przestrzennych re-alizacji poszczególnych inwestycji w widokach wewnętrznych czy też zewnętrznych wnętrz urba-nistycznych eksponujących panoramę układu, przy wykorzystaniu modeli GIS (3D), wydają się być już dzisiaj nieodzownym narzędziem, pomocnym w wy-borze najkorzystniejszego wariantu zagospodarowa-nia przestrzeni. Selekcja widoków i wyszczególnienie punktów widokowych, analiza topograficzna terenu, ochrona krajobrazów otwartych i domkniętych, wy-sokość zabudowy i jej harmonijne połączenie z zie-lenią, uzupełnione przez akcenty architektoniczne, wyróżniające i identyfikujące przestrzeń [9], dają możliwość analizy właściwości przestrzeni w sposób niewspółmierny do modelu 2D (rys. 5 i rys. 6).
Prawo miejscowe, w tym odnoszące się do polityki przestrzennej gminy, jest obok prawa powszechnego najważniejszym narzędziem realizacji między inny-mi ochrony dziedzictwa kulturowego. Dla zapewnie-nia skuteczności działań niezbędnym jest przyjęcie sposobu myślenia, w ramach którego ochrona warto-
Fig. 5. Analysis of the terrain and the height of the city-model 3D. Source: PA Nova S.A.Rys. 5. Model ukształtowania terenu i wysokości zabudowy. Źródło: PA Nova S.A.

135
TECHNOLOGIA GIS NARZĘDZIEM OCHRONY KRAJOBRAZU I WARTOŚCI KULTUROWYCH W PLANOWANIU PRZESTRZENNYM
ści kulturowych, w tym krajobrazu kulturowego, sta-nowi ważny interes publiczny, a tym samym element zrównoważonego rozwoju gminy. Tego typu myśle-nie wskazuje na potrzebę rozszerzenia partycypacji społecznej i zaangażowania społeczeństwa, jako gru-py lokalnej, w procesy tworzenia prawa lokalnego w imię ochrony wspólnych interesów, a tym samym tożsamości lokalnej. Wykorzystanie w tym przypad-ku modelu GIS (3D), między innymi przez sposo-by prezentacji i generowania danych, daje ogromne możliwości w odniesieniu do problemu partycypacji społecznej w planowaniu przestrzennym.
Przyjąć należy, iż miejscowy plan zagospodarowania przestrzennego, jako prawo miejscowe, może być roz-patrywany w kategorii narzędzia ochrony krajobrazu kulturowego czy urbanistycznego, niezależnie od ko-rekt w obowiązujących przepisach prawa, pod warun-kiem że jego realizację poprzedzą działania mające na celu wskazanie uwarunkowań i wniosków z przepro-wadzonych analiz, skutkiem których będzie optymali-zacja zagospodarowania przestrzeni z uwzględnieniem tradycji miejsca i potrzeb samych mieszkańców, a sam związek struktury zespołu urbanistycznego z otacza-jącym terenem niezabudowanym, kształtowany będzie zgodnie z logiką układów przestrzennych.
Wraz z rozwojem technik pomiarowych, pozwalają-cych na szybkie pozyskanie danych modelowych 3D, w rozpatrywanym przypadku poszczególnych budyn-ków i elementów przestrzennych, oraz powiązanie ich z danymi baz opisowych, staje się pomocnym narzę-dziem w planowaniu przestrzennym przy tzw. inteli-gentnym rozwoju miast [11, 12].
5. WNIOSKI Wydaje się, że obowiązkowym, z punktu widzenia
procesu projektowego dokumentów planistycznych,
an important public interest, and the element of the sustainable development of the municipality. Such type of thinking indicates the need for an extension of the social participation and involvement, as a local group in the processes of creating a local law in the name of protection of common interests that is, local identity. In this case, using the GIS model (3D), inter alia, through presentations and data generation, offers great possibilities regarding a problem of social participation in land-use planning.
Given the above, it should be assumed that a local zoning plan, as a local law, can be seen as a cultural or urban landscape protection tool, despite the corrections in the rules of law, provided that the execution will be preceded by efforts to identify conditions and conclusions of the analysis carried out to optimize land use, taking into account the traditions of the place or the needs of the inhabitants, and the relationship between urban structure and the surrounding undeveloped land will be shaped in accordance with the logic of spatial systems. Along with the development of measurement techniques, that enable fast acquisition of 3D model data (in this case, the individual buildings and spatial elements) and linking them with the descriptive data base, becomes a helpful tool in spatial planning at the so-called intelligent urban development [11,12].
5. CONCLUSIONSIt seems that, regarding a process of designing
planning documents, a requirement for studies like landscape study or landscape plans, following the example of Germany or the UK, is an obligation. These documents, as starting materials for planning studies, implemented on the basis of executory orders, along with the eco-physiography, or forecasts
Fig. 6. Analysis of the topographical model of the city and the height of buildings. Source: http://fotogrammetrik.com/pl/uslugi/Rys. 6. Model topograficzny miasta i wysokości zabudowy. Źródło: http://fotogrammetrik.com/pl/uslugi/
136
GIS TECHNOLOGY AS A TOOL FOR PROTECTING LANDSCAPE AND CULTURAL VALUES IN SPATIAL PLANNING
of impacts of the plan on the environment, may become guidelines to a plan or a study. They may stress the importance of such things as: nature and landscape values protection(use of land zones requires specifying rules for maintenance of the landscape characteristics and forms), conservatory protection zones (panoramas protection, monument or area exposure zone protection, designation of areas excluded from development on the basis of observation analyses which also determine zoning and land use), or areas of cultural values protection zones (rural and urban, clear spatial structure building and greenery areas).
From the above point of view, the content of the applicable law on municipal spatial policy, considering solutions that affect the space functioning, including forms depicting cultural values,taking into account their mutual ties and the feasibility of the introduced documents, is only an introduction to a discussion on space. Local plan, just like a building, reflects the state of civilization. It is important, however, not to lose in its content the goal of respect for cultural values, that is a respect for the users of the space to which it applies.
It is important that local plans, as tools for spatial policy in a municipality, are constructed competently, and used properly. Local plans considering: non-existent in the current legislation e.g. cultural landscape studies indicating cultural heritage protection by area with the use of panoramas, viewpoints, foreground protection. Planning documents pointing out the elements of space such as wooded areas, alleys, or lines of trees. Development composition, taking into account the density and intensity, based on the grid of streets characteristic for the area, including thinking about communication, as a system.
GIS technology-3D and 4D models offer great opportunities for data access and analysis for decisions about the directions of the development of urban systems. Techniques of coordination of knowledge resulting from the data analysis and building models of potential solutions associated, e.g. with the economic aspects of this type of activity, or practice activities based on consensus, seem appropriate approach to spatial planning, which also allows time monitoring of changes in space cities. Cadastral systems, using the GIS applications can be found in a variety of applications-however, the 3D and 4D techniques allow present data and visualize models giving the potential to improve space
jest wymagalność realizacji opracowań typu studium krajobrazu czy planów krajobrazu, idąc za przykła-dem Niemiec czy Wielkiej Brytanii. Dokumenty te, na zasadzie materiałów wyjściowych do opracowań planistycznych, realizowane na podstawie rozporzą-dzeń wykonawczych do obowiązujących ustaw razem z ekofizjografią czy prognozą skutków wpływu ustaleń planu na środowisko, mają szansę, jako wytyczne do planu czy studium, podkreślić wagę takich elementów przestrzeni, jak: ochrona przyrody i walorów krajobra-zowych (zagospodarowanie stref wymaga określenia zasad utrzymania cech i form krajobrazu), stref kon-serwatorskich ochrony ekspozycji (ochrona panoram, stref ekspozycji zabytku czy obszaru, wyznaczenie terenów wyłączonych spod zabudowy na podstawie analiz widokowych określających równocześnie wa-runki zabudowy i zagospodarowania terenu) czy strefy ochrony obszarów przedstawiających wartości kultu-rowe (układy ruralistyczne i urbanistyczne, zespoły za-budowy i zieleni o czytelnej strukturze przestrzennej).
Wychodząc z powyższego punktu widzenia, treść obowiązujących przepisów prawa w odniesieniu do polityki przestrzennej gmin, uwzględniającej roz-wiązania wpływające na sposób funkcjonowania przestrzeni, w tym form przedstawiających warto-ści kulturowe, przy uwzględnieniu ich wzajemnych powiązań oraz wykonalności wprowadzanych nimi dokumentów, stanowi jedynie wstęp do rozważania o przestrzeni. Plan miejscowy, podobnie jak obiekt budowlany, stanowi odzwierciedlenie stanu systemu cywilizacyjnego. Ważnym jest jednak, aby nie zatra-cił w swej treści celu, jakim jest poszanowanie war-tości kulturowych, a tym samym poszanowanie użyt-kowników przestrzeni, której dotyczy.
Istotnym jest, by plany miejscowe, jako narzędzie polityki przestrzennej w gminie, były właściwie kon-struowane i wykorzystane. Powinny one uwzględniać, nieistniejące w obecnym stanie prawnym np. studia kra-jobrazu kulturowego, wskazujące na obszarową ochro-nę dziedzictwa kulturowego z wykorzystaniem formy, jaką jest ochrona: panoram, ekspozycji widokowych, czy przedpola. Dokumenty planistyczne powinny uwzględniać w ramach swoich ustaleń elementy prze-strzeni typu: zadrzewienia, aleje, czy szpalery drzew. Kompozycja zabudowy wskazywana w planach odno-sić powinna się z większym poszanowaniem wskaź-ników typu: gęstość, chłonność, chropowatość i inten-sywność zabudowy, nie pomijając myślenia o strukturze urbanistycznej, opartej na charakterystycznej dla danej przestrzeni siatce ulic, z uwzględnieniem komunikacji, jako jednego z systemów przestrzeni zurbanizowanej.

137
TECHNOLOGIA GIS NARZĘDZIEM OCHRONY KRAJOBRAZU I WARTOŚCI KULTUROWYCH W PLANOWANIU PRZESTRZENNYM
management system, and thus also the possibility of elimination of mistakes in spatial planning at the stage of analysis and modeling. That seems to be a particularly valuable aspect,due to the fact that planning decisions determine a city function in a virtually unrecoverable way.
Technologia GIS – modele 3D i 4D – dają duże możliwości dostępu do danych oraz analiz na po-trzeby decyzji dotyczących kierunków rozwoju sys-temów miejskich. Techniki koordynacji wiedzy wy-nikającej z analiz danych oraz budowanie modeli potencjalnych rozwiązań powiązanych na przykład z ekonomicznymi aspektami tego typu działalności czy też praktyka działań oparta na konsensusie, wy-daje się adekwatnym do problematyki planowania przestrzennego podejściem, umożliwiającym rów-nież monitorowanie w czasie zmian zachodzących w przestrzeni miast. Systemy katastralne wykorzystu-jące aplikacje GIS można znaleźć w różnych aplika-cjach – jednak technika 3D i 4D pozwala na prezen-tację danych i wizualizację modeli, dając potencjał do poprawy systemu zarządzania przestrzenią, a tym samym również możliwości eliminacji ewentualnych błędów w planowaniu przestrzennym na etapie ana-liz i modelowania, co wydaje się szczególnie cennym aspektem, biorąc pod uwagę fakt, iż decyzje plani-styczne przesądzają o sposobie funkcjonowania prze-strzeni miasta w sposób praktycznie nieodwracalny.
References[1] The act of 27 March 2003 on spatial planning and development (Off. J. of 2015 item 199 as amended).[2] The Act of 7 July 1994-construction law (Off. J. of 2013 item 1409 as amended).[3] The Act of 23 July 2003. on the protection and care of monuments (Off. J. of 2003. no 162, item. 1568- as amended).[4] Welc-Jędrzejewska J., Kulesza-Szerniewicz E., Makowska B., Stieler E., Jagielska E., Wnioski w zakresie ochrony
dziedzictwa kulturowego i zabytków do projektów studiów uwarunkowań i kierunków zagospodarowania przestrzennego gmin i projektów miejscowych planów zagospodarowania przestrzennego, Kurier Konserwatorski, Nr 4, 2009.
[5] Bazan-Krzywoszańska A., Ochrona krajobrazu w aspektach rozwoju źródeł energii odnawialnej i polityki przestrzennej gmin, na przykładzie gminy Krotoszyce, Architektura Krajobrazu: Studia i prezentacje, nr 3, 2012, s. 55-60.
[6] Chmielewski T.J., Wyzwania zarządzania systemami krajobrazowymi w Polsce, Problemy Ekologii Krajobrazu, Vol XXXV, 2013, p. 5-18, http://paek.ukw.edu.pl/pek/index.php/PEK/article/viewFile/31/11> [dostęp: 01.07.2017].
[7] The study of the conditions and directions of the spatial planning of Zielona Góra, adopted by the resolution of Zielona Góra City Council No. XVIII.139.2015 of 30 June 2015, http://www.zielona-gora.pl/binary /planowanie/zm_studium_2015.jpg, [access: 19.07.2015].
[8] Zoning plan in Zielona Gora-Śródmieście (Downtown) 9, adopted by resolution of the City Council of Zielona Góra No. LXXIX. 709.2014 of 23 December 2014, http://dzienniki.luw.pl/ActDetails.aspx?year=2014&book=0&poz=2464 [access: 19.07.2015].
[9] Czyńska K., Zabudowa wysoka a harmonijne kształtowanie krajobrazu miejskiego, http://www.pif.zut.edu.pl/pif-13_pdf/D-02_Czynska.pdf [access:01.07.2017].
[10] Kowalska-Jamrożek D., Wykorzystanie aplikacji GIS w planowaniu przestrzennym Kielc, Miejski System Informacji Przestrzennej w Kielcach, Biuro Planowania Przestrzennego Urzędu Miasta w Kielcach, http://www.um.kielce.pl/gfx/kielce2/userfiles/images/gis/aktualnosci/2010_11_18/dominika_kowalska.pdf [access: 01.07.2017].
[11] Miller J.S., Hoel L.S., The „smart growth” debate: best practices for urban transportation planing, Socio-Economic Planning Sciences, (36) 2002, pp. 1-24.
[12] Guo R. et al., Developing a 3D cadastre for the administration of urban land use: A case study of Shenzhen, China, Computers, Environment and Urban Systems, (40) 2013, pp. 46-55.
[13] Guney C. et al., Tailoring a geomodel for analyzing an urban skyline, Landscape and Urban Planning, (105) 2012, pp. 160-173.
Acknowledgments:The work was financed by the University of Zielona Góra as part of the statutory work No. 220570/E-545/S/2017
Podziękowania:Praca finansowana przez Uniwersytet Zielonogórski w ramach pracy statutowej nr: 220570/E-545/S/2017
138
1. INTRODUCTIONThe nineteenth century was a period of an unusually
dynamic development of civilisation. Over the past one hundred years, a significant number of inventions were patented, which revolutionised the modern world.
The invention of cast iron, steel and reinforced concrete proved to be pivotal to the development of contemporary architecture. The new structural solutions used in institutional buildings were initially hidden under a traditional revival-style exterior.
Both the new construction technologies and the departure of artists from historical architecture fostered the rise of a new architecture, Modernism. Modernist architecture was created from 1918 to 1975.
The contemporary architecture of Kielce followed the same patterns of influence as the architecture
1. WPROWADZENIEXIX wiek to okres niezwykle dynamicznego roz-
woju cywilizacyjnego. Na przestrzeni tych stu lat opatentowano znaczącą liczbę wynalazków, które zrewolucjonizowały współczesny świat.
Dla rozwoju nowoczesnej architektury najważniej-sze wydaje się wynalezienie żeliwa, stali i żelbetonu. Nowe konstrukcje stosowane w budynkach użytecz-ności publicznej początkowo ukrywane były pod tra-dycyjną neostylową obudową.
Nowe technologie w budowaniu i odwrócenie się przez twórców od architektury historycznej sprzyjało powstaniu nowej architektury – modernistycznej. Mo-dernizm w architekturze przypada na lata 1918-1975.
Architektura współczesna w Kielcach podlegała tym samym wpływom, którym podlegała architektu-
LUCJAN W. KAMIONKA
Kielce University of Technology
e-mail: [email protected]
THE IMAGE OF THE CONTEMPORARY ARCHITECTURE OF KIELCE – A REVIEW OF THE SELECTED BUILDINGS
OBRAZ WSPÓŁCZESNEJ ARCHITEKTURY KIELC NA PRZYKŁADZIE WYBRANYCH OBIEKTÓW
DOI: 10.30540/sae-2018-014
Manuscript submitted 2017.12.19 – revised 2018.01.10, initially accepted for publication 2018.01.13, published in June 2018
A b s t r a c tModernist architecture has grown out of the possibility of using new construction materials as well as a widespread criticism of historical architectural styles. The development of contemporary architecture in Kielce is consonant with the development trends in architecture throughout Poland and in Europe. In order to characterise the facets of contemporary architecture in Kielce, the author of the paper has focused on the selection of the most distinctive and valuable buildings. The image of Kielce’s contemporary architecture presented here evinces its diversity and great value. The city’s fabric holds noteworthy objects of modernist and postmodernist architecture.
Keywords: contemporary architecture, architecture of Kielce
S t r e s z c z e n i eArchitektura modernistyczna wyrosła na gruncie możliwości stosowania nowych materiałów konstrukcyjnych i powszech-nej krytyce stylów historycznych. Rozwój współczesnej architektury w Kielcach odpowiada tendencjom rozwojowym w architekturze w Polsce i w Europie. Aby scharakteryzować oblicza architektury współczesnej w Kielcach, autor skupił się na wybranych przykładach obiektów najbardziej charakterystycznych i wartościowych. Zaprezentowany obraz ar-chitektury współczesnej Kielc świadczy o jej zróżnicowaniu i dużych walorach. W tkance miasta znajdują się znaczące obiekty architektury modernistycznej i postmodernistycznej.
Słowa kluczowe: architektura współczesna, architektura Kielc
139
OBRAZ WSPÓŁCZESNEJ ARCHITEKTURY KIELC NA PRZYKŁADZIE WYBRANYCH OBIEKTÓW
of other cities in Poland and in Europe. Modernist buildings were constructed from the 1930s onwards, whereas postmodernist and neo-modernist objects began to appear around the turn of the second millennium. It should be noted that after World War II, in the 1950s and the 1060s, the so called socialist realism architecture was created both in Kielce and throughout Poland. This style, however, is not included in the paper since it does not belong to the mainstream of creative architecture.
In order to characterise the facets of contemporary architecture in Kielce in a brief, concise article form, the focus had to be given to selected buildings solely. The selection process is subjective by nature. Therefore, only the most distinctive and valuable buildings were chosen.
2. THE NEW ARCHITECTURE – ITS DETERMINANTS AND ExAMPLES
2.1. ModernismThe erection of the Crystal Palace in London’s Hyde
Park was a major breakthrough in the history of modern architecture. The improvement on iron structures paralleled the development of the technology of cast iron and steel smelting. Mass production of steel began after the year 1850. This rendered the construction of highly elaborate structures possible. Iron-framed structures started to appear in the USA on a large scale in the mid-nineteenth century. Concrete and reinforcement were first set together by Joseph-Louis Lambot. In 1892, the idea of reinforcing concrete was scientifically developed by a French engineer, Francois Hennebique. The first ever building to feature a fully reinforced concrete frame was erected in Greenburg, Pennsylvania in 1903. Pre-stressed members were first used in 1920 by Eugène Freyssinet.
Eclecticism and Art Nouveau were the dominant styles in architecture at that time. Art Nouveau resulted from both the pursuit of liberation of the building form from an out-and-out imitation of ancient epochs (historicism) and the desire to create a fresh style. An Austrian architect, Adolf F.K.V.M. Loos, who created his work at the time of Art Nouveau, in 1913 wrote an essay entitled Ornement et crime [9], in which he argued for the dispensability of ornamentation in architecture. With this manifesto, he became a precursor of Modernism.
In the years following World War I, already a relic, Art Nouveau met severe criticism of the avant-garde of that time. Many of the architects who had initially found inspiration in Art Nouveau for their works turned into its radical opponents.
ra w Polsce i Europie. Począwszy od lat trzydziestych XX wieku powstawały budowle modernistyczne, a pod koniec wieku XX i w wieku XXI – postmoder-nistyczne i neomodernistyczne. Należy zaznaczyć, że po drugiej wojnie światowej w latach 50. i 60. po-wstawały w Kielcach, podobnie jak i w całej Polsce, budowle w stylu tzw. socrealistycznym, które w tym artykule pominięto jako niebędące w głównym nurcie architektury twórczej.
Aby scharakteryzować oblicza architektury współ-czesnej w Kielcach, w ramach krótkiej formy arty-kułu, należało skupić się na wybranych przykładach. Wybór z natury rzeczy jest subiektywny. Autor starał się dokonać wyboru budowli najbardziej charaktery-stycznych i wartościowych.
2. OBRAZ NOWEJ ARCHITEKTURY – UWARUNKOWANIA, PRZYKŁADY
2.1. ModernizmPrzełomowym wydarzeniem w historii architektury
nowoczesnej było wzniesienie w londyńskim Hyde Par-ku Pałacu Kryształowego. Ulepszanie konstrukcji żela-znych przebiegało równolegle z rozwojem technologii wytopu, najpierw żeliwa, a potem stali. Masową pro-dukcję stali rozpoczęto po roku 1850, dało to możliwość realizowania bardzo rozbudowanych konstrukcji. Mniej więcej od połowy XIX stulecia zaczęto w Stanach Zjed-noczonych stosować na dużą skalę budownictwo szkie-letowe, posługując się żelazem jako materiałem. Beton ze zbrojeniem jako pierwszy połączył Joseph-Louis Lambot. Koncepcję zbrojenia betonu uzasadnił nauko-wo w 1892 roku francuski inżynier Francois Hennebi-que. W 1903 roku w Greenburg (Pensylwania) powstał pierwszy budynek o całkowicie żelbetowej konstrukcji szkieletowej. Elementy sprężone jako pierwszy zastoso-wał w 1920 roku Eugène Freyssinet.
W architekturze w owym czasie panował eklek-tyzm i secesja. Secesja była rezultatem poszukiwań wyzwolenia formy budynku z czystego naśladownic-twa dawnych epok (historyzmu) i chęci wytworzenia nowego stylu. Austriacki architekt Adolf F.K.V.M. Loos, tworzący w okresie panowania secesji, w roku 1913 napisał esej Ornement et crime [9], w którym dowodził zbędności ornamentu w architekturze, sta-jąc się prekursorem modernizmu.
Po I wojnie światowej, secesja, która już wcześniej wydawała się przeżytkiem, spotykała się prawie wyłącz-nie z surową krytyką ze strony ówczesnej awangardy. Wielu architektów, którzy tworzyli początkowo w stylu secesyjnym, stało się radykalnymi jej przeciwnikami.

140
THE IMAGE OF THE CONTEMPORARY ARCHITECTURE OF KIELCE - A REVIEW OF THE SELECTED BUILDINGS
In the second decade of the 20th century, the newly emerging architectural style began to be referred to as modernist. The term ‘Modernism’ is of Latin origin and denotes ‘modernity’ [1] (in French – ‘le moderne”, in German – ‘die Moderne’).
The term ‘Modernism’ encompasses a wide range of architectural aspects. It covers a variety of currents and trends, e.g. functionalism, radicalism and sceptical humanism, which depart from the historical styles and focus mainly on the functionality of the premises. The first buildings bearing the signs of Modernism were constructed in Germany and the Netherlands. The Fagus shoe factory established in 1911 based on a design plan by Walter Gropius is considered the first fully modernist object.
Modernism developed simultaneously in various European countries as well as in America. The advances in engineering permitted a large-scale application of glass, steel and reinforced concrete in architecture, which opened up new possibilities in shaping buildings.
The most famous manifestos of Modernism include Five Points of Architecture by Le Corbusier (1922) [2] as well as The Athens Charter (1933) [8] prepared under his supervision. Modernist architects, however, usually avoided drawing up programmes and making clear-cut assumptions. On the contrary, they relied on the concept of functionality as well as general mottos setting out the directions in design. One such slogan was “Form follows function” by L.H. Sullivan (1856-1924). The idea conveyed here is that the form should be subordinate to the function. It is the function of the building that ought to determine and define its appearance. In his Space, Time and Architecture [3], Sigfried Giedion characterised the evolution of architectural and urbanist thought since the Renaissance until the contemporary times, and demonstrated the development trends in that field.
2.2. Modernist architecture in KielceThe first modernist building was erected in Kielce
in 1933-1935. It was the Marshal Józef Piłsudski House of Physical Education and Military Training. Interesting modernist buildings continued to be constructed in Kielce after World War II, despite the unfavourable political circumstances.
The Józef Piłsudski Provincial House of Culture In 1935, the Marshal Józef Piłsudski House of
Physical Education and Military Training was opened to the public, as a result of the efforts of an association
W drugiej dekadzie XX wieku nową rodzącą się archi-tekturę zaczęto określać terminem modernistyczna. Ter-min „modernizm” ma swoje źródło w języku łacińskim „modern” i oznacza „nowoczesność” [1] (w języku fran-cuskim „moderne”, w języku niemieckim „die moderne”).
Określenie „modernizm” w odniesieniu do architek-tury ma bardzo szeroki zakres i obejmuje różnorod-ne prądy i kierunki (np. funkcjonalizm, radykalizm, sceptyczny humanizm), które zrywają ze stylami historycznymi i kładą główny nacisk na funkcjonal-ność budynku. Pierwsze budynki noszące znamiona modernizmu powstały w Niemczech i Holandii. Za pierwszy w pełni modernistyczny obiekt uznaje się powstałą w 1911 roku fabrykę obuwia Fagus projektu Waltera Gropiusa.
Modernizm rozwijał się równolegle w rożnych kra-jach Europy i w Ameryce. Rozwój inżynierii pozwa-lał na stosowanie w architekturze na szeroką skalę szkła, stali i betonu zbrojonego, co otworzyło nowe możliwości w kształtowaniu budowli.
Najbardziej znane manifesty modernizmu to: Pięć punktów nowoczesnej architektury Le Corbusiera (1922) [2] oraz przygotowana pod jego kierownic-twem Karta Ateńska (1933) [8]. Moderniści jednak generalnie unikali tworzenia formalnych programów i przyjmowania jednoznacznych założeń. Opierali się na idei funkcjonalności i ogólnych hasłach wyty-czających kierunki projektowania. Jednym z takich haseł było: „Form follows function” L.H. Sullivana (1856-1924), co oznacza, że forma powinna być pod-porządkowana funkcji. To przeznaczenie budynku powinno determinować jego wygląd. Sigfried Gie-dion w swym dziele Przestrzeń, czas, architektura [3] scharakteryzował rozwój myśli architektonicznej i urbanistycznej od okresu odrodzenia do czasów współczesnych oraz zaprezentował tendencje roz-wojowe w tej dziedzinie.
2.2. Architektura modernistyczna w KielcachPierwszy budynek modernistyczny w Kielcach
powstał w latach 1933-1935. Był to Dom Wychowa-nia Fizycznego i Przysposobienia Wojskowego im. Marszałka Józefa Piłsudskiego. Również po drugiej wojnie światowej, mimo niesprzyjającym uwarunko-waniom politycznym, powstawały w Kielcach intere-sujące budynki modernistyczne
Wojewódzki Dom Kultury im. Marszałka Józefa Piłsudskiego W roku 1935, dzięki staraniom zawiązanego spe-
cjalnie w tym celu stowarzyszenia, oddano do użyt-ku Dom Wychowania Fizycznego i Przysposobienia

141
OBRAZ WSPÓŁCZESNEJ ARCHITEKTURY KIELC NA PRZYKŁADZIE WYBRANYCH OBIEKTÓW
set up solely for this purpose. The building was designed by Edgar Aleksander Norwerth (1884-1950), a prominent architect, city planner, theorist of modernist architecture, professor of the Warsaw University of Technology and the author of the design of the Central Institute of Physical Education in Bielany, Warsaw. Norwerth proposed a unique design of a monumental modernist edifice to the citizens of Kielce.
In 1935, the gymnasium hall was ready for the public, followed by the opening of the Mirror Hall in 1936 and the cinema in 1937. The cinema room was fitted with an air-conditioning system (presumably, the first such system in Poland), the elements of which have survived to this day. The building interiors had congenial décor, and the original characteristic panels of Chęciny marble, the mosaic floors and the ceiling stucco have also remained unaffected till today.
In 1938, the Statue of the Legions’ Deed was unveiled in the square in front of the building. Professor Jan Raszka, the sculptor and a soldier of the Legions’ himself, did not manage to produce the bronze cast, and only a patinated gypsum model was placed on the marble pedestal. In 1939, the monument was destroyed by the Germans. It was recreated from scratch and unveiled in 1991. The original styling of the building, including the colours of the walls and the details of the fences, was maintained throughout the whole post-war period. A greenhouse, a parachute tower and tennis courts were additional attractive attributes of the building.
Wojskowego im. Marszałka Józefa Piłsudskiego w Kielcach. Projekt gmachu opracował Edgar Alek-sander Norwerth (1884-1950), wybitny architekt, urbanista i teoretyk architektury epoki modernizmu, profesor Politechniki Warszawskiej, autor m.in. pro-jektu Centralnego Instytutu Wychowania Fizycznego na Bielanach w Warszawie. Norweth zaproponował kielczanom wyjątkowy projekt monumentalnego, modernistycznego gmachu.
W 1935 roku oddano do użytku salę gimnastycz-ną, w 1936 – Salę Lustrzaną, a w 1937 – kino. Sala kinowa wyposażona była w klimatyzację, którą moż-na uznać za pierwszą klimatyzację w Polsce, a której elementy zachowały się do dziś, podobnie jak cha-rakterystyczne zdobienia z chęcińskich marmurów, mozaikowe posadzki i stiuki na sufitach.
W 1938 roku na skwerze przed gmachem odsło-nięto pomnik Czynu Legionowego. Rzeźbiarz – le-gionista, profesor Jan Raszka – nie zdążył wykonać odlewu w brązie i na marmurowym cokole stanął tyl-ko patynowany model gipsowy. W 1939 roku pomnik zniszczyli Niemcy. Odtworzony został od podstaw i odsłonięty w 1991 roku. Przez cały okres powo-jenny utrzymana była stylistyka budynku, łącznie z kolorystyką ścian oraz detalami ogrodzeń zewnętrz-nych. Dodatkową atrakcją budowli były: cieplarnia, wieża spadochronowa i korty tenisowe.
Gmach Domu Wychowania Fizycznego i Przyspo-sobienia Wojskowego im. Marszałka Józefa Piłsud-
Photo 1. The building of the Marshal Józef Piłsudski Provincial House of Culture in Kielce (source: www.kielc-foto.blogspot.com)Foto 1. Gmach Wojewódzkiego Domu Kultury im. Marszałka Józefa Piłsudskiego w Kielcach (źródło: www.kielce-foto.bogspot.com)

142
THE IMAGE OF THE CONTEMPORARY ARCHITECTURE OF KIELCE - A REVIEW OF THE SELECTED BUILDINGS
Photo 3. The building of the Board of the Provincial National Council in Kielce at the beginning of the 1970s (source: s-media-cache-pinimg.com)Foto 3. Gmach Prezydium Wojewódzkiej Rady Narodowej w Kielcach, początek lat 70. (źródło: s-media-cache-pinimg.com)
Photo 2. The building of a Health Centre at Wesoła 52, Kielce in the 1960s (source: końskie.fotopolska.eu)Foto 2. Gmach Przychodni Zdrowia w Kielcach, ul. Wesoła 52, lata 60. (źródło: końskie.fotopolska.eu)

143
OBRAZ WSPÓŁCZESNEJ ARCHITEKTURY KIELC NA PRZYKŁADZIE WYBRANYCH OBIEKTÓW
The building of Marshal Józef Piłsudski House of Physical Education and Military Training (the Provincial House of Culture at present) is one of the best preserved examples of interwar modernist architecture in Poland.
After the war, in the 1950s and the 1960s, significant modernist buildings were still created in Kielce, in spite of the adverse political situation.
The building at Wesoła 52A very interesting modernist building is located at
Wesoła 52. It was designed as new premises for the diocesan curia in 1958 by two Warsaw architects, Andrzej Rostkowski and Mieczysław Gliszczyński. When the building was in a core-and-shell state, it was adapted for a health centre based on the design of Edward Modrzejewski, an architect from Kielce. The body of the building used to be a fine example of modernist architecture before 1990, when further conversions commissioned by the Higher School of Insurance largely obliterated the modernist features.
The building of the Province OfficeAt the beginning of the 1960s, a team of the B.P.B.
Miastoprojekt-Kielce (Miastoprojekt-Kielce Design and Research Bureau) under the supervision of an engineer Stanisław Skibniewski developed a design plan of a building complex for the Board of the Provincial National Council.
The foundation stone of the complex of the Board of the Provincial National Council was laid on 30th June, 1967. The representative buildings were constructed by the Kieleckie Przedsiębiorstwo Budownictwa Miejskiego (Kielce Office of Urban Development).
In the autumn of 1971, after several years of construction works, the process of gradual opening of the buildings began. The three-building complex with a total area of over 20,000 m2 was put into use in stages. Building A, the main ten-storey object with a floor area of 10,000 m2, was completed in 1970. The seven-storey Building C, with a floor area of 8,000 m2, was ready in 1971, and the smallest, yet the most characteristic Building B, with a floor area of 2,000 m², was finished two years later.
The premises of the Province Office in Kielce is an interesting monumental example of modernist architecture. Peter Zumthor, the world-famous architect, appreciated its form and spoke highly of its architecture during his visit in Kielce on 1st March, 2011.
Noteworthy is the building of the coach station, which has become a symbol of the post-war
skiego (obecnie Wojewódzki Dom Kultury) jest jed-nym z najlepiej zachowanych w Polsce przykładów międzywojennej architektury modernistycznej.
Po wojnie w Kielcach, w latach 1950-1960, mimo trudnych uwarunkowań politycznych powstały jed-nak znaczące budowle architektury modernistycznej.
Gmach przy ulicy Wesołej 52Bardzo interesujący budynek modernistyczny zlo-
kalizowano przy ulicy Wesołej 52, a zaprojektowali go w 1958 roku, z przeznaczeniem na nową siedzibę kurii biskupiej, dwaj warszawscy architekci: Andrzej Rostkowski i Mieczysław Gliszczyński. Gdy budy-nek był w stanie surowym, został adaptowany według projektu kieleckiego architekta Edwarda Modrze-jewskiego na przychodnię zdrowia. Bryła budynku stanowiła znakomity przykład architektury moder-nistycznej; stanowiła, ponieważ późniejsze adapta-cje (Wyższa Szkoła Ubezpieczeń, 1990) walory te w znacznym stopniu zniweczyły.
Gmach Urzędu WojewódzkiegoNa początku lat sześćdziesiątych zespół pracow-
ni B.P.B. Miastoprojekt-Kielce pod kierunkiem inż. Stanisława Skibniewskiego opracował projekt kom-pleksu gmachów Prezydium Wojewódzkiej Rady Na-rodowej.
Kamień węgielny pod budowę kompleksu budyn-ków PWRN uroczyście wmurowano 30 czerwca 1967 roku. Reprezentacyjne budynki wzniosło Kie-leckie Przedsiębiorstwo Budownictwa Miejskiego.
Po kilkuletnim okresie budowy, jesienią 1971 roku, rozpoczęto sukcesywne zasiedlanie budynków. Skła-dający się z trzech gmachów kompleks, o łącznej powierzchni ponad 20 tys. m2, oddawano do użytku stopniowo. Budynek główny A, o dziesięciu kondy-gnacjach i ponad 10 tys. m2 powierzchni użytkowej, ukończono w 1970 roku, siedmiokondygnacyjny budynek C, z 8 tys. m2 powierzchni – w 1971 roku, a dwa lata później – najmniejszy, ale najbardziej charakterystyczny budynek B z powierzchnią ponad 2 tys. m2.
Gmach Urzędu Wojewódzkiego w Kielcach sta-nowi interesujący monumentalny przykład archi-tektury modernistycznej. Bardzo pozytywnie o ar-chitekturze kompleksu wyraził się światowej sławy architekt Peter Zumthor podczas wizyty w Kielcach (marzec 2011).
Na uwagę zasługuje również gmach dworca PKS, który z woli mieszkańców stał się symbolem powo-

144
THE IMAGE OF THE CONTEMPORARY ARCHITECTURE OF KIELCE - A REVIEW OF THE SELECTED BUILDINGS
architecture of Kielce by the will of the citizens. More information about the fate of the building, which was entered in 2013 on the list of monuments in [7].
The Kielce Centre of CultureIn the early 1970s, a multifunctional building was
designed for the Stefan Żeromski Theatre by the architect Daniel Olędzki and the specialists from Miastoprojekt in Gdynia. It is a twin-project of the Music Theatre in Gdynia. The interior of the centre was designed by local fine artists under the supervision of Andrzej Grabiwoda. The bas-reliefs and artistic details were created by Adam Wolski. The construction of the theatre complex began in 1975. It should be noted that the choice of the location of the building was highly inappropriate. The beginning of the construction works brought about the necessity of demolishing the well-preserved Leonard Building, which was registered as a heritage property.
The completion of the new theatre building was planned for 1980. In that very year, however, the construction works were put on hold due to the economic and political crisis. The works were resumed, and in 1992, the theatre building was
jennej architektury Kielc. Więcej informacji o losach budynku, który został wpisany w roku 2013 na listę zabytków w [7].
Gmach Kieleckiego Centrum KulturyWielofunkcyjny gmach dla teatru im. Stefana Że-
romskiego na początku lat 70. zaprojektował arch. Daniel Olędzki wraz ze specjalistami z „Miastopro-jektu” w Gdyni. Jest to bliźniaczy projekt Teatru Mu-zycznego w Gdyni. Wnętrze obiektu zaprojektowali kieleccy artyści plastycy pod kierunkiem Andrzeja Grabiwody. Płaskorzeźby i artystyczne detale wy-konał Adam Wolski. W roku 1975 przystąpiono do budowy kompleksu teatralnego. Należy zaznaczyć, iż lokalizacja gmachu została wybrana niewłaściwie. Rozpoczęcie budowy wiązało się z koniecznością wyburzenia dobrze zachowanego Gmachu Leonarda, który był wpisany do rejestru zabytków.
Zakończenie budowy nowego gmachu teatru pla-nowano na rok 1980. Jednak w tymże roku nastąpiło wstrzymanie robót budowlanych ze względu na kryzys ekonomiczno-polityczny. Roboty budowlane zostały wznowione i w roku 1992 nastąpiło przemianowanie
Photo 4. The coach stadion, see [7] (source: uwas.edu.pl)Foto 4. Budynek dworca PKS, patrz [7] (źródło: uwas.edu.pl)
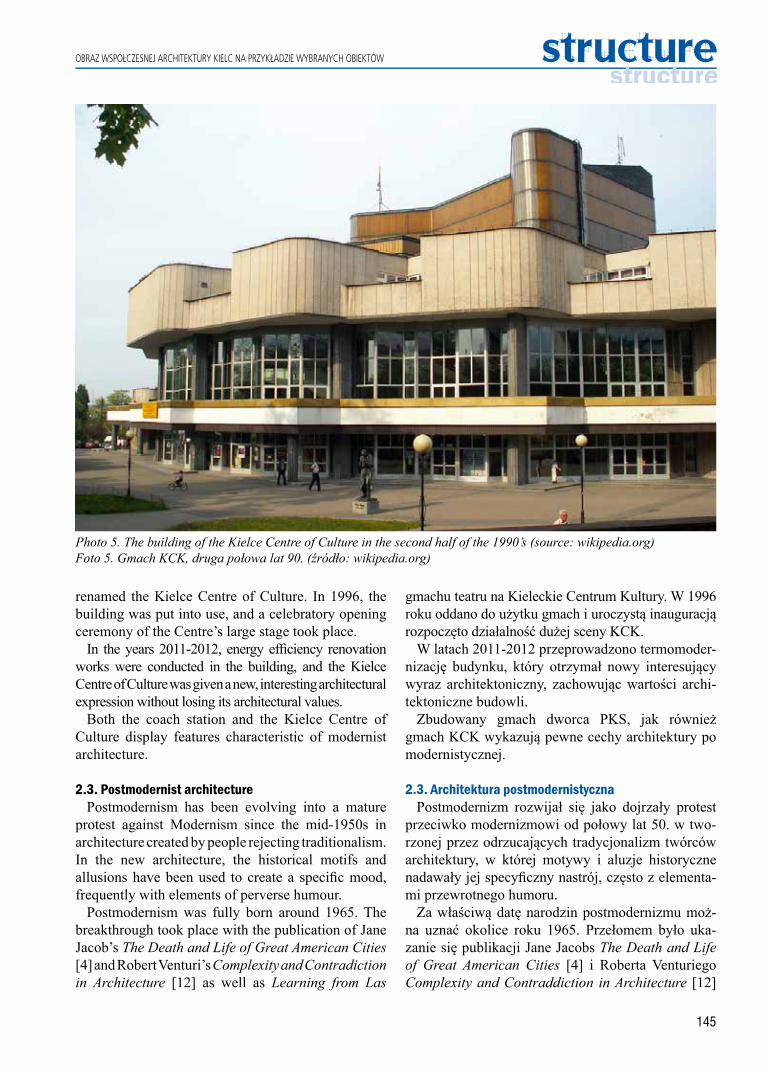
145
OBRAZ WSPÓŁCZESNEJ ARCHITEKTURY KIELC NA PRZYKŁADZIE WYBRANYCH OBIEKTÓW
renamed the Kielce Centre of Culture. In 1996, the building was put into use, and a celebratory opening ceremony of the Centre’s large stage took place.
In the years 2011-2012, energy efficiency renovation works were conducted in the building, and the Kielce Centre of Culture was given a new, interesting architectural expression without losing its architectural values.
Both the coach station and the Kielce Centre of Culture display features characteristic of modernist architecture.
2.3. Postmodernist architecturePostmodernism has been evolving into a mature
protest against Modernism since the mid-1950s in architecture created by people rejecting traditionalism. In the new architecture, the historical motifs and allusions have been used to create a specific mood, frequently with elements of perverse humour.
Postmodernism was fully born around 1965. The breakthrough took place with the publication of Jane Jacob’s The Death and Life of Great American Cities [4] and Robert Venturi’s Complexity and Contradiction in Architecture [12] as well as Learning from Las
gmachu teatru na Kieleckie Centrum Kultury. W 1996 roku oddano do użytku gmach i uroczystą inauguracją rozpoczęto działalność dużej sceny KCK.
W latach 2011-2012 przeprowadzono termomoder-nizację budynku, który otrzymał nowy interesujący wyraz architektoniczny, zachowując wartości archi-tektoniczne budowli.
Zbudowany gmach dworca PKS, jak również gmach KCK wykazują pewne cechy architektury po modernistycznej.
2.3. Architektura postmodernistycznaPostmodernizm rozwijał się jako dojrzały protest
przeciwko modernizmowi od połowy lat 50. w two-rzonej przez odrzucających tradycjonalizm twórców architektury, w której motywy i aluzje historyczne nadawały jej specyficzny nastrój, często z elementa-mi przewrotnego humoru.
Za właściwą datę narodzin postmodernizmu moż-na uznać okolice roku 1965. Przełomem było uka-zanie się publikacji Jane Jacobs The Death and Life of Great American Cities [4] i Roberta Venturiego Complexity and Contraddiction in Architecture [12]
Photo 5. The building of the Kielce Centre of Culture in the second half of the 1990’s (source: wikipedia.org)Foto 5. Gmach KCK, druga połowa lat 90. (źródło: wikipedia.org)

146
THE IMAGE OF THE CONTEMPORARY ARCHITECTURE OF KIELCE - A REVIEW OF THE SELECTED BUILDINGS
Vegas [13]. Modernism was criticised for its lack of expression and sensitivity. The growing criticism of Modernism, and Brutalism above all, found its culmination on 15th July 1972, when a complex of multi-family residential blocks made up of prefab large panels, designed by a Japanese architect, Minoru Yamasaki, less than 20 years earlier, was blown up in Saint Louis, Missouri. In textbooks, this act is still regarded as a symbolic end of Modernism – the burial of Le Corbusier’s concept of “a dwelling machine”.
Postmodernist architecture has no uniform ideology. It is characterised by parallel tendencies to set a building in context, frequently by using eclectic references to both historical forms and stylistic pluralism. The major postmodernist currents in philosophy say that reality is unrecognisable and there is nothing objective around. Everything, including scientific cognition, depends on the individuals experiencing existential fear. Therefore, postmodernist architecture is characterised by pluralism and complexity. Architecture, as maintained by postmodernists, does not have to succumb to the spirit of time or the technical progress. Above all, it should depend on the context, the mood and, in the end, the personal preferences of the architect and the investor.
Postmodernism is an architectural style that refers to the archetype and reminiscence. The modernist rebellion against the historical tradition has given way to the discovery that tradition itself is an inexhaustible source from which various motifs can be drawn. However, the references to early architecture do not perform the same role as they did in the historical models. Frequently, they are but artificial add-ons to a building. Postmodernism is not a type of historicism, as it usually does not imitate one particular style, but freely blends the adopted motifs with the creators’ own ideas as well as the determinants dictated by the current function. It is, therefore, sometimes referred to as Mannerism of Modernism.
The façade of a postmodernist building makes it significant, frequently giving it a symbolic meaning, and places the building within an appropriate typology without relating directly to the location and layout of the function. Functionalism is discarded, and architecture is treated as art detached from reality. Ornament and symbol as well as symmetry are regarded with a favourable eye. Irony, surprise and absurdity become the means of shaping architecture.
The contemporary, postmodernist architecture is also a pro-ecological trend [5], [6], which is also reflected in the examples of contemporary architecture
oraz Learning from Las Vegas [13]. Modernizmowi zarzucano brak wyrazu i bezduszność. Narastająca krytyka modernizmu, a zwłaszcza brutalizmu, miała swą kulminację 15 lipca 1972 roku (w Saint Louis wysadzono w powietrze bloki z wielkiej płyty, zbu-dowane zaledwie niecałe 20 lat wcześniej przez ja-pońskiego architekta Minoru Yamasaki). Do dzisiaj w podręcznikach uważa się ten fakt za symboliczny koniec modernizmu – moment pogrzebania idei „ma-szyny do mieszkania” Le Corbusiera.
Architektura postmodernistyczna nie posiada jed-nolitej ideologii. Występują w niej równolegle ten-dencje do wpisania obiektu w kontekst, często przy eklektyzującym nawiązywaniu do form historycz-nych, jak i do stylistycznego pluralizmu. Główne prądy postmodernistyczne w filozofii twierdziły, że rzeczywistość jest nierozpoznawalna i nie ma nic obiektywnego, wszystko (w tym poznanie naukowe) zależy od odczuwających lęk egzystencjonalny jed-nostek. Dlatego też architektura postmodernistycz-na cechuje się pluralizmem i złożonością. Zdaniem postmodernistów architektura nie musi ulegać du-chowi czasu i postępowi technicznemu, zaś przede wszystkim powinna zależeć od kontekstu, nastro-ju czy wreszcie osobistych upodobań architekta i inwestora.
Postmodernizm to styl architektoniczny odwołują-cy się do archetypu i reminiscencji. Modernistyczny bunt wobec tradycji historycznej został zastąpiony odkryciem, że jest ona niewyczerpanym źródłem, z którego można czerpać rozmaite motywy. Cytaty z architektury dawnej nie pełnią jednak tej samej roli, co w historycznych wzorcach, często są do budynku sztucznie dołączone. Postmodernizm nie jest rodza-jem historyzmu, gdyż nie naśladuje zazwyczaj kon-kretnego stylu, lecz swobodnie łączy zapożyczone motywy z własnymi pomysłami twórców i uwarun-kowaniami współczesnej funkcji. Niekiedy określa się go jako manieryzm modernizmu.
Fasada budynku postmodernistycznego nadaje mu znaczenia (nieraz symbolicznego) i umieszcza go we właściwej typologii, nie ma zaś bezpośredniego związku z rozmieszczeniem funkcji. Funkcjonalizm jest odrzucany, architektura jest traktowana jako sztu-ka oderwana od realiów. Ornament i symbol, a także symetria wracają do łask. Środkami kształtowania ar-chitektury stają się ironia, zaskoczenie, absurd.
Architektura współczesna, postmodernistyczna to również nurt proekologiczny [5], [6], znajdujący odzwierciedlenie w realizacja architektury współ-czesnej również w Kielcach. Problem zastosowania
147
OBRAZ WSPÓŁCZESNEJ ARCHITEKTURY KIELC NA PRZYKŁADZIE WYBRANYCH OBIEKTÓW
in Kielce. The issue of solar energy application and its impact on contemporary architecture was presented by S. Wehle-Strzelecka [10], [11].
2.4. The architecture of Kielce after Modernism As it has been pointed out, the buildings that were
constructed in Kielce in the second half of the 1970s, the 1980s and afterwards (the coach station, the Kielce Centre of Culture) already displayed certain features of postmodernist architecture.
At the beginning of the 21st century, several interesting buildings, which can be classified as post-modernist, were created in Kielce. The qualitative change of architecture was related to the transformations of the political and the economic systems that had taken place in our country. The newly designed and constructed buildings were financed by both private investors and public institutions. Large areas of the city were revitalised with the support of EU funds. In this analysis of the architecture of Kielce after Modernism the focus has been laid on several selected buildings influencing the architectural value of the city.
The Philharmonic HouseThe competition for a detailed architectural design
of the philharmonic house in Kielce at Żeromskiego 12 was settled in May 2006. The competition was won by the PIW-PAW Architekci Sp. z o.o. from Gdańsk. By the end of November 2007, a building permit design along with an approximate budget estimate was provided so that an application for financial aid from the UE could be prepared.
In October 2009, a construction works contract was signed for the investment project under the title Construction of the International Centre of Cultures in Kielce. The contractor of the new seat of the Oskar Kolberg Świętokrzyska Philharmonic Orchestra was selected by open tender procedure. The most favourable tender was provided by a consortium of companies, UNIBEP S.A. from Bielsk Podlaski and a partner of the consortium, UNIMAX Sp. z o.o. from Kielce.
The construction of the building lasted from 2009 to 2012. The grand opening of the International Centre of Cultures, the seat of the Oskar Kolberg Świętokrzyska Philharmonic Orchestra, took place on 19th January 2012. The project covers the area of 3,823 m², and the footprint is 3,358 m². The building houses a concert hall with 515 seats and a stage for 300 performers, a chamber music hall with 200 seats, a 150-seat rehearsal room sectioned from the foyer and a conference room with 50 seats. Within the building, there is also an
energii słonecznej i jej wpływ na formę architektury współczesnej zaprezentowała S. Wehle-Strzelecka [10], [11].
2.4. Architektura po modernizmie w Kielcach Jak już wspomniano, obiekty realizowane w Kiel-
cach w drugiej połowie lat 70. i 80. i kontynuowane w okresie późniejszym (dworzec PKS, KCK) posiada-ły już pewne cechy architektury postmodernistycznej.
Na początku XXI wieku powstało w Kielcach kilka interesujących budowli, które możemy zaliczyć do architektury po modernistycznej. Zmiana jakościo-wa architektury wiązała się ze zmianami ustrojowo--ekonomicznymi, jakie miały miejsce w naszym kra-ju. Powstawały obiekty finansowane zarówno przez inwestorów prywatnych, jak i obiekty finansowane przez instytucje publiczne. Znaczne obszary miasta zostały poddane rewitalizacji przy wsparciu fundu-szami europejskimi. Analizując architekturę w Kiel-cach po modernizmie, autor ograniczył się do kilku wybranych obiektów mających wpływ na walory ar-chitektoniczne miasta.
Gmach filharmoniiW maju 2006 r. rozstrzygnięto Konkurs na opra-
cowanie szczegółowej koncepcji architektonicznej budynku Filharmonii w Kielcach przy ul. Żeromskie-go 12. Konkurs wygrała pracownia PIW-PAW AR-CHITEKCI Sp. z o.o. z Gdańska. Z końcem listopada 2007 roku opracowany został projekt budowlany wraz z kosztorysem szacunkowym, który pozwoli przygoto-wać wniosek o przyznanie środków unijnych.
W październiku 2009 roku została podpisana umo-wa o roboty budowlane dla inwestycji pod nazwą Budowa Międzynarodowego Centrum Kultur w Kiel-cach – nowa siedziba Filharmonii Świętokrzyskiej im. Oskara Kolberga z wykonawcą wyłonionym w trybie przetargu nieograniczonego. Najkorzyst-niejszą ofertę złożyło konsorcjum firm UNIBEP S.A z Bielska-Podlaskiego i UNIMAX Sp. z o.o. z Kielc – partner konsorcjum.
Budowa gmachu trwała od roku 2009 do 2012. 19 stycznia 2012 roku nastąpiło uroczyste otwarcie Międzynarodowego Centrum Kultur – nowej siedzi-by Filharmonii Świętokrzyskiej im. Oskara Kolber-ga. Inwestycja zajmuje teren o powierzchni 3 823 m², powierzchnia zabudowy obejmuje 3 358 m². W budynku znajduje się 515 miejsc na widowni, es-trada dla 300 wykonawców, sala kameralna na 200 miejsc, sala prób – wydzielona z foyer – 150 miejsc, sala konferencyjna – 50 miejsc. Wewnątrz obiektu
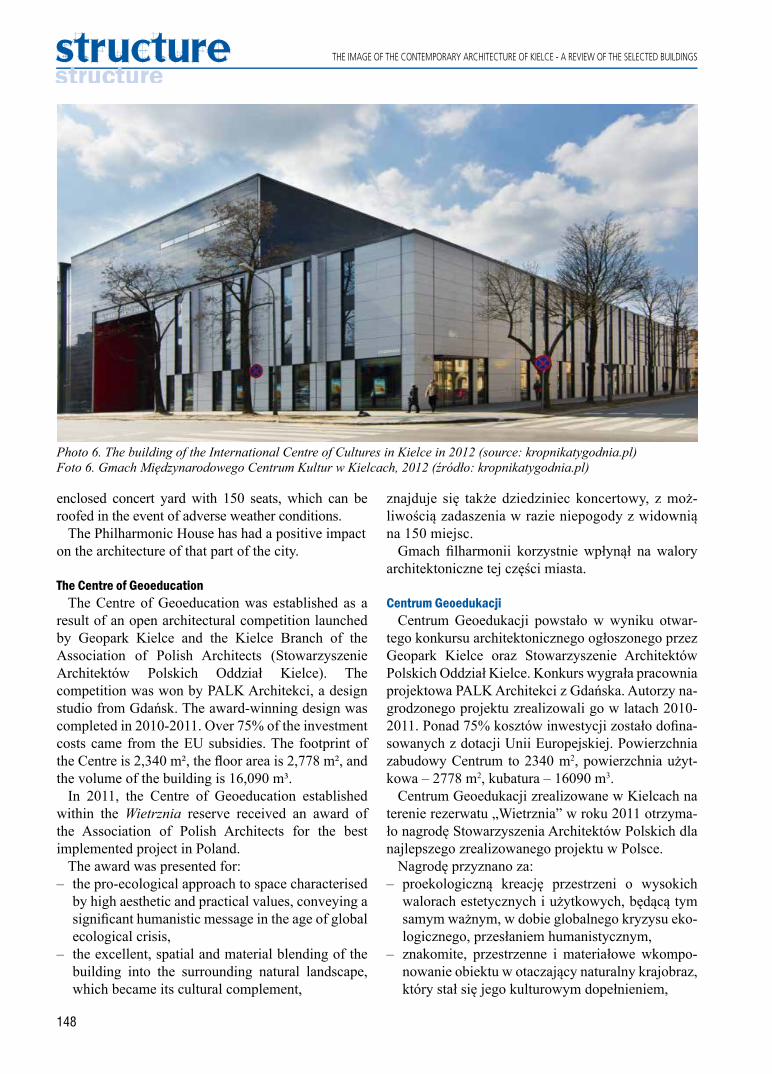
148
THE IMAGE OF THE CONTEMPORARY ARCHITECTURE OF KIELCE - A REVIEW OF THE SELECTED BUILDINGS
enclosed concert yard with 150 seats, which can be roofed in the event of adverse weather conditions.
The Philharmonic House has had a positive impact on the architecture of that part of the city.
The Centre of GeoeducationThe Centre of Geoeducation was established as a
result of an open architectural competition launched by Geopark Kielce and the Kielce Branch of the Association of Polish Architects (Stowarzyszenie Architektów Polskich Oddział Kielce). The competition was won by PALK Architekci, a design studio from Gdańsk. The award-winning design was completed in 2010-2011. Over 75% of the investment costs came from the EU subsidies. The footprint of the Centre is 2,340 m², the floor area is 2,778 m², and the volume of the building is 16,090 m³.
In 2011, the Centre of Geoeducation established within the Wietrznia reserve received an award of the Association of Polish Architects for the best implemented project in Poland.
The award was presented for:– the pro-ecological approach to space characterised
by high aesthetic and practical values, conveying a significant humanistic message in the age of global ecological crisis,
– the excellent, spatial and material blending of the building into the surrounding natural landscape, which became its cultural complement,
znajduje się także dziedziniec koncertowy, z moż-liwością zadaszenia w razie niepogody z widownią na 150 miejsc.
Gmach filharmonii korzystnie wpłynął na walory architektoniczne tej części miasta.
Centrum Geoedukacji Centrum Geoedukacji powstało w wyniku otwar-
tego konkursu architektonicznego ogłoszonego przez Geopark Kielce oraz Stowarzyszenie Architektów Polskich Oddział Kielce. Konkurs wygrała pracownia projektowa PALK Architekci z Gdańska. Autorzy na-grodzonego projektu zrealizowali go w latach 2010-2011. Ponad 75% kosztów inwestycji zostało dofina-sowanych z dotacji Unii Europejskiej. Powierzchnia zabudowy Centrum to 2340 m2, powierzchnia użyt-kowa – 2778 m2, kubatura – 16090 m3.
Centrum Geoedukacji zrealizowane w Kielcach na terenie rezerwatu „Wietrznia” w roku 2011 otrzyma-ło nagrodę Stowarzyszenia Architektów Polskich dla najlepszego zrealizowanego projektu w Polsce.
Nagrodę przyznano za:– proekologiczną kreację przestrzeni o wysokich
walorach estetycznych i użytkowych, będącą tym samym ważnym, w dobie globalnego kryzysu eko-logicznego, przesłaniem humanistycznym,
– znakomite, przestrzenne i materiałowe wkompo-nowanie obiektu w otaczający naturalny krajobraz, który stał się jego kulturowym dopełnieniem,
Photo 6. The building of the International Centre of Cultures in Kielce in 2012 (source: kropnikatygodnia.pl)Foto 6. Gmach Międzynarodowego Centrum Kultur w Kielcach, 2012 (źródło: kropnikatygodnia.pl)
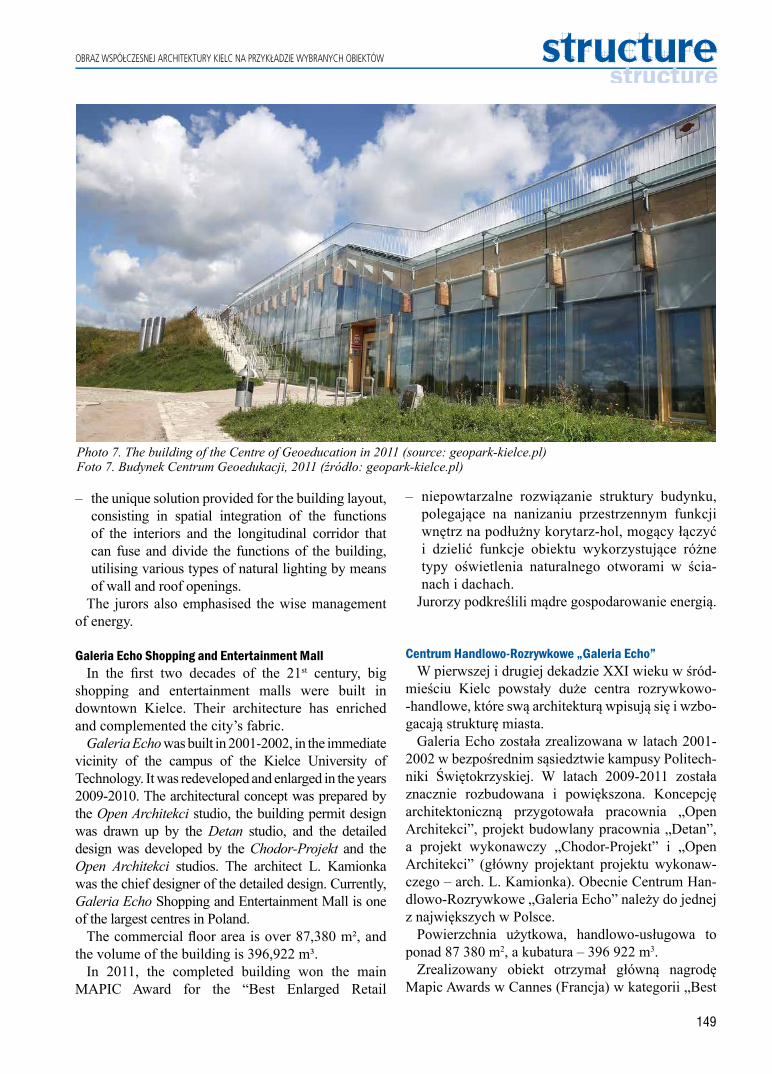
149
OBRAZ WSPÓŁCZESNEJ ARCHITEKTURY KIELC NA PRZYKŁADZIE WYBRANYCH OBIEKTÓW
– niepowtarzalne rozwiązanie struktury budynku, polegające na nanizaniu przestrzennym funkcji wnętrz na podłużny korytarz-hol, mogący łączyć i dzielić funkcje obiektu wykorzystujące różne typy oświetlenia naturalnego otworami w ścia-nach i dachach.
Jurorzy podkreślili mądre gospodarowanie energią.
Centrum Handlowo-Rozrywkowe „Galeria Echo”W pierwszej i drugiej dekadzie XXI wieku w śród-
mieściu Kielc powstały duże centra rozrywkowo--handlowe, które swą architekturą wpisują się i wzbo-gacają strukturę miasta.
Galeria Echo została zrealizowana w latach 2001-2002 w bezpośrednim sąsiedztwie kampusy Politech-niki Świętokrzyskiej. W latach 2009-2011 została znacznie rozbudowana i powiększona. Koncepcję architektoniczną przygotowała pracownia „Open Architekci”, projekt budowlany pracownia „Detan”, a projekt wykonawczy „Chodor-Projekt” i „Open Architekci” (główny projektant projektu wykonaw-czego – arch. L. Kamionka). Obecnie Centrum Han-dlowo-Rozrywkowe „Galeria Echo” należy do jednej z największych w Polsce.
Powierzchnia użytkowa, handlowo-usługowa to ponad 87 380 m2, a kubatura – 396 922 m3.
Zrealizowany obiekt otrzymał główną nagrodę Mapic Awards w Cannes (Francja) w kategorii „Best
– the unique solution provided for the building layout, consisting in spatial integration of the functions of the interiors and the longitudinal corridor that can fuse and divide the functions of the building, utilising various types of natural lighting by means of wall and roof openings.
The jurors also emphasised the wise management of energy.
Galeria Echo Shopping and Entertainment MallIn the first two decades of the 21st century, big
shopping and entertainment malls were built in downtown Kielce. Their architecture has enriched and complemented the city’s fabric.
Galeria Echo was built in 2001-2002, in the immediate vicinity of the campus of the Kielce University of Technology. It was redeveloped and enlarged in the years 2009-2010. The architectural concept was prepared by the Open Architekci studio, the building permit design was drawn up by the Detan studio, and the detailed design was developed by the Chodor-Projekt and the Open Architekci studios. The architect L. Kamionka was the chief designer of the detailed design. Currently, Galeria Echo Shopping and Entertainment Mall is one of the largest centres in Poland.
The commercial floor area is over 87,380 m², and the volume of the building is 396,922 m³.
In 2011, the completed building won the main MAPIC Award for the “Best Enlarged Retail
Photo 7. The building of the Centre of Geoeducation in 2011 (source: geopark-kielce.pl)Foto 7. Budynek Centrum Geoedukacji, 2011 (źródło: geopark-kielce.pl)
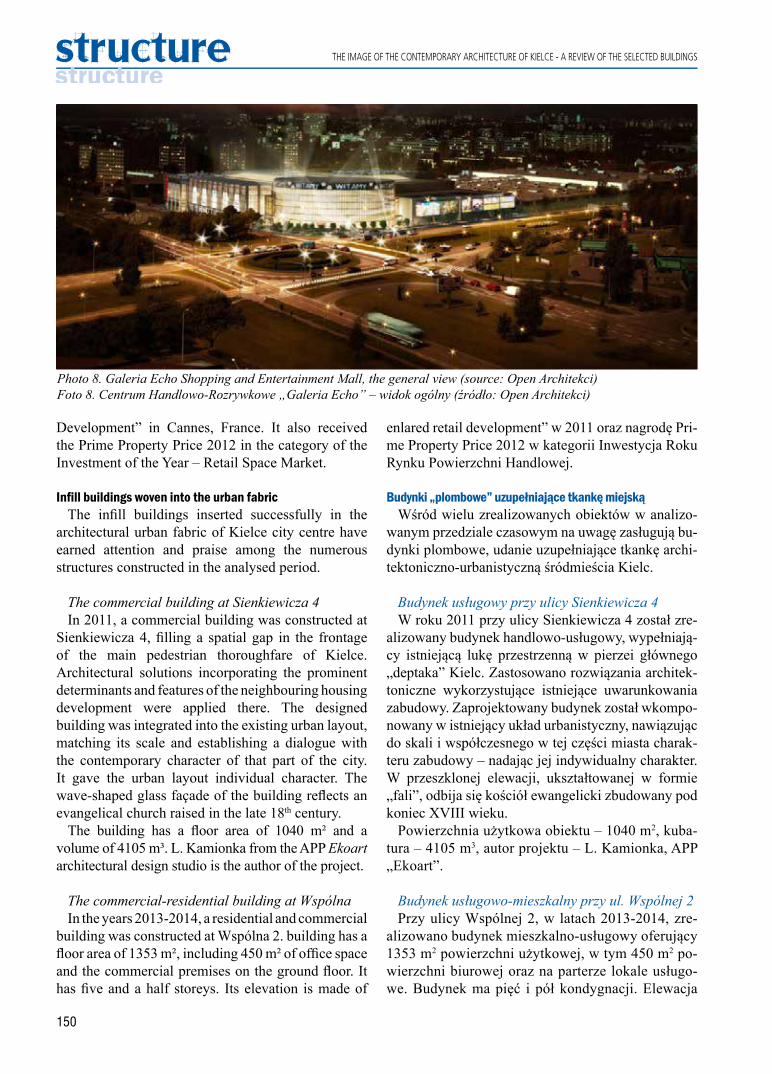
150
THE IMAGE OF THE CONTEMPORARY ARCHITECTURE OF KIELCE - A REVIEW OF THE SELECTED BUILDINGS
Development” in Cannes, France. It also received the Prime Property Price 2012 in the category of the Investment of the Year – Retail Space Market.
Infill buildings woven into the urban fabricThe infill buildings inserted successfully in the
architectural urban fabric of Kielce city centre have earned attention and praise among the numerous structures constructed in the analysed period.
The commercial building at Sienkiewicza 4In 2011, a commercial building was constructed at
Sienkiewicza 4, filling a spatial gap in the frontage of the main pedestrian thoroughfare of Kielce. Architectural solutions incorporating the prominent determinants and features of the neighbouring housing development were applied there. The designed building was integrated into the existing urban layout, matching its scale and establishing a dialogue with the contemporary character of that part of the city. It gave the urban layout individual character. The wave-shaped glass façade of the building reflects an evangelical church raised in the late 18th century.
The building has a floor area of 1040 m² and a volume of 4105 m³. L. Kamionka from the APP Ekoart architectural design studio is the author of the project.
The commercial-residential building at WspólnaIn the years 2013-2014, a residential and commercial
building was constructed at Wspólna 2. building has a floor area of 1353 m², including 450 m² of office space and the commercial premises on the ground floor. It has five and a half storeys. Its elevation is made of
enlared retail development” w 2011 oraz nagrodę Pri-me Property Price 2012 w kategorii Inwestycja Roku Rynku Powierzchni Handlowej.
Budynki „plombowe” uzupełniające tkankę miejskąWśród wielu zrealizowanych obiektów w analizo-
wanym przedziale czasowym na uwagę zasługują bu-dynki plombowe, udanie uzupełniające tkankę archi-tektoniczno-urbanistyczną śródmieścia Kielc.
Budynek usługowy przy ulicy Sienkiewicza 4W roku 2011 przy ulicy Sienkiewicza 4 został zre-
alizowany budynek handlowo-usługowy, wypełniają-cy istniejącą lukę przestrzenną w pierzei głównego „deptaka” Kielc. Zastosowano rozwiązania architek-toniczne wykorzystujące istniejące uwarunkowania zabudowy. Zaprojektowany budynek został wkompo-nowany w istniejący układ urbanistyczny, nawiązując do skali i współczesnego w tej części miasta charak-teru zabudowy – nadając jej indywidualny charakter. W przeszklonej elewacji, ukształtowanej w formie „fali”, odbija się kościół ewangelicki zbudowany pod koniec XVIII wieku.
Powierzchnia użytkowa obiektu – 1040 m2, kuba-tura – 4105 m3, autor projektu – L. Kamionka, APP „Ekoart”.
Budynek usługowo-mieszkalny przy ul. Wspólnej 2 Przy ulicy Wspólnej 2, w latach 2013-2014, zre-
alizowano budynek mieszkalno-usługowy oferujący 1353 m2 powierzchni użytkowej, w tym 450 m2 po-wierzchni biurowej oraz na parterze lokale usługo-we. Budynek ma pięć i pół kondygnacji. Elewacja
Photo 8. Galeria Echo Shopping and Entertainment Mall, the general view (source: Open Architekci)Foto 8. Centrum Handlowo-Rozrywkowe „Galeria Echo” – widok ogólny (źródło: Open Architekci)

151
OBRAZ WSPÓŁCZESNEJ ARCHITEKTURY KIELC NA PRZYKŁADZIE WYBRANYCH OBIEKTÓW
graphite titanium-zinc sheet, and the coloured glass panels of the balcony balustrades have an animating and leavening effect on the façade. The ground floor front is clad with bright sandstone and wood. The project was created by the architectural studio, Kamiński Bojarowicz Architekci.
3. SUMMARYThe contemporary architecture in Kielce is varied and
interesting. The city’s fabric holds significant modernist and postmodernist buildings. The Józef Piłsudski Provincial House of Culture (current name), built in the interwar period, is a pearl of Modernism. Time has not tarnished the architectural values of this building. However, not all refurbishment and redevelopment works carried out in modernist buildings have been successful. The character of some buildings has been destroyed irreversibly, e.g., the building at Wesoła 52. On the other hand, the coach station is an example of a successful design. This characteristic and original structure has been widely accepted by the citizens of Kielce, and it has become a permanent landmark in the panorama of the city.
Photo 9. The commercial-residential building at Sienkiewicza 4 (source: photograph from the author’s private collection)Foto 9. Budynek usługowo-mieszkalny przy ulicy Sienkiewicza 4 (źródło: zdjęcie własne)
została wykonana z grafitowej blachy tytanowo--cynkowej, a dodatkowo rozświetlają ją balustrady balkonów wykonane z kolorowego szkła. Front par-teru pokryty został jasnym piaskowcem i drewnem. Autorzy projektu – pracownia „Kamiński Bojaro-wicz Architekci”.
3. PODSUMOWANIEArchitektura współczesna w Kielcach jest zróżni-
cowana i interesująca. W tkance miasta znajdują się znaczące obiekty architektury modernistycznej i post-modernistycznej. Perłą modernizmu jest zrealizowany w okresie międzywojennym Wojewódzki Dom Kultu-ry im. Józefa Piłsudskiego (nazwa obecna). Czas nie zaszkodził walorom architektonicznym tej budowli. Nie wszystkie jednak prace remontowo-modernistycz-ne budynków modernistycznych były udane, niektó-re wręcz zniszczyły ich walory (np. budynek przy ul. Wesołej 52). Dworzec PKS to bardzo udana realizacja, charakterystyczna i oryginalna budowla, która została powszechnie zaakceptowana przez mieszkańców mia-sta i w sposób trwały wpisała się w panoramę miasta.
Photo 10. The commercial-residential building at Wspólna 2 (source: kielce.wyborcza.pl)Foto 10. Budynek usługowo mieszkalny przy ulicy Wspól-nej 2 (źródło: kielce.wyborcza.pl)

152
THE IMAGE OF THE CONTEMPORARY ARCHITECTURE OF KIELCE - A REVIEW OF THE SELECTED BUILDINGS
The Kielce Centre of Culture is another building that has effectively grown into the city’s fabric. Completed already in the 21st century with the support of EU funds, the buildings such as the International Centre of Cultures in Kielce, based in the Oskar Kolberg Philharmonic House, or the Centre of Geoeducation constructed in the Wietrznia reserve are structures that have significantly improved the architectural attractiveness of the city. Private investors are increasingly carrying out projects of interesting examples of commercial and residential architecture. Such projects are frequently awarded by international bodies, e.g., Galeria Echo Shopping and Entertainment Mall.
When assessing the contemporary architecture of Kielce, it should be said that the failure to modernise the former synagogue and convert it into a centre of cultural and religious encounters is a powerful loss of opportunity. The design of the development was prepared by the world-renowned Swiss architect Peter Zumthor, and the building could have become a genuine pearl and a tourist attraction.
Bearing in mind the fact that since 2008 the Kielce University of Technology has been running a course in Architecture with a view to educating prospective architects, both the contemporary and the future architecture of Kielce should be approached with optimism. The architectural environment in Kielce will play a significant role in the shaping of the architectural character of Kielce in the nearest future.
Również gmach Kieleckiego Centrum Kultury udanie wpisał się w tkankę miasta. Zrealizowane już w XXI wieku, przy udziale funduszy europejskich, budowle, takie jak Międzynarodowe Centrum Kultur w Kielcach z siedzibą Filharmonii Świętokrzyskiej im. Oskara Kolberga czy Centrum Geoedukacji wybudowane na terenie rezerwatu „Wietrznia”, są budowlami znaczą-cymi, podnoszącymi walory architektoniczne miasta. Inwestorzy prywatni z coraz większym rozmachem realizują ciekawe obiekty architektury usługowej, han-dlowej czy mieszkalnej. Realizacje te są niejednokrot-nie nagradzane przez międzynarodowe gremia (np. Centrum Handlowo-Rozrywkowe „Galeria Echo).
Oceniając architekturę współczesną w Kielcach, należy wyrazić żal, że nie doszło do planowanej re-alizacji modernizacji budynku po dawnej synagodze na centrum spotkań kultur i religii zaprojektowanej przez światowej sławy szwajcarskiego architekta Pe-tera Zumthora. Obiekt ten mógłby być prawdziwą perłą i atrakcją turystyczną.
Na architekturę współczesną Kielc, jak i na tę zre-alizowaną w przyszłości, należy patrzeć z optymi-zmem, mając na uwadze m.in. fakt kształcenia (od roku 2008) na kieleckiej wyższej uczelni – Politech-nice Świętokrzyskiej – przyszłych architektów. Kie-lecki ośrodek architektoniczny w przyszłości, już tej najbliższej, będzie odgrywał znaczącą rolę w kształ-towaniu oblicza architektonicznego Kielc.
Acknowledgments:This work was supported by Kielce University of Technology, Grant No. 02.0.07.00/2.01.01.01.0020 MNSP.BKAU.15.002.
Podziękowania:Praca była finansowana przez Politechnikę Świętokrzyską, grant nr 02.0.07.00/2.01.01.01.0020 MNSP.BKAU.15.002.
References[1] Dictionarium latino-polonicum, polonico-latinum, Słownik polsko-łaciński, łacińsko-polski. Level Trading, 2013.[2] Five Points for a New Architecture, Le Corbusier i Pierre Jeanneret, in: Bau und Wohnen, Stuttgart, Fr. Wederkind & Co., 1927.[3] Giedion S., Przestrzeń, czas, architektura. PWN, 1968.[4] Jacobs J., The Death and Life of Great American Cities, Vintage, 2000.[5] Kamionka L., Architektura zrównoważona i jej standardy na przykładzie wybranych metod oceny. Monografie,
Studia, Rozprawy M30, Kielce University of Technology, Kielce 2012.[6] Kamionka L. (red.), Projektowanie zrównoważone jako paradygmat kształtowania przestrzeni w XXI wieku.
Monografie, Architektura 3. Kielce University of Technology, Kielce 2016.[7] Kamionka L., The issue of transience in architecture and the problems of conservation protection in the selected
modernist buildings. Structure and Enivironment, No 1/2018, vol 10, DOI:10.30540/sae-2018-004, pp. 39-49[8] Karta ateńska: urbanistyka C.I.A.M. Grupa CIAM Francja, translated by Krystyna Szeranos, Wydawnictwo Koło
Naukowe Wydziału Architektury Wnętrz ASP.[9] Ornement et crime in „Cahiers d’aujourd’hui” no. 5/1913, (essay by Adolf Loos, based on the lecture given on 21
January, 1910 in Vienna).[10] Wehle-Strzelecka S., Architektura słoneczna w zrównoważonym środowisku mieszkaniowym, Monografia, 312, PK ,
Kraków 2004.[11] Wehle-Strzelecka S., Energia słońca w kształtowaniu środowiska mieszkaniowego – ewolucja koncepcji na przestrzeni
wieków, Wydawnictwa Politechniki Krakowskiej, Kraków 2014.[12] Venturi R., Complexity and Contradiction in Architecture. The Museum of Modern Art. Papers on Architecture. 1966.[13] Venturi R., Learning from Las Vegas. MIT Press Ltd., 1977.
153
1. INTRODUCTIONHousing is one of the most important social and
economic problems. It has become a priority task, as well as the creation of modern environment, which would enable a Sustainable Development. It is obvious now, that the solution of Housing and Urban Development problems is impossible without new approaches and methods of designing, development, management, and co-ordination of architectural, engineering, technological and industrial decisions. Architecture-&-Building Systems (ABSs) play here the main role. This term is used to refer to a system of coordinated architectural, constructive, and technological decisions, which proceed from a universal methodology. The ABSs are directed at forming a friendly environment and simultaneously are the material and technical means of realizing such environment of the system of material entities [1].
At the same time, the need to create a fully-fledged living environment and solve the problems of the
complexity and aesthetic qualities of residential development depends largely on the use of advanced architectural and urban development solutions and the implementation of efficient building structures, materials, products, and technologies, and the improvement and transformation of the material and technical base of construction [2, 3, 4]. It should be noted the availability of modern methods for the integrated assessment of such solutions in the context of sustainable design in the works of Professor L. Kamionka [4, 5]. At the same time the key issue is determining the development strategy and prospects for improving the architectural and construction systems of civilian buildings.
Such systems are known in housing practice. It’s basically like prefabricated large-panel systems, prefabricated framework systems, modular cell systems, block systems, monolithic systems, and their combinations, but they do not always meet modern social and economic requirements and
VADYM ABYZOV
Kielce University of Technology
e-mail: [email protected]
ARCHITECTURE-&-BUILDING SYSTEMS IN CIVIL CONSTRUCTIONSYSTEMY ARCHITEKTONICZNE I BUDOWLANE
W BUDOWNICTWIE CYWILNYMDOI: 10.30540/sae-2018-015
Manuscript submitted 2017.11.30 – revised 2018.03.30, initially accepted for publication 2018.05.15, published in June 2018
A b s t r a c tThe article deals with the role of Architecture-&-Building systems in Residential and Public Construction. The concept and definition of the Architecture-&-Building systems are determined and reviewed. The structural model of Architecture-&-Building systems that have signs of integrity, the hierarchy of structure and openness is proposed. They include three main subsystems, which are in organic unity and interaction: functional-spatial (architectural and planning); constructive (tectonic); technological (production-building).
Keywords: Civil Construction, Architecture-&-Building Systems, structural model
S t r e s z c z e n i eArtykuł dotyczy roli systemów architektonicznych i budowlanych w budownictwie mieszkaniowym i publicznym. Koncep-cja i definicja systemów architektonicznych i budowlanych są określone i przejrzane. Zaproponowano model strukturalny systemów architektonicznych i budowlanych o oznakach integralności, hierarchii struktury i otwartości. Te systemy obej-mują trzy główne podsystemy, które są w organicznej jedności i interakcji: funkcjonalno-przestrzenne (architektoniczne i planistyczne), konstruktywny (tektoniczny), technologiczny (produkcja-budynek).
Słowa kluczowe: budownictwo cywilne, systemy architektoniczne i budowlane, model strukturalny

154
ARCHITECTURE-&-BUILDING SYSTEMS IN CIVIL CONSTRUCTION
constantly improving. At present the building market is changing and growing, featuring new diverse construction decisions. [1-9]. For a holistic view and a comprehensive solution for this problem, it is necessary to consider and define the concept, definition and structural model of the ABS, what is the purpose of this article.
2. THE CONCEPT AND DEFINITION OF THE ARCHITECTURE-&-BUILDING SYSTEM
The term “Architecture-&-Building system” (ABS) is not new in design and construction practice. It is widely used in various studies and publications, normative and methodological documents, mostly in Eastern Europe. However, there is no clear definition of this term. Along with this, terms such as industrial systems, building design and construction systems, prefabricated systems, framework systems and others are used [1, 3, 6, 7, 8, 10]. At the same time in the most part of various publications buildings and structures and their constructive components and elements as systems are considered. Before giving the terminological definition of ABS, one should consider the existing terminology of related concepts.
The most common and stable term is “constructive system” (CS). However, this term is interpreted differently in various studies. The following definitions of the CS are known:– “a set of solutions supporting and protecting
structures that provide spatial rigidity and stability of buildings” [10];
– “spatial bearing skeleton which consists of vertical and horizontal elements that provide a static work of building, its stability” [11].
As the functional and architectural aspects are usually crucial for the CS, the most reliable interpretation of it as a subsystem of the architectural system is given in the studies by Professor B.G. Barkin: “The constructive subsystem is realized by material and technical means and provides stability, strength, durability and fire safety” [12]. In other words, a constructive system should be considered as part of more complex systems – architecturt & constructive (architectural & structural) and architecture & building (architectural & construction), in which no constructive element or part can be constructed and evaluated in isolation. Ignoring such design leads to serious mistakes, failures, violations of the relationship between structure and form, worsening conditions of buildings and so on. Examples of this may be the first prefabricated large-panel and frame-
panel buildings in Eastern Europe, designed only on terms of statics, technology and economy of materials. Correction of such errors in the conditions of factory homebuilding requires a restructuring of production and leads to economic and moral losses.
In this regard, it is logical and justified, in our opinion, the emergence and spread of the term architecture and constructive system (ACS), which subsequently became applied in farther researches and design [10]. However, despite this, the definition of this term is absent. Along with this became the extension of a term as a building system (BS), which is a combination of a certain construction method with a certain constructive system in the application of specific technology. In turn, the construction method is a way of erection of buildings, for example, a large-panel or monolithic method (Fig. 1).
It is worth to mention here the definition of the term as a “combined building (construction) system” – “the combination of two or more building systems or their individual elements, for example, a building constructed by one construction method, in which vertically and/or horizontally combines different constructive systems, or vice versa, the application of one constructive system uses a combination of different methods of erection. [13]. In addition, other definitions and terms that belong to the subject of research and reflect its essence (mainly a technical point of view) are known – structural and technological systems, design and production systems, systems of industrial residential houses, etc. [1-9].
The given terminology does not exhaust all the definitions adopted by different experts, which often complement each other, but generally have a local character, since in most of them lack such an important and comprehensive concept as the architecture, which underlies both constructive and building systems. This largely reflects not only the functional aspect from the point of view of terminology, but also its essential aspect.
Since the formation of each building is impossible without a complex of architectural requirements and urban conditions, it is most expedient to operate such terms as architecture & constructive systems and architectural & building systems. At the same time, the latter most accurately and fully reflects the phenomenon of the integration of architecture and industrial homebuilding and embodies in its name the whole complex of not only urban, architectural, constructional, but also construction and technology issues (Fig. 1).

155
SYSTEMY ARCHITEKTONICZNE I BUDOWLANE W BUDOWNICTWIE CYWILNYM
Fig. 1. Main characteristics of systems of residential and public constructionRys. 1. Główne cechy systemów w budownictwie mieszkaniowym i publicznym
156
ARCHITECTURE-&-BUILDING SYSTEMS IN CIVIL CONSTRUCTION
The author understands the architecture & building system as a set of interrelated architectural, constructive and technological solutions, which are based on uniform methodological principles of housing environment formation and provide realization of a complex of socio-demographic, urban planning, functional and lay out, technical, technological, environmental, economic, aesthetic and other requirements [1].
It should be noted that in fact the concept of ABS is two aspects of one phenomenon. The first is material and technical aspect, which is included in the system of material formations and technical means of realization of the living environment – from building to the apartment, and the second aspect is organizational and informational, which is examined in the system of public relations and management of urban planning as a certain program of appropriate targeted actions.
3. ARCHITECTURE & BUILDING SYSTEM MODEL STRUCTURE AND IT SUBSYSTEMS
In accordance with the terminology we adopt, architecture & building systems of civil engineering, intended to form a residential environment, should be presented in three main aspects: functional-spatial, constructive, and construction-technological. It can clearly define the range of phenomena associated with the organization and design of the material and spatial environment, which has an important methodological significance.
Author of this article believes that the ABS model (Fig. 2) should be considered as a complex system, which includes three subsystems: functional-spatial (architectural-lay out), constructive (tectonic), technological (production-building).
Each of these subsystems has a hierarchical range of its own interrelated structural elements, the further classification of which has an open nature that takes into account the multidimensional information and the degree of its interaction with other elements and their groups in solving specific architectural and construction tasks. Construction of the model structure of architecture & building systems and its operation will provide an opportunity to determine the nature of the system’s behavior, predict its future state, trends and development prospects.
Functional-spatial subsystem (FSS) reflects the functional purpose of architecture & building systems, the main urban-planning characteristics, typological and architecture-spatial properties and
includes the following main blocks: “urban structure” (development) and “buildings”.
Block “urban structure” describes the new territories and the territories of the existing buildings, which in turn, further divided into zoning on functional grounds, belonging to the protected areas, etc.
Block “building” is divided into sub-blocks “function” and “architecture and lay out structure”. In the sub-block “function” distinguished by features of functional typology of residential buildings, public, industrial, multi-functional buildings (integrated complexes). Then these objects acquire a more detailed typological classification (Fig. 2). Thus, the typology of residential buildings covers apartment buildings and individual dwellings, which in turn are divided into: multi-apartment buildings – sectional, corridor, gallery and others; individual – separate, locked, duplex, etc. The typology of public buildings includes educational, commercial, cultural, sports, recreational, administrative and other types of public buildings. In the future, they have further and smaller classifications. Similarly, various industrial buildings and multifunctional complexes can be dissected according to functionally typological features.
The sub-block “architectural and lay out structure” includes fine-cell, big-celle, mixed-cell structures, which in turn can be divided into their varieties (Fig. 2).
Functional-spatial subsystem has its implementation in a constructive subsystem.
Constructive subsystem (CS) is a collection of interconnected vertical and horizontal structural elements, united in a single system according to the laws of building mechanics. At the same time, it has two main blocks, covering the decision of bearing and non-bearing structures. The latter block, in turn, contains a solution of the elements of the wall fences and the division of the interior space of the building (fencing and dismembering/separating structures). Thus, the constructive subsystem includes bearing, fencing and dismembering/separating structures. They, in turn, are divided into: – bearing – on a planar (wall), frame (skeleton),
volumetric (shell);– fencing – on self-supporting, mounted;– dismembering – on stationary, non-stationary, etc.
Fencing structures can also be used as bearing walls, but in this case they should be classified as bearing structures of the buildings. Further, the following division of these elements is possible according to the types of used building materials, methods of fastening and work of structures, etc.

157
SYSTEMY ARCHITEKTONICZNE I BUDOWLANE W BUDOWNICTWIE CYWILNYM
Constructive subsystems that are the elements of the artificial environment system can not be considered separately. Their formation is determined by the typology of buildings, urban planning conditions, architectural design, i.e. the elements of the functional-spatial subsystem. Together, the functional-spatial and constructive subsystems form an architecture and constructive system (ACS), which is a subsystem of the architecture and building system of a higher hierarchical level. However, ACS as well as the CS does not include the specifics of varieties of building materials, technologies for the production of structural elements and construction methods, on the basis of which houses are erected. Each constructive system can be implemented in brick, prefabricated or monolithic reinforced concrete, etc. (Fig. 2).
Technological subsystem (TC) reflects the concrete production conditions for the implementation of architectural and design systems and includes the following blocks: “building materials”, “technology”. The latter in turn is divided into the technology of
manufacturing building products and technology of building methods (construction).
The block “building materials” includes non-composite (homogeneous) and composite (non-uniform) materials. In the sub-block “technology” of the production is allocated TO the production of structures and construction of buildings. The sub-block “production of structures” (technology as methods of construction) is divided into prefabricated, monolithic, block (from local materials), mixed (combined) methods of construction. These sub-blocks have such divisions. Factory technologies (production of structures) are divided into stand, cassette, aggregate-current, vibrio-rolling, conveyor, conveyor-cassette, etc. “Construction of buildings” (building technology) has its own specific varieties. The prefabricated method includes large-panel, frame, modular cell construction, as well as various combined methods of prefabricated construction, as for example, frame-large-panel, modular cell-panel, and others. Monolithic building includes construction
Fig. 2. The structure of Architecture-&-Building System modelRys. 2. Struktura modelu systemów architektonicznych i budowlanych
158
ARCHITECTURE-&-BUILDING SYSTEMS IN CIVIL CONSTRUCTION
with the use of removable formworks of multiple use and fixed formworks. Block method includes large block and small-brick construction.
These kinds of basic construction methods have in turn smaller division. The mixed (combined) method has a large variety of construction methods, which include various combinations of the above methods. Varieties of building materials and technologies in turn are divided into the classifications of lower levels of elements’ generalization (Fig. 2).
The combination of building methods and materials with a certain constructive system is a constructive-technological or building system (BS). That is, the constructive and technological subsystems are the building system. And together with the functional-spatial subsystem it forms an architecture and building system [1].
4. CONCLUSIONS The concept of architecture and construction
system, which is distributed in professional language and literature, is defined in this article. The proposed structure of the ABS model consists of three hierarchically subordinate subsystems and provides classification at the lower levels of elements’ generalization – up to the primary elements of architecture & building systems. It has an open character that allows it to be operated This gives also possibility to consider the prospects of further development and improvement of systems and a wide range of architectural and engineering tasks. Examined terminology and ABS model and its structure is also the basis for determining the basic types and classification of architecture & building systems.
References[1] Abyzov V., Theory of Architecture-&-Construction Systems Development. Monograph, Kyiv: KNUKiM, 2010. [2] Abyzov V., Modern Conditions and the Impacts of the Creation of Architectural Environment, World Multidisciplinary
Civil Engineering – Urban Planning Symposium WMCAUS 2017, Published articles, - Prague – Czech Republic.[3] Abyzov V., Multivariate Architecture-&-Constructive System on the basis of Beamless Framework, Structure and
Environment, Kielce University of Technology, 2015, vol. 7, pp. 15-19.[4] Kamionka L., Projektowanie zrównoważone – próby określenia parametrów, [w:] Projektowanie zrównoważone
jako paradygmat kszałtowania przestrzeni w XXI wieku. Monografia, Architektura 3, Politechnika Świętokrzyska, Kielce 2016, s. 11-18.
[5] Kamionka L., Architektura zharmonizowana z otoczeniem – aspekt wybranych metod oceniających, [w:] Architektura zharmonizowana w przestrzeni miasta. Monografia, Architektura 4, Politechnika Świętokrzyska, Kielce 2016, s. 21-29.
[6] Building Design and Construction Systems. Handbook. F. Merritt, editor, J. Ricketts, editor, – 6th ed. McGraw-Hill, 2001.
[7] Tofiluk A., Systemy prefabrykacji dla wielorodzinnego budownictwa mieszkaniowego – “wiełka plyta” wczoraj i dziś, Prefabrykacja – jakość, trwałość, różnorodność, Warszawa 2017, zeszyt 5, s. 39-49.
[8] www. archiexpo.com/cat/construction-systems-PJ. Html.[9] Deplazes A., Constructing Architecture: Materials, Processes, Structure, Handbook, Birkhäuser – Publishers for
Architecture, Basel - Boston - Berlin, 2005. [10] Yezhov V., Sleptsov O., Guseva E.V., Architecture $ Constructive Systems of Civil Buildings, Kyiv, LICENSEArch,
1998. [11] Tsirik Y., Combined Construction Systems, Housing construction, 1986, No. 1, pp. 6-9. [12] Barkhin B., Methodology of Architectural Design, Moscow, Stroyizdat, 1982.[13] Kvashnin-Samarin S., Combined Systems of Industrial Houses, L.: Stroyizdat, 1986.
Acknowledgments:This work was supported by Kielce University of Technology, Grant No. 02.0.07.00/2.01.01.01.0020 MNSP.BKAU.15.002.
Podziękowania:Praca była finansowana przez Politechnikę Świętokrzyską, grant nr 02.0.07.00/2.01.01.01.0020 MNSP.BKAU.15.002.


161
1. INTRODUCTIONOne of the objectives of the discipline of science
as Environmental Engineering is to find new ways of saving energy, which as a result of exploitation of energy resources becomes increasingly difficult to access and their combustion causes negative effects on the environment. Their limitation requires radical action. This is primarily the case for the largest non-renewable energy consumer, which is construction, industry and transport. One way to reduce fuel consumption is to replace them with others, including renewables. The search for new resources from renewable sources focuses on the use of solar, wind, hydro, geothermal and biofuels.
1. WPROWADZENIEJednym z celów inżynierii środowiska jest poszu-
kiwanie nowych metod oszczędzania energii, która na skutek eksploatowania surowców energetycznych staje się coraz trudniej dostępna, a ich spalanie po-woduje negatywne skutki dla środowiska. Ich ogra-niczenie wymaga zastosowania radykalnych działań. Dotyczy to przede wszystkim największych konsu-mentów energii nieodnawialnej, którymi są budow-nictwo, przemysł i transport. Jednym ze sposobów ograniczenia zużycia paliw jest ich zastąpienie innymi, w tym odnawialnymi. Poszukiwania nowych zasobów w obszarze źródeł odnawialnych koncentrują się na wykorzystaniu energii słonecznej, wiatrowej, wodnej, geotermalnej i różnego rodzaju biopaliw.
PAWEŁ LESIAK
Kielce University of Technology
e-mail: [email protected]
PASSIVE ENERGY REDUCTION TECHNOLOGIES IN ENVIRONMENTAL ENGINEERING
TECHNOLOGIE PASYWNEGO OGRANICZANIA ZUŻYCIA ENERGII W INŻYNIERII ŚRODOWISKA
DOI: 10.30540/sae-2018-016
Manuscript submitted 2017.09.20 – revised 2017.10.30, initially accepted for publication 2017.11.30, published in June 2018
A b s t r a c tThe paper presents a review of passive techniques used in environmental engineering and construction, aimed at reducing energy consumption for heating or cooling purposes. These are: green facades, cooling coatings, thermopaints, heater screens, shutters and other solutions. Their disadvantages, advantages and working methods were discussed. The heat gain calculations for the exemplary building whose baffles were painted with pigmented pigment with varying degrees of dilution resulted in a facade of varying color intensity. It has been found that by applying bright colors, nearly 30 percent of energy consumption for cooling purposes for heat gains through opaque seams compared to dark colors has been reduced.
Keywords: passive technologies, cooling, cooling coatings, green facades
S t r e s z c z e n i eW pracy przedstawiono przegląd technik pasywnych stosowanych w inżynierii środowiska i budownictwie, których za-daniem jest ograniczenie zużycia energii na cele grzewcze lub chłodnicze. Są to: zielone fasady, powłoki chłodzące, termofarby, ekrany zagrzejnikowe, żaluzje oraz inne rozwiązania. Przedyskutowano ich wady, zalety oraz sposób pracy. Przedstawiono również obliczenia zysków ciepła dla przykładowego budynku, którego przegrody zostały pomalowane farbą zabarwioną pigmentem o różnym stopniu rozcieńczenia, czego wynikiem jest fasada o różnej intensywności koloru. Stwierdzono, że przez zastosowanie jasnego koloru doszło do obniżenia o blisko 30 procent zużycia energii na cele chłod-nicze dla zysków ciepła przez przegrody nieprzezroczyste w porównaniu z ciemną barwą.
Słowa kluczowe: technologie pasywne, chłodzenie, powłoki chłodzące, zielone fasady

162
PASSIVE ENERGY REDUCTION TECHNOLOGIES IN ENVIRONMENTAL ENGINEERING
The easiest to acquire is solar radiation, which is widely used in nature. The described examples of the use of radiation are passive methods, which are spontaneous and require no additional energy.
2. PASSIVE TECHNOLOGIES OF ENERGY SAVINGSPassive cooling methods are a very broad group
of different types of means, building techniques, architectural techniques as well as methods of decorating buildings that influence thermal comfort. They include a whole spectrum of different techniques such as:– green facades,– cooling coatings,– thermosiphon and heat pipes,– thermochromic paints,– heater screens,– blinds, awnings, etc.
One of the ideas for changing the thermal state of buildings is the use of coatings with the desired emission characteristics of external building baffles. The simplest solution is to use a color paint which, depending on the desired effect, can have a different absorption coefficient. Generally, it is possible to choose dark colors for radiative heat gains, and for light colors to be limited. In the example of three buildings in Shanghai, it has been found that the use of special reflective coatings can reduce the surface temperature of the southern wall, depending on the coating, from 4.6°C to as much as 20°C. Three coverings were tested: one for basic and two for comparison, with selective responses to falling sunlight. Also tested are specially prepared acrylic paints with different emissivity and absorption properties. The literature results show that it is possible to lower the surface temperature by more than 10°C [3].
Thermopaints for facades and roofs are also available. Their chemical composition and manufacturing technology is protected and only general information is available in the literature. It is known, for example, that one of the components used is titanium dioxide. In the study [4] eleven aluminum samples painted with various titanium dioxide thermochromatic paints were tested and compared with samples painted without additives. The results show that thermochromic paints effectively improve reflective properties by increasing the reflection of sunlight by as much as 43%.
Najłatwiejszym do pozyskiwania jest promienio-wanie słoneczne, którego wykorzystanie jest szeroko spotykane w przyrodzie. Opisane przykłady wyko-rzystania promieniowania należą do metod pasyw-nych, a więc takich, które zachodzą samorzutnie i nie wymagają dodatkowej energii.
2. METODY PASYWNEPasywne metody chłodzenia to bardzo szeroka gru-
pa różnego rodzaju środków, technik budowlanych, architektonicznych, jak i metod wystroju budynków wpływająca na komfort cieplny. Zalicza się do nich całe spektrum różnorakich technik, takich jak:– zielone fasady,– powłoki chłodzące,– termosyfony i rurki cieplne,– farby termochromowe,– ekrany zagrzejnikowe,– żaluzje, markizy itp.
Jednym ze sposobów na zmianę stanu termiczne-go budynków jest zastosowanie pokryć o pożądanych właściwościach emisyjnych zewnętrznych przegród budowlanych. Najprostszym rozwiązaniem jest użycie kolorowej farby, która w zależności od pożądanego efektu może charakteryzować się różnym współczyn-nikiem absorpcji. Można przyjąć, że aby zwiększyć ra-diacyjne zyski ciepła, należy wybierać kolory ciemne, a dla ich ograniczenia kolory jasne. Na przykładzie trzech budynków w Szanghaju [2] stwierdzono, że za-stosowanie specjalnych powłok refleksyjnych może przyczynić się do zmniejszenia temperatury powierzch-ni zewnętrznej ściany południowej, w zależności od pokrycia, od 4,6°C do nawet 20°C. Badano tam trzy po-krycia: jedno podstawowe i dla porównania dwa o ce-chach selektywnej reakcji na padające promieniowanie słoneczne. Prowadzone są badania specjalnie sprepa-rowanych farb akrylowych o różnych właściwościach emisyjno-absorpcyjnych. Podawane w literaturze wyni-ki badań wskazują, że możliwe jest obniżenie tempera-tury powierzchni o ponad 10°C [3].
Na rynku dostępne są termofarby do elewacji i da-chów. Ich skład chemiczny i technologia wytwarzania są chronione i tylko ogólne informacje są dostępne. Wiadomo na przykład, że jednym z wykorzystywanych składników jest dwutlenek tytanu. W pracy [4] prze-prowadzono badania na 11 próbkach aluminiowych pomalowanych różnymi farbami termochromatycz-nymi z dodatkiem dwutlenku tytanu i dla porównania z próbkami pomalowanymi farbą bez dodatków. Wyni-ki wykazały, że farby termochromatyczne poprawiają właściwości refleksyjne, zwiększając odbicie promie-niowania słonecznego nawet o 43%.
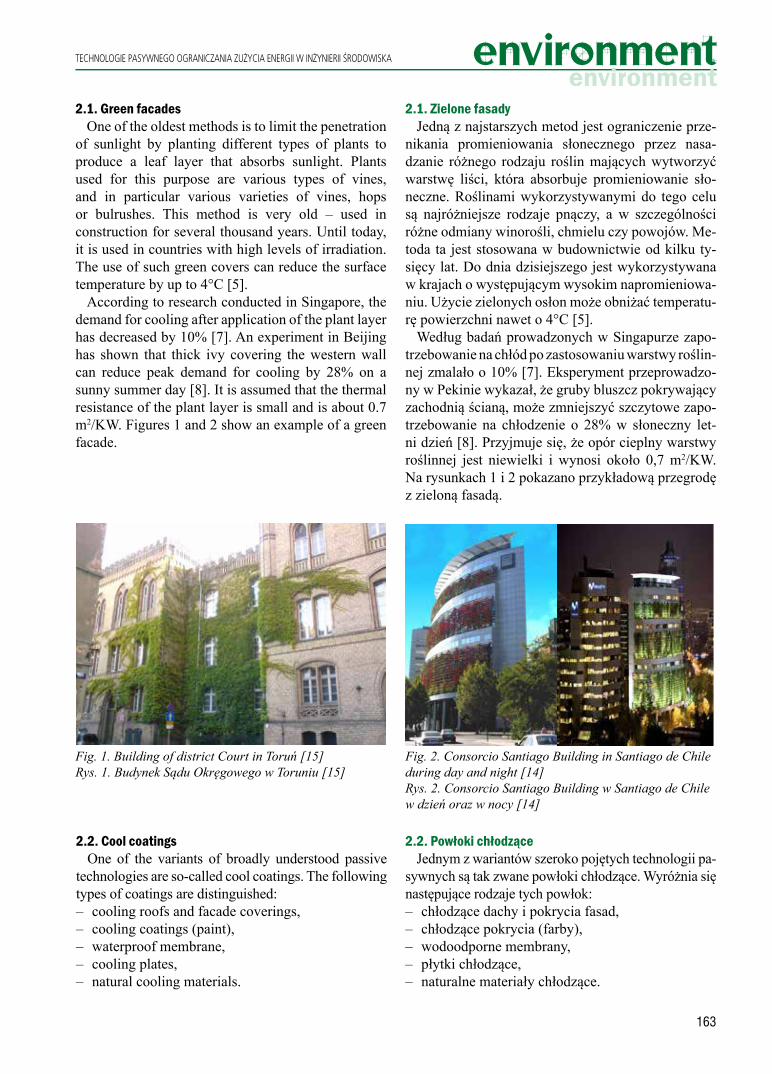
163
TECHNOLOGIE PASYWNEGO OGRANICZANIA ZUŻYCIA ENERGII W INŻYNIERII ŚRODOWISKA
2.1. Green facadesOne of the oldest methods is to limit the penetration
of sunlight by planting different types of plants to produce a leaf layer that absorbs sunlight. Plants used for this purpose are various types of vines, and in particular various varieties of vines, hops or bulrushes. This method is very old – used in construction for several thousand years. Until today, it is used in countries with high levels of irradiation. The use of such green covers can reduce the surface temperature by up to 4°C [5].
According to research conducted in Singapore, the demand for cooling after application of the plant layer has decreased by 10% [7]. An experiment in Beijing has shown that thick ivy covering the western wall can reduce peak demand for cooling by 28% on a sunny summer day [8]. It is assumed that the thermal resistance of the plant layer is small and is about 0.7 m2/KW. Figures 1 and 2 show an example of a green facade.
2.1. Zielone fasady Jedną z najstarszych metod jest ograniczenie prze-
nikania promieniowania słonecznego przez nasa-dzanie różnego rodzaju roślin mających wytworzyć warstwę liści, która absorbuje promieniowanie sło-neczne. Roślinami wykorzystywanymi do tego celu są najróżniejsze rodzaje pnączy, a w szczególności różne odmiany winorośli, chmielu czy powojów. Me-toda ta jest stosowana w budownictwie od kilku ty-sięcy lat. Do dnia dzisiejszego jest wykorzystywana w krajach o występującym wysokim napromieniowa-niu. Użycie zielonych osłon może obniżać temperatu-rę powierzchni nawet o 4°C [5].
Według badań prowadzonych w Singapurze zapo-trzebowanie na chłód po zastosowaniu warstwy roślin-nej zmalało o 10% [7]. Eksperyment przeprowadzo-ny w Pekinie wykazał, że gruby bluszcz pokrywający zachodnią ścianą, może zmniejszyć szczytowe zapo-trzebowanie na chłodzenie o 28% w słoneczny let-ni dzień [8]. Przyjmuje się, że opór cieplny warstwy roślinnej jest niewielki i wynosi około 0,7 m2/KW. Na rysunkach 1 i 2 pokazano przykładową przegrodę z zieloną fasadą.
Fig. 1. Building of district Court in Toruń [15]Rys. 1. Budynek Sądu Okręgowego w Toruniu [15]
Fig. 2. Consorcio Santiago Building in Santiago de Chile during day and night [14]Rys. 2. Consorcio Santiago Building w Santiago de Chile w dzień oraz w nocy [14]
2.2. Cool coatingsOne of the variants of broadly understood passive
technologies are so-called cool coatings. The following types of coatings are distinguished:– cooling roofs and facade coverings,– cooling coatings (paint),– waterproof membrane,– cooling plates,– natural cooling materials.
2.2. Powłoki chłodzące Jednym z wariantów szeroko pojętych technologii pa-
sywnych są tak zwane powłoki chłodzące. Wyróżnia się następujące rodzaje tych powłok:– chłodzące dachy i pokrycia fasad,– chłodzące pokrycia (farby),– wodoodporne membrany,– płytki chłodzące,– naturalne materiały chłodzące.

164
PASSIVE ENERGY REDUCTION TECHNOLOGIES IN ENVIRONMENTAL ENGINEERING
Cooling roofs are usually covered with various types of membranes, gravel, paint or metal plates. Typically, cooling roofs are a one-layered structure. Typical liquid used for cooling coatings consists of white paint, polyurethane, elastomeric or acrylic coatings and can also be made of other plastics such as EPDM, PVC or CPE. It was found that the black roof covered with asphalt after applying the cooling coating changed its reflectivity coefficient from 0.04 to 0.8 [9]. The material that heats up to 75-80°C after using of cool coating heating is heated to 45°C.
These elements use selective absorption and emission of solar radiation. Their use in building construction reduces the building’s cooling load, improves the thermal comfort of the building, increases the roof’s resistance due to the reduction of stress caused by the temperature. Such coating properties result in increased reflectivity and lower absorption. Therefore, such coatings are a good way to weaken the effect of the City Heat Island.
Crafted surfaces are characterized by a reflection coefficient greater than 80% and a high emissivity of about 0.8-0.9 [9]. Both of these values are used to calculate the Solar Reflectance Index (SRI).
Cooling paints are the most common and effective way of shaping the outside temperature of a building. They also have better cooling properties compared to materials such as white marble or white mosaics. Most of these paints are based on zinc dioxide or titanium dioxide, whose reflectivity is in the range of 0.7-0.85. The use of this type of coating allows the absorption coefficient to be reduced to about 0.2. A similar effect can be achieved by the addition of suitable pigments, which improve the reflective properties of the coating, especially in the field of infrared radiation. In the literature it is stated that the difference in surface temperature between the painted black reflective paint and the ordinary black paint reaches more than 10°C [9, 11]. Figure 3 shows an example application of this technology.
Instead of painting, waterproof membranes made of plastics are used. Zinc dioxide and ceramics are added to them. Their standard reflectivity is about 0.81-0.84. Standardized coatings can improve energy efficiency, which is understood to reduce energy consumption by up to 19.3% [9].
Coatings can also be covered with ceramic tiles, made of silicate gel, combined with thin aluminum foil with low emissivity (Fig. 4). This plate design allows for increased resistance to thermal conditions, and additionally allows control of heat loss in winter and summer gains. The reflectance in literature is about 0.75. This results in a cooling cost reduction of over 50% [9]. Their performance
Dachy chłodzące są zazwyczaj pokrywane różne-go rodzaju membranami, żwirami, farbami lub me-talowymi płytkami. Zazwyczaj dachy chłodzące są strukturą jednowarstwową. Typowy płyn używany do chłodzących powłok składa się z białej farby, po-liuretanowych, elastomerowych lub akrylowych po-włok, a także może być wykonany z innych tworzyw sztucznych, jak EPDM, PVC czy CPE. Stwierdzono, że czarny dach pokryty asfaltem, po nałożeniu po-włoki chłodzącej, zmienił swój współczynnik reflek-syjności z 0,04 do 0,8 [9]. Materiał nagrzewający się do temperatury 75-80°C, po zastosowaniu powłoki, nagrzewa się do temperatury 45°C.
Elementy te wykorzystują zjawiska selektywnej absorpcji i emisji padającego na nie promieniowa-nia słonecznego. Ich zastosowanie w budownictwie na elementach budynków pozwala na zmniejszenie obciążenia chłodniczego budynku, poprawienie kom-fortu cieplnego we wnętrzu obiektu oraz zwiększenie odporności dachu na skutek zmniejszenia naprężeń wywołanych temperaturą. Takie właściwości powłok skutkują zwiększoną refleksyjnością i niższą absorp-cją. Z tego względu takie powłoki są dobrym sposo-bem do osłabienia efektu miejskiej wyspy ciepła.
Opisane w literaturze najkorzystniej spreparowane powierzchnie charakteryzują się współczynnikiem odbicia powyżej 80% i wysoką emisyjnością wyno-szącą około 0,8-0,9 [9]. Obie te wartości są wykorzy-stywane do obliczenia zastępczego współczynnika emisji (Solar Reflectance Index – SRI).
Farby chłodzące są najbardziej rozpowszechnio-nym i skutecznym sposobem kształtowania tempe-ratury zewnętrznej budynku. Mają też korzystniejsze własności chłodzące w porównaniu do takich mate-riałów jak biały marmur czy białe mozaiki. W więk-szości skład takich farb jest oparty na bazie dwutlen-ku cynku lub tytanu, którego współczynnik odbicia zawiera się w przedziale 0,7-0,85. Stosowanie tego rodzaju pokryć umożliwia ograniczenie współczyn-nika absorpcji do wartości około 0,2. Podobny efekt można osiągnąć przez dodanie odpowiednich pig-mentów, których zadaniem jest poprawa właściwości refleksyjnych pokrycia, szczególnie w zakresie pro-mieniowania podczerwonego. W literaturze podaje się, że różnica w temperaturze powierzchni między pomalowaną czarną farbą refleksyjną a farbą czarną zwykłą dochodzi do ponad 10°C [9, 11]. Na rysunku 3 pokazano przykładową aplikację tej technologii.
Zamiast malowania stosuje się zabarwienia wo-doszczelnych membran wykonywanych z tworzyw sztucznych. Dodaje się do nich cząsteczki dwutlen-

165
TECHNOLOGIE PASYWNEGO OGRANICZANIA ZUŻYCIA ENERGII W INŻYNIERII ŚRODOWISKA
Fig. 3. Roof painted with cool paint [17]Rys. 3. Dach pokryty białą farbą chłodzącą [17]
Fig. 4. Roof with mounted cool tiles [17] Rys. 4. Dach z zamontowanymi płytkami chłodzącymi [17]
in the form of a traditional tile keeps the aesthetic qualities of the roof. A similar effect is obtained by spraying a latex lacquer onto the concrete surface.
In countries with high sunshine, such as in the Mediterranean, gravel, light marble and light stones are used. These materials are characterized by relatively high reflectivity ratios (for example, about 79% for marble [9]). In addition, such natural cooling materials have low cost of acquisition, production and assembly.
The use of these solutions in new and existing buildings contributes to the energy efficiency of buildings in times of excessive heat. In work [9] it is stated that energy savings are in the range of 2-44%, their average value is 20%. These values depend on local climate, sky conditions and ventilation and air conditioning systems. US research shows that cooling energy gains are 12-25% for single family housing, 5-18% for office buildings and 7-17% for utility buildings. Estimates show that for the 50-year cooling roof, the profits generated by the construction are approximately $ 25 per square meter compared to the black roof (ie, covered with tarpaulin, etc.).
2.3. Heater screenVarious heater surfaces are of particular importance
in passive technologies. For example, increasing the
ku cynku i ceramiki. Ich standardowa refleksyjność promieniowania wynosi około 0,81-0,84. Standardo-wo dostępne powłoki mogą zwiększyć efektywność energetyczną, rozumianą jako zmniejszenie zużycia energii na chłodzenie nawet o ponad 19,3% [9].
Powłokami takimi mogą być również powierzch-nie pokryte płytkami ceramicznymi, wykonanymi z silikatowego żelu połączonego z cienką folią alu-miniową o niewielkiej emisyjności (rys. 4). Taka konstrukcja płytki umożliwia podwyższenie odpor-ności na warunki termiczne, a dodatkowo umożliwia kontrolę strat ciepła zimą i zysków latem. Podawany w literaturze współczynnik odbicia wynosi około 0,75. Prowadzi to do obniżenia kosztów chłodzenia o ponad 50% [9]. Ich wykonanie w formie tradycyj-nej dachówki utrzymuje walory estetyczne dachu. Podobny efekt uzyskuje się przez natrysk lakierem lateksowym na powierzchnię betonu.
W krajach o dużym nasłonecznieniu, np. w basenie Morza Śródziemnego, stosuje się żwir, jasny marmur i jasne kamienie. Materiały te w stosunku do innych charakteryzują się stosunkowo wysokimi współczyn-nikami odbicia (np. dla marmuru jest to około 79% [9]). Dodatkowo takie naturalne materiały, chłodząc, mają niskie koszty pozyskania, produkcji i montażu.
Stosowanie tego rodzaju rozwiązań w nowych i istniejących budynkach przyczynia się do popra-wy efektywności energetycznej obiektów w okre-sie nadmiernych temperatur. W pracy [9] podano, że oszczędności energii zawierają się w przedziale 2-44%, a ich przeciętna wartość wynosi 20%. War-tości te są zależne od lokalnego klimatu, stanu nieba, jak i systemów wentylacyjno-klimatyzacyjnych. Pro-wadzone w Stanach Zjednoczonych badania dowo-dzą, że zyski energii chłodzenia wynoszą 12-25% dla budownictwa jednorodzinnego, 5-18% dla budyn-ków biurowych i 7-17% dla budynków użytkowych. Szacunkowe obliczenia wskazują, że dla 50-letniego okresu pracy dachu chłodzącego zyski generowane przez konstrukcję wynoszą około 25$ dla metra kwa-dratowego, w porównaniu do dachu czarnego (np. pokrytego papą itp.).
2.3. Wykładziny zagrzejnikoweSzczególną rolę w technologiach pasywnych pełnią
różnorakie wykładziny zagrzejnikowe. Na przykład zwiększenie chropowatości powierzchni przez zasto-sowanie faktury ząbków piły i materiałów o wysokiej emisyjności powoduje wyższą burzliwość przepływu powietrza, a tym samym wzrost wymiany ciepła na-wet o 26% [6]. Dodatkowo ilość ciepła przenikające-
166
PASSIVE ENERGY REDUCTION TECHNOLOGIES IN ENVIRONMENTAL ENGINEERING
surface roughness by using a saw tooth texture and high emissivity materials results in a higher airflow turbulence, which results in an increase in heat exchange by up to 26% [6]. In addition, the amount of heat penetrating the outer baffle decreases by 54%. The result is an increased heat output of the heater by approximately 12%. This is especially recommended for uninsulated or poorly insulated compartments.
2.4. BlindsThe bulk of the heat gains or losses in the building
have transparent bulkheads. One way to limit these phenomena is to use different types of shutters, awnings and shutters. Such elements are made as internal or external, sometimes with varying vertical or horizontal inclination. In the literature it is stated that when in the warmest and strongest sunshine periods, when the surface of the absorbing baffle is facing outward, the temperature can be reduced by about 1K at the facade at a distance of about 0.5 m [10]. This result was obtained using appropriately directed aluminum overlays.
2.5. Thermosiphonges and heat pipesOne of the most interesting solutions is the systems
based on heat pipes or thermosiphas which are used for, among others, heat transfer, temperature stabilization and density regulation of heat flux. In construction and environmental engineering, in solar collectors, heat exchangers, wall heating and radiation wall panels [12].
Heat pipes can be divided by the way the condensate is transported to the evaporator. There are thermosiphates, rotating heat pipes and capillary tubes, where the condensate transport occurs as a result of the capillary pressure.
In transport and construction, for the sake of cost, the use of thermosiphon was mainly used. Where heat transport is to be independent of the direction of gravity, heat pipes are used. They are applied to:– ground stabilization around foundations and
supports in arctic areas,– defrosting icy roads,– preparation of hot water in heat exchangers,– accumulation of solar energy in solar collectors,– wall and floor heating,– ventilation of air in combination with ecological
energy sources [13].An example of the use of heat pipes is the
stabilization of the soil that was carried out during the construction of the railway line between China and Tibet. They are located in sections where there
go przez przegrodę zewnętrzną maleje o 54%. Wy-nikiem takiego zabiegu jest zwiększona wydajność cieplna grzejnika o około 12%. Takie rozwiązanie jest szczególnie polecane przy nieizolowanych lub słabo izolowanych przegrodach.
2.4. ŻaluzjeNajwiększy wpływ na zyski lub straty ciepła w budyn-
ku mają przegrody przezroczyste. Jedną z metod ogra-niczenia tych zjawisk jest stosowanie różnego rodzaju żaluzji, markiz i rolet. Elementy takie są wykonywane jako wewnętrzne lub zewnętrzne, czasami o zmiennym kącie pochylenia w pionie lub poziomie. W literaturze podaje się, że gdy w okresach najcieplejszych i przy silnej operacji promieniowania słonecznego, kiedy powierzchnia przegrody absorbującej jest skierowana na zewnątrz, temperatura może zostać zredukowana o około 1 K przy fasadzie w odległości około 0,5 m [10]. Wynik ten uzyskano przy zastosowaniu odpo-wiednio skierowanych nakładek aluminiowych.
2.5. Termosyfony i rurki cieplneJednym z ciekawszych rozwiązań są układy pracu-
jące w oparciu o rurki cieplne lub termosyfony, które stosowane są między innymi do transportu ciepła, sta-bilizacji temperatur oraz regulacji gęstości strumienia ciepła. W budownictwie i inżynierii środowiska znala-zły swoje zastosowanie m.in. w kolektorach słonecz-nych, wymiennikach ciepła, systemach ogrzewania ściennego i radiacyjnych panelach ściennych [12].
Rurki cieplne można podzielić ze względu na sposób transportu skroplin do parownika. Wyróżnia się tu termosyfony, wirujące rury cieplne oraz rury ze strukturami kapilarnymi, gdzie transport kondensatu następuje w wyniku działania ciśnienia kapilarnego.
W transporcie i budownictwie, ze względu na kosz-ty, zastosowanie znalazły przede wszystkim termosy-fony. W przypadkach kiedy transport nośnika ciepła ma być niezależny od kierunku grawitacji, stosuje się rurki ciepła. Wykorzystywane są one do:– stabilizacji temperatury gruntu wokół fundamen-
tów i podpór w obszarach arktycznych,– rozmrażania oblodzonych dróg,– przygotowania ciepłej wody użytkowej w wymien-
nikach ciepła,– akumulacji energii słonecznej w kolektorach sło-
necznych,– ogrzewania ściennego i podłogowego,– podgrzewania powietrza wentylacyjnego w połą-
czeniu z ekologicznymi źródłami energii [13].
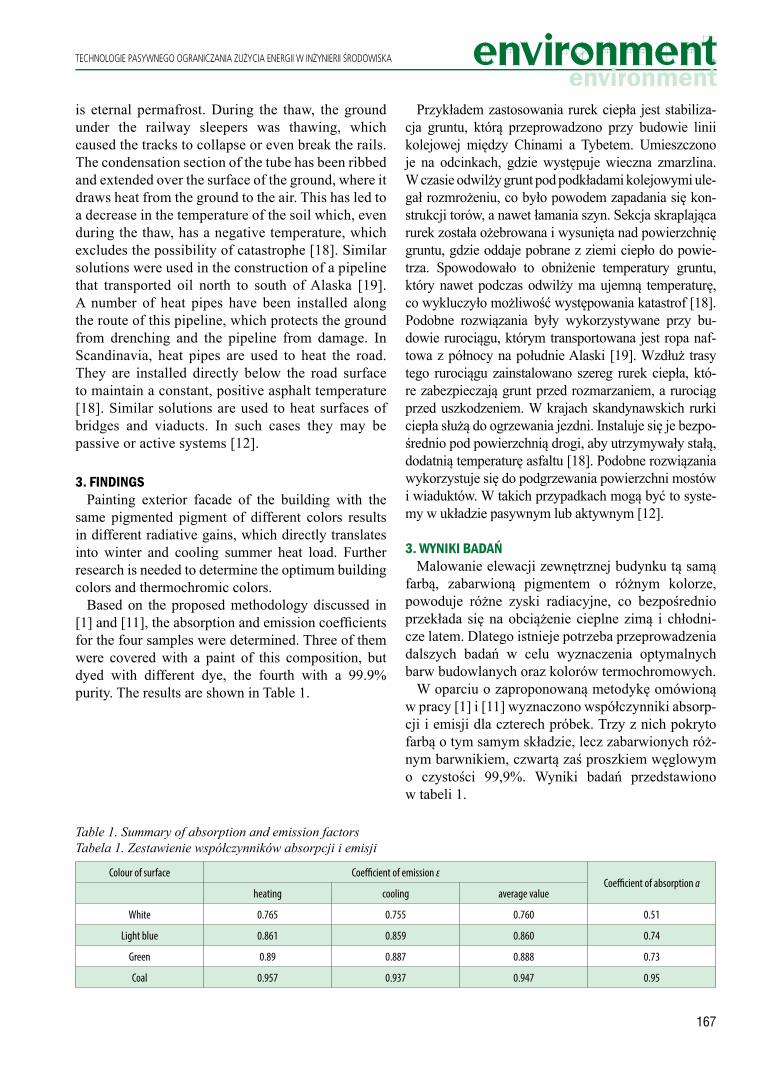
167
TECHNOLOGIE PASYWNEGO OGRANICZANIA ZUŻYCIA ENERGII W INŻYNIERII ŚRODOWISKA
is eternal permafrost. During the thaw, the ground under the railway sleepers was thawing, which caused the tracks to collapse or even break the rails. The condensation section of the tube has been ribbed and extended over the surface of the ground, where it draws heat from the ground to the air. This has led to a decrease in the temperature of the soil which, even during the thaw, has a negative temperature, which excludes the possibility of catastrophe [18]. Similar solutions were used in the construction of a pipeline that transported oil north to south of Alaska [19]. A number of heat pipes have been installed along the route of this pipeline, which protects the ground from drenching and the pipeline from damage. In Scandinavia, heat pipes are used to heat the road. They are installed directly below the road surface to maintain a constant, positive asphalt temperature [18]. Similar solutions are used to heat surfaces of bridges and viaducts. In such cases they may be passive or active systems [12].
3. FINDINGSPainting exterior facade of the building with the
same pigmented pigment of different colors results in different radiative gains, which directly translates into winter and cooling summer heat load. Further research is needed to determine the optimum building colors and thermochromic colors.
Based on the proposed methodology discussed in [1] and [11], the absorption and emission coefficients for the four samples were determined. Three of them were covered with a paint of this composition, but dyed with different dye, the fourth with a 99.9% purity. The results are shown in Table 1.
Table 1. Summary of absorption and emission factorsTabela 1. Zestawienie współczynników absorpcji i emisji
Colour of surface Coefficient of emission εCoefficient of absorption α
heating cooling average value
White 0.765 0.755 0.760 0.51
Light blue 0.861 0.859 0.860 0.74
Green 0.89 0.887 0.888 0.73
Coal 0.957 0.937 0.947 0.95
Przykładem zastosowania rurek ciepła jest stabiliza-cja gruntu, którą przeprowadzono przy budowie linii kolejowej między Chinami a Tybetem. Umieszczono je na odcinkach, gdzie występuje wieczna zmarzlina. W czasie odwilży grunt pod podkładami kolejowymi ule-gał rozmrożeniu, co było powodem zapadania się kon-strukcji torów, a nawet łamania szyn. Sekcja skraplająca rurek została ożebrowana i wysunięta nad powierzchnię gruntu, gdzie oddaje pobrane z ziemi ciepło do powie-trza. Spowodowało to obniżenie temperatury gruntu, który nawet podczas odwilży ma ujemną temperaturę, co wykluczyło możliwość występowania katastrof [18]. Podobne rozwiązania były wykorzystywane przy bu-dowie rurociągu, którym transportowana jest ropa naf-towa z północy na południe Alaski [19]. Wzdłuż trasy tego rurociągu zainstalowano szereg rurek ciepła, któ-re zabezpieczają grunt przed rozmarzaniem, a rurociąg przed uszkodzeniem. W krajach skandynawskich rurki ciepła służą do ogrzewania jezdni. Instaluje się je bezpo-średnio pod powierzchnią drogi, aby utrzymywały stałą, dodatnią temperaturę asfaltu [18]. Podobne rozwiązania wykorzystuje się do podgrzewania powierzchni mostów i wiaduktów. W takich przypadkach mogą być to syste-my w układzie pasywnym lub aktywnym [12].
3. WYNIKI BADAńMalowanie elewacji zewnętrznej budynku tą samą
farbą, zabarwioną pigmentem o różnym kolorze, powoduje różne zyski radiacyjne, co bezpośrednio przekłada się na obciążenie cieplne zimą i chłodni-cze latem. Dlatego istnieje potrzeba przeprowadzenia dalszych badań w celu wyznaczenia optymalnych barw budowlanych oraz kolorów termochromowych.
W oparciu o zaproponowaną metodykę omówioną w pracy [1] i [11] wyznaczono współczynniki absorp-cji i emisji dla czterech próbek. Trzy z nich pokryto farbą o tym samym składzie, lecz zabarwionych róż-nym barwnikiem, czwartą zaś proszkiem węglowym o czystości 99,9%. Wyniki badań przedstawiono w tabeli 1.
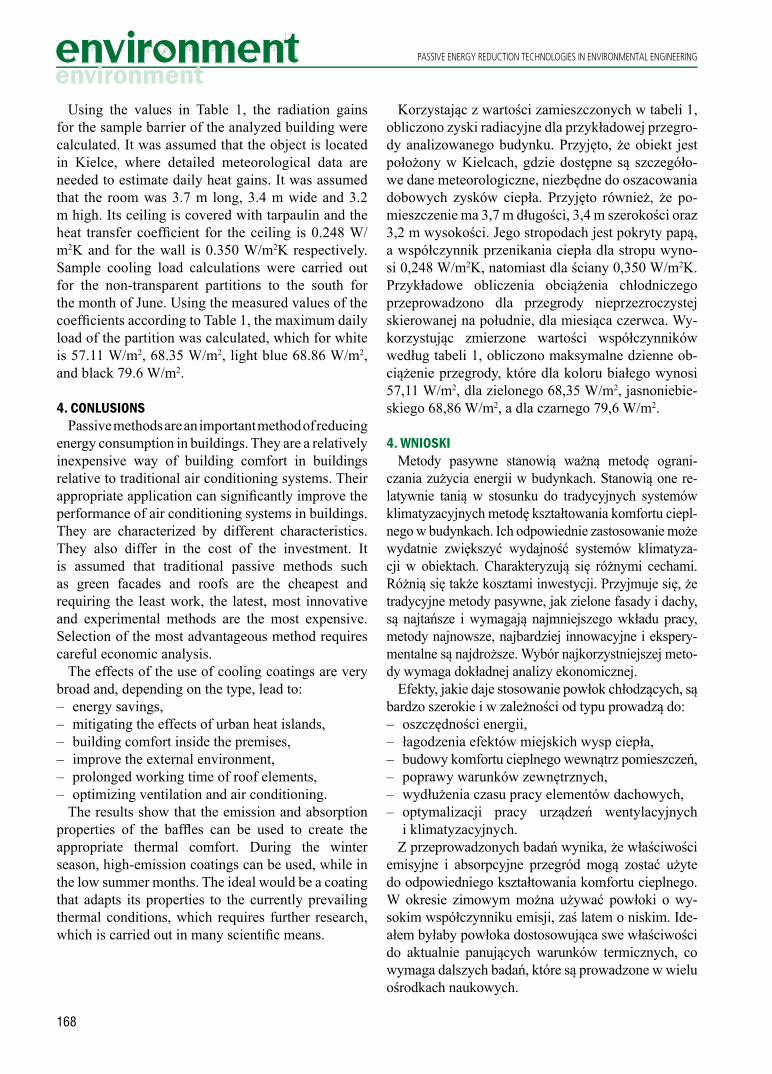
168
PASSIVE ENERGY REDUCTION TECHNOLOGIES IN ENVIRONMENTAL ENGINEERING
Using the values in Table 1, the radiation gains for the sample barrier of the analyzed building were calculated. It was assumed that the object is located in Kielce, where detailed meteorological data are needed to estimate daily heat gains. It was assumed that the room was 3.7 m long, 3.4 m wide and 3.2 m high. Its ceiling is covered with tarpaulin and the heat transfer coefficient for the ceiling is 0.248 W/m2K and for the wall is 0.350 W/m2K respectively. Sample cooling load calculations were carried out for the non-transparent partitions to the south for the month of June. Using the measured values of the coefficients according to Table 1, the maximum daily load of the partition was calculated, which for white is 57.11 W/m2, 68.35 W/m2, light blue 68.86 W/m2, and black 79.6 W/m2.
4. CONLUSIONSPassive methods are an important method of reducing
energy consumption in buildings. They are a relatively inexpensive way of building comfort in buildings relative to traditional air conditioning systems. Their appropriate application can significantly improve the performance of air conditioning systems in buildings. They are characterized by different characteristics. They also differ in the cost of the investment. It is assumed that traditional passive methods such as green facades and roofs are the cheapest and requiring the least work, the latest, most innovative and experimental methods are the most expensive. Selection of the most advantageous method requires careful economic analysis.
The effects of the use of cooling coatings are very broad and, depending on the type, lead to:– energy savings,– mitigating the effects of urban heat islands,– building comfort inside the premises,– improve the external environment,– prolonged working time of roof elements,– optimizing ventilation and air conditioning.
The results show that the emission and absorption properties of the baffles can be used to create the appropriate thermal comfort. During the winter season, high-emission coatings can be used, while in the low summer months. The ideal would be a coating that adapts its properties to the currently prevailing thermal conditions, which requires further research, which is carried out in many scientific means.
Korzystając z wartości zamieszczonych w tabeli 1, obliczono zyski radiacyjne dla przykładowej przegro-dy analizowanego budynku. Przyjęto, że obiekt jest położony w Kielcach, gdzie dostępne są szczegóło-we dane meteorologiczne, niezbędne do oszacowania dobowych zysków ciepła. Przyjęto również, że po-mieszczenie ma 3,7 m długości, 3,4 m szerokości oraz 3,2 m wysokości. Jego stropodach jest pokryty papą, a współczynnik przenikania ciepła dla stropu wyno-si 0,248 W/m2K, natomiast dla ściany 0,350 W/m2K. Przykładowe obliczenia obciążenia chłodniczego przeprowadzono dla przegrody nieprzezroczystej skierowanej na południe, dla miesiąca czerwca. Wy-korzystując zmierzone wartości współczynników według tabeli 1, obliczono maksymalne dzienne ob-ciążenie przegrody, które dla koloru białego wynosi 57,11 W/m2, dla zielonego 68,35 W/m2, jasnoniebie-skiego 68,86 W/m2, a dla czarnego 79,6 W/m2.
4. WNIOSKIMetody pasywne stanowią ważną metodę ograni-
czania zużycia energii w budynkach. Stanowią one re-latywnie tanią w stosunku do tradycyjnych systemów klimatyzacyjnych metodę kształtowania komfortu ciepl-nego w budynkach. Ich odpowiednie zastosowanie może wydatnie zwiększyć wydajność systemów klimatyza-cji w obiektach. Charakteryzują się różnymi cechami. Różnią się także kosztami inwestycji. Przyjmuje się, że tradycyjne metody pasywne, jak zielone fasady i dachy, są najtańsze i wymagają najmniejszego wkładu pracy, metody najnowsze, najbardziej innowacyjne i ekspery-mentalne są najdroższe. Wybór najkorzystniejszej meto-dy wymaga dokładnej analizy ekonomicznej.
Efekty, jakie daje stosowanie powłok chłodzących, są bardzo szerokie i w zależności od typu prowadzą do:– oszczędności energii,– łagodzenia efektów miejskich wysp ciepła,– budowy komfortu cieplnego wewnątrz pomieszczeń,– poprawy warunków zewnętrznych,– wydłużenia czasu pracy elementów dachowych,– optymalizacji pracy urządzeń wentylacyjnych
i klimatyzacyjnych.Z przeprowadzonych badań wynika, że właściwości
emisyjne i absorpcyjne przegród mogą zostać użyte do odpowiedniego kształtowania komfortu cieplnego. W okresie zimowym można używać powłoki o wy-sokim współczynniku emisji, zaś latem o niskim. Ide-ałem byłaby powłoka dostosowująca swe właściwości do aktualnie panujących warunków termicznych, co wymaga dalszych badań, które są prowadzone w wielu ośrodkach naukowych.

169
TECHNOLOGIE PASYWNEGO OGRANICZANIA ZUŻYCIA ENERGII W INŻYNIERII ŚRODOWISKA
Acknowledgments:This work was supported by Kielce University of Technology, Grant No. 05.0.07.00/2.01.01.0015 MNSP.IKSI.14.001
Podziękowania:Praca była finansowana przez Politechnikę Świętokrzyską, grant nr 05.0.07.00/2.01.01.0015 MNSP.IKSI.14.001
References [1] Bergman T.L., Lavine A.S., Incropera F.P., Devitt D.P., Fundamentals of heat and mass transfer, Wiley 2011. [2] Shen H., Tan H., Tzempelikos A., The effect of reflective coatings on building surface temperatures, indoor
environment and energy consumption – An experimental study. Energy and Buildings, 43 (2011), pp. 573-580. [3] Uemoto K.L., Sato N.M.N., Vanderley M.J., Estimating thermal performance of cool colored paints. Energy and
Buildings, 42 (2010), pp. 17-22. [4] Karlessi T., Santamouris M., Apostolakis K., Synnefa A., Livada I., Development and testing of thermochromic
coatings for buildings and urban structures. Solar Energy, 83 (2009), pp. 538-551. [5] MacIvor J.S., Margolis L., Cooling of a South-Facing Wall Using a Double-Skin Green Façade in a Temperate Climate. [6] Shati A.K.A., Blakey S.G., Beck S.B.M., The effect of surface roughness and emissivity on radiator output. Energy
and Buildings, 43 (2011), pp. 400-406. [7] Wong N.H., Kwang Tan A.Y., Chen Y., Sekar K., Tan P.Y., Chan D., Wong, N.C. (2010), Thermal evaluation of
vertical greenery systems for building walls. Building and Environ. 45:663-672. [8] Di H.F., Wang D.N. (1999), Cooling effect of ivy on a wall. Experimental Heat Transfer 12:235-245. [9] Pisello L., State of the art on the development of cool coatings for buildings and cities. Solar Energy 144 (2017),
pp. 660-680.[10] Frontinia F., Kuhnb T.E., The influence of various internal blinds on thermal comfort: A new method for calculating
the mean radiant temperature in office spaces. Energy and Buildings, 54 (2012), pp. 527-533.[11] Orzechowski T., Lesiak P., Wpływ koloru elewacji budynku na zużycie energii. The influence of color on the facade
of the building energy consumption, Współczesne problem termodynamiki, Gliwice 2017, s. 368-378.[12] Tyburczyk A., Zjawiska zmiany fazy w pasywnym odszranianiu fragmentów dróg, Logistyka, nr 4/2015, ISSN 1231-
5478, s. 6313-6319.[13] Wiśniewski T.S., Wymiana ciepła, wydanie III, WNT, Warszawa 1995.[14] Welch A., Consorcio Santiago: Chile Offices Building. https://www.e-architect.co.uk/chile/consorcio-santiago-
building. Data dostępu 16.07.2017.[15] http://www.garnek.pl/masytor/2588185/sad-okregowy-w-toruniu. Data dostępu 16.07.2017.[16] Strona internetowa firmy Perfect – Contracting & fire systems. http://perfectcfs.com/services/cool-roof/. Data
dostępu 16.07.2017.[17] Strona internetowa firmy Indianmart, https://www.indiamart.com/proddetail/cool-roof-tiles-11502802130.html.
Data dostępu 16.07.2017.[18] http://en.sunpower.com.cn/ Data dostępu 2.09.2017.[19] http://www.alyeska-pipeline.com/ Data dostępu 2.09.2017.
170
1. INTRODUCTIONThe Resolution of the European Committee on the
requirement of developing, making accessible and updating noise maps has again drawn the attention of communities to environmental noise defined as a factor greatly affecting comfort of life. Noise assessment relies on short- or long-term noise indicators [1]. Acoustic measurements are made at selected sites of the assessment area and last from a few hours to several days [2]. Determining long-term indicators, which should be representative of the whole calendar year, is especially cumbersome [3]. Road traffic noise measurements and vehicle monitoring systems use permanent monitoring terminals that record the data
ANDRZEJ BĄKOWSKILESZEK RADZISZEWSKIPAWEŁ ŚWIETLIK1
Kielce University of Technology
VLADIMIR DEKÝŠ
University of Žilina 1 e-mail: [email protected]
COMPARATIVE ANALYSIS OF MEASUREMENT DATA RECORDED BY TWO TRAFFIC MONITORING STATIONS
ANALIZA PORÓWNAWCZA WYNIKÓW POMIARÓW ZAREJESTROWANYCH PRZEZ DWIE STACJE MONITORUJĄCE
RUCH POJAZDÓW DROGOWYCHDOI: 10.30540/sae-2018-017
Manuscript submitted 2018.02.26 – revised 2018.03.08, initially accepted for publication 2018.03.23, published in June 2018
A b s t r a c tThe paper reports statistical analysis of the data recorded by two stations monitoring traffic noise in a medium-sized city, such as Kielce. One station is located beside the national road, the other beside the provincial road. The results under analysis included the equivalent sound levels recorded in 2013. The coefficient of variation, quartile deviation and deviations from the mean were proposed for comparing the dependencies recorded.Keywords: traffic noise, noise measurements, urban traffic
S t r e s z c z e n i eW artykule przedstawiono analizę statystyczną wyników pomiarów zarejestrowanych przez dwie stacje monitorujące hałas drogowy w mieście średniej wielkości takim jak Kielce. Jedna stacja znajduje się przy drodze krajowej, a druga przy drodze wojewódzkiej. Analizowane wyniki dotyczą równoważnego poziomu dźwięku zarejestrowanego w roku 2013. Współczynnik zmienności odchylenia standardowego, odchylenie ćwiartkowe, współczynnik zmienności odchylenia od wartości średnich zostały zaproponowane do porównywania zarejestrowanych zależności.Słowa kluczowe: hałas drogowy, pomiary hałasu, ruch pojazdów w mieście
1. WPROWADZENIERozporządzenie Komisji Europejskiej w sprawie obo-
wiązku opracowania, udostępniania oraz aktualizowa-nia map hałasu ponownie zwróciło uwagę społeczeń-stwa na ten czynnik, który zanieczyszcza środowisko i obniża komfort życia. Do oceny tego zjawiska wy-korzystuje się wskaźniki hałasu krótko- lub długoter-minowe [1]. W tym celu przeprowadzane są pomiary akustyczne w wybranych punktach badanego obszaru, których czas wykonywania najczęściej wynosi od kil-ku godzin do kilku dni [2]. Szczególnie kłopotliwe jest wyznaczanie wskaźników długoterminowych, które powinny być reprezentatywne dla całego roku kalen-darzowego [3]. W celu monitorowania hałasu komuni-

171
ANALIZA PORÓWNAWCZA WYNIKÓW POMIARÓW ZAREJESTROWANYCH PRZEZ DWIE STACJE ...
throughout the year [4]. Statistical analysis of these measurements is the focus of this paper.
2. NOISE MEASURING STATIONSThe paper reports the results of a statistical analysis of
the sound level measurements recorded by permanent automatic sound and traffic volume monitoring stations in Kielce. The city of Kielce was selected as an example of a medium-sized city (with a population of about 200,000), located in the southern part of central Poland, in the margins of the Świętokrzyskie Mountains. Temperatures within a year range approximately from -5°C in January to +17°C in July. Average monthly precipitation is from 34 mm in October to 96 mm in July. The wind, predominantly from the south and west, reaches an average speed of about 10 km/h over a year. Kielce gets on average 70 days a year of snow on the ground. The data under analysis were recorded by two of such stations, one located in Krakowska Road (S1) and the other in Warszawska Road (S2).
Krakowska Road, with four lanes of traffic separated by a 3-m grass median, is the major part of the Kraków-bound thoroughfare functioning as both the transit route and the city street. The structural condition of the bituminous pavement is good. The noise monitoring station is located at the site with the following coordinates 50°51’37.8”N and 20°35’41.2”E. Figure 1 shows the location of the S1 station in the urban layout of Kielce. It is situated between two busy intersections but at substantial distance. Opposite the road, there is a large handball hall and the bus depot of the Municipal Public Transport Service. The database of the recorded data comprises 905 records in the form of calculated values of the equivalent sound level. Due to technical difficulties, the database covers only the period between 8 January and 6 December 2013 split into three sub-intervals of a 24-hour interval: day time, evening time and night time.
Warszawska Road is a two-lane road out of Kielce. The function of this road has changed. It was originally designed for heavy vehicle loads. Currently, after transformation, the road is being used mainly for municipal transport and, to a slight extent, as a transit route to Warszawa. The structural condition of the bituminous pavement is good. The noise monitoring station is located at the site with the following coordinates 50°54’15”N and 20°40’32”E. Figure 2 shows the location of the S2 station in the urban layout of Kielce. The measured equivalent sound level data from this station cover the period between 26-09-2012 and 12-11-2013, with the sample of 1022 records.
kacyjnego drogowego oraz ruchu środków transportu budowane są w niektórych miastach systemy stacjonar-nych stacji pomiarowych, rejestrujących wartości tych mezurandów przez cały rok [4]. Analiza statystyczna wyników pomiarów stacji jest celem niniejszej pracy.
2. STACJE POMIARU HAŁASUW artykule przeprowadzono analizę statystyczną
wyników pomiarów poziomu dźwięku pochodzących ze stacjonarnych, automatycznych stacji monitoro-wania poziomu dźwięku i natężenia ruchu pojazdów, znajdujących się w Kielcach. Kielce zostały wybrane jako przykładowe miasto średniej wielkości (oko-ło 200 tys. mieszkańców), położone w południowej części centralnej Polski. Miasto leży na obrzeżu Gór Świętokrzyskich. Temperatura w ciągu roku zmienia się od około -5°C w styczniu do około +17°C w lipcu. Średnie miesięczne opady atmosferyczne sięgają od 34 mm w październiku do 96 mm w lipcu. Średnia prędkość wiatru wynosi w ciągu roku około 10 km/h. Dominują wiatry zachodnie i południowe. Śnieg za-lega przez około 70 dni w roku. Analizowane wyniki zostały zarejestrowane przez dwie stacje znajdujące się przy ulicach Krakowskiej i Warszawskiej.
Ulica Krakowska, składająca się z czterech pasów ruchu, oddzielonych od siebie pasem zieleni o szeroko-ści około 3 m, stanowi główną część trasy wyjazdowej z centrum Kielc w kierunku Krakowa. Ulicą tą odbywa się zarówno ruch tranzytowy, jak i miejski. Stan tech-niczny nawierzchni bitumicznej jest dobry. Stacja moni-torująca hałas znajduje się w punkcie o współrzędnych 50°51’37.8”N i 20°35’41.2”E. Stacja znajduje się mię-dzy dwoma skrzyżowaniami o dużym natężeniu ruchu, lecz w znacznej odległości od nich (rys. 1). Po drugiej stronie jezdni znajduje się duża hala sportowa do gry w piłkę ręczną oraz zajezdnia autobusowa Miejskiego Przedsiębiorstwa Komunikacji. Baza wyników pomia-rów poziomu dźwięku została utworzona w formie wy-liczonych wartości równoważnego poziomu dźwięku. Baza ta składa się z 905 zarejestrowanych danych. Z po-wodu różnych problemów technicznych baza obejmuje okres od 8 stycznia do 6 grudnia 2013 roku, z uwzględ-nieniem trzech pór doby: dnie, wieczory i noce.
Ulica Warszawska jest dwupasmową drogą wyjaz-dową z Kielc (rys. 2). Wcześniej z drogi tej korzystało wiele pojazdów ciężarowych. Obecnie, po moderniza-cji układu komunikacyjnego Kielc, przeznaczona jest głównie dla ruchu miejskiego, jak i w nieznacznym stopniu dla ruchu tranzytowego w kierunku Warszawy. Stan techniczny nawierzchni bitumicznej jest dobry. Sta-cja monitorująca przy ulicy Warszawskiej znajduje się

172
COMPARATIVE ANALYSIS OF MEASUREMENT DATA RECORDED BY TWO TRAFFIC MONITORING ...
w miejscu o współrzędnych 50°54’15”N i 20°40’32”E. Dane pomiarowe równoważnego poziomu dźwięku za-rejestrowane przez stację obejmowały okres od 26 wrze-śnia 2012 do 12 listopada 2013 roku. Liczebność próby wyniosła 1022 wyników pomiarów.
Stacje monitoringu zainstalowane w Kielcach za-wierają miernik poziomu dźwięku, radar drogowy oraz stację pogodową. Do pomiaru natężenia ruchu użyto radaru drogowego o częstotliwości roboczej 245 MHz firmy WAVE TRONIX. Dane pogodowe zbierano za pomocą automatycznej stacji meteo VAISALA WTX 510. Pomiary akustyczne przeprowadzano przyrządem SVAN 958A, który jest czterokanałowym, cyfrowym miernikiem poziomu drgań i dźwięku klasy 1. Zakres częstotliwości pomiarowych zawiera się w przedziale od 0,5 Hz do 20 kHz, w zależności od użytego mikro-
The monitoring terminals mounted in Kielce include a sound level meter, a safety camera and a weather station. The traffic volume was measured by WAVE TRONIX digital radar with an operating frequency of 245 MHz. The weather data were recorded by means of a VAISALA WTX 510 automatic weather station. The acoustic measurements were carried out using SVAN 958A device, which is a four-channel digital vibration analyser and a class 1 sound level meter, operating within the measuring frequency range 0.5 Hz to 20 kHz, depending on a microphone used. The microphone for the acoustic pressure measurements is mounted at a distance of 4 m from the edge of the road at a height of 4 m. The measuring microphone used in this study was a Microtech Gefell MK250 free-field, prepolarised
Fig. 2. Location of the noise measuring station in Warszawska Road in the urban layout of Kielce (source: Geoportal Idea Kielce)Rys. 2. Położenie stacji pomiaru hałasu przy ulicy Warszawskiej, w układzie urbanistycznym Kielc (źródło: Geoportal Idea Kielce)
Fig. 1. Location of the noise measuring station in Krakowska Road in the urban layout of Kielce (source: Geoportal Idea Kielce)Rys. 1. Położenie stacji pomiaru hałasu przy ulicy Krakowskiej, w układzie urbanistycznym Kielc (źródło: Geoportal Idea Kielce)
Noise Measuring Station
Noise Measuring Station
173
ANALIZA PORÓWNAWCZA WYNIKÓW POMIARÓW ZAREJESTROWANYCH PRZEZ DWIE STACJE ...
fonu. Mikrofon do pomiaru ciśnienia akustycznego znajduje się w odległości 4 m od krawędzi jezdni i na wysokości 4 m. W badaniach zastosowano mikrofon pola swobodnego, pojemnościowy prepolaryzowany 1/2” firmy Microtech Gefell MK250, o czułości 50 mV/Pa, wraz z przedwzmacniaczem SV 12L, zakres częstotliwości wynosi od 3,5 Hz do 20 kHz. Zakres dy-namiki wynosi od 15 dB do 146 dB. Przyrząd może pracować w zakresie temperatur od -50°C do 100°C. Rozdzielczość detektora parametru RMS sygnału wy-nosi 0,1 dB. Pomiary prowadzono przez 24 godziny na dobę. Podczas badań rejestrowano w buforze wartość RMS poziomu dźwięku A co 1 sekundę, a wyniki za-pisywano co 1 minutę. Na podstawie tych rejestracji prowadzone były obliczenia równoważnego poziomu dźwięku dla trzech przedziałów czasowych, tj. od 6:00 do 18:00, od 18:00 do 22:00 oraz od 22:00 do 6:00.
3. WYNIKI POMIARÓWW pracy [4] poddano analizie wartości równoważne-
go poziomu dźwięku (ozn. ,Aeq TL ) wyrażanego w decy-belach, zarejestrowanego przez wybrane stacje. Para-metr ten wyznaczyć można w następujący sposób [5]:
( ) 2
,00
110 logT
AAeq T
p tL dt
T p
= ⋅ ∫
(1)
gdzie: pA(t) – wartość ciśnienia akustycznego, skory-gowana według charakterystyki częstotliwościowej A, p0 – ciśnienie akustyczne odniesienia wynoszące 20 µPa, T – całkowity czas pomiaru.
Przeprowadzone testy statystyczne Shapiro-Wilka i Jarque-Bera pozwoliły na odrzucenie hipotezy zero-wej H0 o zgodności rozkładu analizowanych danych (wyrażonych w dB) z rozkładem normalnym, na po-ziomie istotności 0,05, we wszystkich rozważanych przypadkach – dla ulicy Warszawskiej. Analogiczne testy przeprowadzone dla danych zarejestrowanych na ulicy Krakowskiej nie dawały podstaw do odrzu-cenia tej hipotezy w czterech przypadkach: dla da-nych zarejestrowanych w poniedziałkowe i czwart-kowe noce oraz w niedzielne dnie i wieczory.
Równoważny poziom dźwięku można wyznaczyć również w oparciu o następujące równanie:
2
,01
2
0
110
10
NAi
Aeq T ii
A
pL log tT p
plogp
=
= ⋅ ⋅ = ⋅
∑ (2)
1/2” condenser microphone with a sensitivity of 50 mV/Pa, SV 12L preamplifier, a frequency range 3.5 Hz to 20 kHz and a dynamic range from 15 dB to 146 dB. The temperature range within which the device is operable is from -50°C to 100°C. The resolution of the signal RMS detector is 0.1 dB. The measurements were carried out 24 hours a day. The RMS values of the A sound level were registered in the buffer every 1 s and the results were recorded every 1 minute. The equivalent sound level was calculated on this basis for three time intervals, i.e., from 6:00 to 18:00, from 18:00 to 22:00 and from 22:00 to 6:00.
3. MEASUREMENT RESULTSThe authors of [4] analysed the A-weighted
equivalent sound levels (denoted ,Aeq TL ) expressed in terms of decibels, recorded by the selected stations. This parameter can be determined as follows [5]:
( ) 2
,00
110 logT
AAeq T
p tL dt
T p
= ⋅ ∫ (1)
where: pA(t) – is the A-weighted acoustic pressure, p0 – is a reference acoustic pressure, standardized as 20 µPa, T – is the entire measurement time interval.
The Shapiro-Wilk test and the Jarque-Bera test provided sufficient evidence to reject the null hypothesis about normal distribution of the data under analysis (expressed in dB) at the significance level of 0.05 in all the cases considered – for the Warszawska Road site. The same tests applied to the data from the Krakowska Road site did not provide enough evidence to reject the null hypothesis in four cases: for the night time on Mondays and Thursdays and for the day time and evenings on Sundays.
The equivalent sound level can also be determined using:
2
,01
2
0
110
10
NAi
Aeq T ii
A
pL log tT p
plogp
=
= ⋅ ⋅ = ⋅
∑ (2)

174
COMPARATIVE ANALYSIS OF MEASUREMENT DATA RECORDED BY TWO TRAFFIC MONITORING ...
Fig. 3. Acoustic pressure changes in sub-intervals of the 24h interval for: a) Krakowska Rd, b) Warszawska RdRys. 3. Zmiany ciśnienia akustycznego z uwzględnieniem pory doby dla ulic: a) Krakowskiej, b) Warszawskiej
a) b)
Fig. 4. Box plots of pA for all measurement intervals in 2013 split into sub-intervals: a) Krakowska Rd, b) Warszawska RdRys. 4. Wykresy pudełkowe pA dla wszystkich dni pomia-rowych w roku 2013 z uwzględnieniem pory doby: a) dla ulicy Krakowskiej, b) dla ulicy Warszawskiej
a)
b)
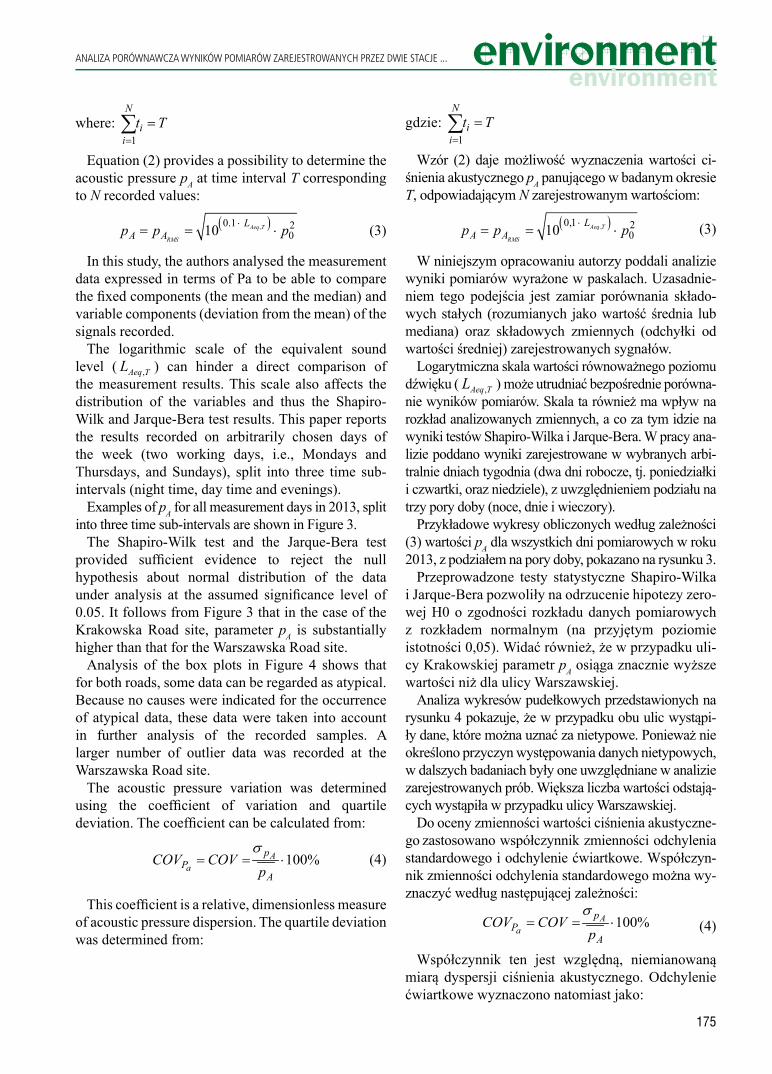
175
ANALIZA PORÓWNAWCZA WYNIKÓW POMIARÓW ZAREJESTROWANYCH PRZEZ DWIE STACJE ...
gdzie: 1
N
ii
t T=
=∑
Wzór (2) daje możliwość wyznaczenia wartości ci-śnienia akustycznego pA panującego w badanym okresie T, odpowiadającym N zarejestrowanym wartościom:
( ),0,1 2010 Aeq T
RMS
LA Ap p p⋅= = ⋅
(3)
W niniejszym opracowaniu autorzy poddali analizie wyniki pomiarów wyrażone w paskalach. Uzasadnie-niem tego podejścia jest zamiar porównania składo-wych stałych (rozumianych jako wartość średnia lub mediana) oraz składowych zmiennych (odchyłki od wartości średniej) zarejestrowanych sygnałów.
Logarytmiczna skala wartości równoważnego poziomu dźwięku ( ,Aeq TL ) może utrudniać bezpośrednie porówna-nie wyników pomiarów. Skala ta również ma wpływ na rozkład analizowanych zmiennych, a co za tym idzie na wyniki testów Shapiro-Wilka i Jarque-Bera. W pracy ana-lizie poddano wyniki zarejestrowane w wybranych arbi-tralnie dniach tygodnia (dwa dni robocze, tj. poniedziałki i czwartki, oraz niedziele), z uwzględnieniem podziału na trzy pory doby (noce, dnie i wieczory).
Przykładowe wykresy obliczonych według zależności (3) wartości pA dla wszystkich dni pomiarowych w roku 2013, z podziałem na pory doby, pokazano na rysunku 3.
Przeprowadzone testy statystyczne Shapiro-Wilka i Jarque-Bera pozwoliły na odrzucenie hipotezy zero-wej H0 o zgodności rozkładu danych pomiarowych z rozkładem normalnym (na przyjętym poziomie istotności 0,05). Widać również, że w przypadku uli-cy Krakowskiej parametr pA osiąga znacznie wyższe wartości niż dla ulicy Warszawskiej.
Analiza wykresów pudełkowych przedstawionych na rysunku 4 pokazuje, że w przypadku obu ulic wystąpi-ły dane, które można uznać za nietypowe. Ponieważ nie określono przyczyn występowania danych nietypowych, w dalszych badaniach były one uwzględniane w analizie zarejestrowanych prób. Większa liczba wartości odstają-cych wystąpiła w przypadku ulicy Warszawskiej.
Do oceny zmienności wartości ciśnienia akustyczne-go zastosowano współczynnik zmienności odchylenia standardowego i odchylenie ćwiartkowe. Współczyn-nik zmienności odchylenia standardowego można wy-znaczyć według następującej zależności:
100%Aa
pP
ACOV COV
p
σ= = ⋅
(4)
Współczynnik ten jest względną, niemianowaną miarą dyspersji ciśnienia akustycznego. Odchylenie ćwiartkowe wyznaczono natomiast jako:
where: 1
N
ii
t T=
=∑
Equation (2) provides a possibility to determine the acoustic pressure pA at time interval T corresponding to N recorded values:
( ),0.1 2010 Aeq T
RMS
LA Ap p p⋅= = ⋅ (3)
In this study, the authors analysed the measurement data expressed in terms of Pa to be able to compare the fixed components (the mean and the median) and variable components (deviation from the mean) of the signals recorded.
The logarithmic scale of the equivalent sound level ( ,Aeq TL ) can hinder a direct comparison of the measurement results. This scale also affects the distribution of the variables and thus the Shapiro-Wilk and Jarque-Bera test results. This paper reports the results recorded on arbitrarily chosen days of the week (two working days, i.e., Mondays and Thursdays, and Sundays), split into three time sub-intervals (night time, day time and evenings).
Examples of pA for all measurement days in 2013, split into three time sub-intervals are shown in Figure 3.
The Shapiro-Wilk test and the Jarque-Bera test provided sufficient evidence to reject the null hypothesis about normal distribution of the data under analysis at the assumed significance level of 0.05. It follows from Figure 3 that in the case of the Krakowska Road site, parameter pA is substantially higher than that for the Warszawska Road site.
Analysis of the box plots in Figure 4 shows that for both roads, some data can be regarded as atypical. Because no causes were indicated for the occurrence of atypical data, these data were taken into account in further analysis of the recorded samples. A larger number of outlier data was recorded at the Warszawska Road site.
The acoustic pressure variation was determined using the coefficient of variation and quartile deviation. The coefficient can be calculated from:
100%Aa
pP
ACOV COV
p
σ= = ⋅
(4)
This coefficient is a relative, dimensionless measure of acoustic pressure dispersion. The quartile deviation was determined from:
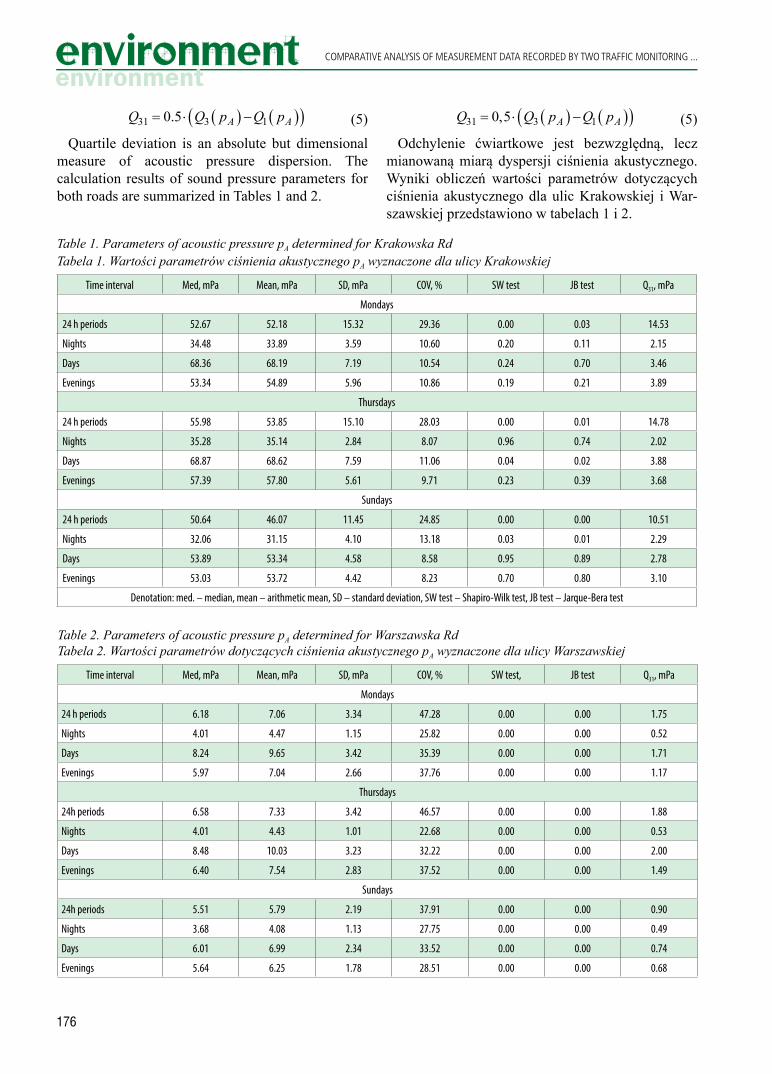
176
COMPARATIVE ANALYSIS OF MEASUREMENT DATA RECORDED BY TWO TRAFFIC MONITORING ...
( ) ( )( )31 3 1 0.5 A AQ Q p Q p= ⋅ − (5)
Quartile deviation is an absolute but dimensional measure of acoustic pressure dispersion. The calculation results of sound pressure parameters for both roads are summarized in Tables 1 and 2.
( ) ( )( )31 3 1 0,5 A AQ Q p Q p= ⋅ − (5)
Odchylenie ćwiartkowe jest bezwzględną, lecz mianowaną miarą dyspersji ciśnienia akustycznego. Wyniki obliczeń wartości parametrów dotyczących ciśnienia akustycznego dla ulic Krakowskiej i War-szawskiej przedstawiono w tabelach 1 i 2.
Table 1. Parameters of acoustic pressure pA determined for Krakowska RdTabela 1. Wartości parametrów ciśnienia akustycznego pA wyznaczone dla ulicy Krakowskiej
Time interval Med, mPa Mean, mPa SD, mPa COV, % SW test JB test Q31, mPa
Mondays
24 h periods 52.67 52.18 15.32 29.36 0.00 0.03 14.53
Nights 34.48 33.89 3.59 10.60 0.20 0.11 2.15
Days 68.36 68.19 7.19 10.54 0.24 0.70 3.46
Evenings 53.34 54.89 5.96 10.86 0.19 0.21 3.89
Thursdays
24 h periods 55.98 53.85 15.10 28.03 0.00 0.01 14.78
Nights 35.28 35.14 2.84 8.07 0.96 0.74 2.02
Days 68.87 68.62 7.59 11.06 0.04 0.02 3.88
Evenings 57.39 57.80 5.61 9.71 0.23 0.39 3.68
Sundays
24 h periods 50.64 46.07 11.45 24.85 0.00 0.00 10.51
Nights 32.06 31.15 4.10 13.18 0.03 0.01 2.29
Days 53.89 53.34 4.58 8.58 0.95 0.89 2.78
Evenings 53.03 53.72 4.42 8.23 0.70 0.80 3.10
Denotation: med. – median, mean – arithmetic mean, SD – standard deviation, SW test – Shapiro-Wilk test, JB test – Jarque-Bera test
Table 2. Parameters of acoustic pressure pA determined for Warszawska RdTabela 2. Wartości parametrów dotyczących ciśnienia akustycznego pA wyznaczone dla ulicy Warszawskiej
Time interval Med, mPa Mean, mPa SD, mPa COV, % SW test, JB test Q31, mPa
Mondays
24 h periods 6.18 7.06 3.34 47.28 0.00 0.00 1.75
Nights 4.01 4.47 1.15 25.82 0.00 0.00 0.52
Days 8.24 9.65 3.42 35.39 0.00 0.00 1.71
Evenings 5.97 7.04 2.66 37.76 0.00 0.00 1.17
Thursdays
24h periods 6.58 7.33 3.42 46.57 0.00 0.00 1.88
Nights 4.01 4.43 1.01 22.68 0.00 0.00 0.53
Days 8.48 10.03 3.23 32.22 0.00 0.00 2.00
Evenings 6.40 7.54 2.83 37.52 0.00 0.00 1.49
Sundays
24h periods 5.51 5.79 2.19 37.91 0.00 0.00 0.90
Nights 3.68 4.08 1.13 27.75 0.00 0.00 0.49
Days 6.01 6.99 2.34 33.52 0.00 0.00 0.74
Evenings 5.64 6.25 1.78 28.51 0.00 0.00 0.68

177
ANALIZA PORÓWNAWCZA WYNIKÓW POMIARÓW ZAREJESTROWANYCH PRZEZ DWIE STACJE ...
Analysis of the acoustic pressure distribution in Table 1 allows the inference that for the 24 h interval in each case, there is sufficient evidence to reject the null hypothesis H0 (at the significance level of 0.05), whereas for the sub-intervals no such evidence exists. This finding is confirmed by the limiting values of probabilities (allowing the rejection of the H0) determined based on the Shapiro-Wilk and Jarque-Bera tests, and by small differences between the expected values and medians. The results support the conclusions concerning normal distribution of the equivalent sound levels expressed in dB, as presented in [4]. The analysis of the coefficient of variation did not allow defining clearly the sub-interval for which the variable components of the signal referred to its mean value were the lowest.
Analysis of the data in Table 2 allows the inference that in all the cases considered, there is sufficient evidence to reject the null hypothesis H0 (at the significance level of 0.05). The results support the conclusions concerning normal distribution of the equivalent sound levels expressed in dB, as presented in [4]. In the case of the Warszawska Road site, the differences between the expected values and medians are greater. The lowest coefficients of variation were obtained for the data recorded at night.
The analysis of acoustic pressure deviations from the mean was performed due to difficulties in using the COV for clearly defining the sub-intervals for which its values were the lowest. The deviations can be calculated from the equation:
iA Ai Ap p p∆ = − (6)
This parameter can be used for analysing the variable components of the signal. The authors of this paper decided to determine the expected value of the magnitude of these deviations (denoted
iAp∆ ) and their root-mean-square value (denoted RMS). It has to be noted that the coefficient of variation cannot be used for this purpose because the mean value of the deviations 0.Ap∆ =
Table 3 compiles the parameters calculated for the acoustic pressure deviations from the mean value
iAp∆ for both locations, Krakowska Road and Warszawska Road.
Analiza wyników dotyczących rozkładów ciśnienia akustycznego przedstawionych w tabeli 1 prowadzi do wniosku, że dla pory-doby w każdym przypadku są podstawy do odrzucenia hipotezy zerowej H0 (na poziomie istotności 0,05), natomiast dla innych pór w kilku analizowanych przypadkach brak jest podstaw do odrzucenia hipotezy H0. Fakt ten potwierdzają war-tości granicznych prawdopodobieństw (pozwalających na odrzucenie H0), wyznaczonych w oparciu o testy Shapiro-Wilka i Jarque-Bera, jak również niewielkie różnice między otrzymanymi wartościami oczekiwa-nymi i medianami. Rezultaty te potwierdzają wnioski dotyczące normalności rozkładów wartości równoważ-nych poziomów dźwięku wyrażonych w dB, przedsta-wione w pracy [4]. Analiza wartości współczynnika COV nie pozwoliła na jednoznaczne określenie pory dnia, dla której składowe zmienne sygnału, odniesione do jego wartości średniej, są najmniejsze.
Analiza danych przedstawionych w tabeli 2 prowadzi do wniosku, że dla wszystkich rozważanych przypad-ków istnieją podstawy do odrzucenia hipotezy zerowej H0 (na poziomie istotności 0,05). Rezultaty te potwier-dzają wnioski dotyczące normalności rozkładów war-tości równoważnych poziomów dźwięku wyrażonych w dB, przedstawione w pracy [4]. W przypadku uli-cy Warszawskiej większe są również różnice między otrzymanymi wartościami oczekiwanymi i media-nami. Najmniejsze wartości współczynników COV otrzymano dla danych zarejestrowanych w nocy.
Ze względu na trudności związane z wykorzysta-niem współczynnika COV do jednoznacznego wska-zania pór doby, dla których osiągał on wartości naj-mniejsze, przeprowadzono analizę odchyłek ciśnienia akustycznego od jego wartości średniej. Odchyłki te można wyznaczyć według następującego równania:
iA Ai Ap p p∆ = − (6)
Jest to parametr, który można wykorzystać do bada-nia składowych zmiennych analizowanego sygnału. Dla tak wyznaczonych odchyłek autorzy postanowili wy-znaczyć wartość oczekiwaną ich modułu (oznaczenie
iAp∆ ) oraz ich wartość skuteczną (oznaczenie RMS). Należy zwrócić uwagę na fakt, że w przypadku analizo-wania odchyłek sygnału ciśnienia akustycznego od jego wartości średniej nie można wykorzystać współczynnika COV, ponieważ wartość średnia odchyłek 0.Ap∆ =
W tabeli 3 przedstawiono wartości parametrów wyznaczonych dla odchyłek ciśnienia akustycznego od jego wartości średniej
iAp∆ dla ulic Krakowskiej i Warszawskiej.

178
COMPARATIVE ANALYSIS OF MEASUREMENT DATA RECORDED BY TWO TRAFFIC MONITORING ...
In the case of Warszawska Rd, the deviations from the mean were noticeably lower. Among the three acoustic pressure deviation parameters shown in Table 3, the highest variation for different time intervals was observed in the RMS value. It has to be noted that here, the RMS value was the same as that of the loaded estimator of standard deviation. The highest RMS values for all the time intervals studied were obtained for the daytime data.
4. CONCLUSIONSAnalysis of the results obtained for the distribution
of acoustic pressure, expressed in terms of Pa or dB, in Krakowska Rd leads to the conclusion that for the 24-hour interval, there are grounds to reject the null hypothesis in each case analysed (at the significance level of 0.05), whereas no grounds were found to reject the H0 in the case of the sub-intervals. This finding is confirmed by the limiting values of probabilities (that allow the rejection of the H0) determined based on the Shapiro-Wilk and Jarque-Bera tests and by slight differences between the expected values and medians. In the case of Warszawska Road, there is enough evidence to reject the H0 in all the cases under analysis.
The coefficient of variation is a parameter that satisfactorily describes a variable component of an
Znacznie mniejsze wartości odchyłek ciśnienia akustycznego od jego wartości średniej otrzymano w przypadku ulicy Warszawskiej. Spośród trzech pa-rametrów sygnału odchyłek ciśnienia akustycznego przedstawionych w tabeli 3 najbardziej zróżnicowane wartości dla różnych pór-doby ma wartość skutecz-na sygnału. Warto zwrócić uwagę, że w rozważanym przypadku wartość parametru RMS jest taka sama jak obciążonego estymatora odchylenia standardowego. Największe wartości parametru RMS dla wszystkich analizowanych pór doby uzyskano dla danych zareje-strowanych dla pory-dnie.
4. WNIOSKIAnaliza wyników dotyczących rozkładów warto-
ści ciśnienia akustycznego wyrażonego w paskalach lub decybelach, przy ulicy Krakowskiej, prowadzi do wniosku, że dla pory-doby w każdym przypadku są podstawy do odrzucenia hipotezy zerowej H0 (na poziomie istotności 0,05), natomiast dla innych pór w kilku analizowanych przypadkach brak jest pod-staw do odrzucenia tej hipotezy. Fakt ten potwierdza-ją wartości granicznych prawdopodobieństw (pozwa-lających na odrzucenie H0) wyznaczonych w oparciu o testy Shapiro-Wilka i Jarque-Bera, jak również niewielkie różnice między otrzymanymi wartościami oczekiwanymi i medianami. W przypadku ulicy War-
Table 3. Parameters of acoustic pressure deviations from the mean determined for Krakowska and Warszawska roads, split into measurement intervalsTabela 3. Wartości parametrów dotyczących odchyłek ciśnienia akustycznego od wartości średnich w poszczególnych porach wyznaczone dla ulic Krakowskiej i Warszawskiej
Time interval Med, mPaiAp∆ , mPa RMS, mPa Med, mPa
iAp∆ , mPa RMS, mPa
Mondays Krakowska Warszawska
24h periods 0.49 13.13 15.26 -0.88 2.49 3.32
Nights 0.59 2.73 3.55 -0.46 0.85 1.14
Days 0.17 5.18 7.10 -1.41 2.62 3.38
Evenings -1.56 4.85 5.89 -1.07 2.02 2.63
Thursdays
24 h periods 2.13 13.12 15.04 -0.75 2.60 3.40
Nights 0.14 2.27 2.81 -0.42 0.79 1.00
Days 0.25 5.35 7.50 -1.55 2.62 3.20
Evenings -0.41 4.60 5.55 -1.14 2.20 2.80
Sundays
24 h periods 4.57 10.07 11.40 -0.28 1.48 2.19
Nights 0.92 3.10 4.06 -0.40 0.82 1.12
Days 0.55 3.58 4.52 -0.98 1.75 2.32
Evenings -0.69 3.54 4.37 -0.62 1.20 1.77

179
ANALIZA PORÓWNAWCZA WYNIKÓW POMIARÓW ZAREJESTROWANYCH PRZEZ DWIE STACJE ...
Acknowledgments:This work was supported by Kielce University of Technology, Grant No. 01.0.04.00/2.01.01.01.0019 MNSP.MKME.17.001
acoustic pressure signal. This coefficient is not suitable for analysing deviations of the variable from its mean. The use of the median for determining coefficients of variation seems to be an option worth considering. For analysis of acoustic pressure deviations from the mean, the RMS value can be successfully used.
References[1] Batko W., Stępięń B., Type A Standard Uncertainty of Long-Term Noise Indicator, “Arch. Acoust.”, Vol. 39, Issue 1,
2014, pp. 25-36, DOI: 10.2478/aoa-2014-0004.[2] Gardziejczyk W., Motylewicz M., Noise level in the vicinity of signalized roundabouts, “Transportation Research Part
D: Transport and Environment”, Volume 46, July 2016, pp. 128-144, DOI :10.1016/j.trd.2016.03.016.[3] Przysucha B., Batko W., Szeląg A., Analysis of the Accuracy of Uncertainty Noise Measurement, “Arch. Acoust.”,
Vol. 40, No. 2, 2015, pp. 183-189, DOI: 10.1515/aoa-2015-0020.[4] Bąkowski A., Radziszewski L., Skrobacki Zb., Assessment of uncertainty in urban traffic noise measurements,
“Procedia Engineering 177”, Vol. 177, 2017, pp. 281-288.[5] Wszołek T., Kłaczyński M., Effect of traffic noise statistical distribution on Laeq,T measurement uncertainty, “Arch.
Acoust.”, Vol. 31, Issue 4 (Supplement), 2016, pp. 311-318.
szawskiej we wszystkich badanych przypadkach są podstawy do odrzucenia hipotezy zerowej H0.
Parametrem zadowalająco opisującym składową zmienną sygnału ciśnienia akustycznego jest współ-czynnik COV. Współczynnik ten nie nadaje się do analizy odchyłek analizowanej zmiennej od jej war-tości średniej. Można jednak rozważyć wykorzysta-nie do wyznaczania współczynników COV odchyłek ich medianę. W przypadku analizy odchyłek ciśnie-nia akustycznego od wartości średniej ich zmienność dobrze opisuje parametr RMS.
Podziękowania:Praca była finansowana przez Politechnikę Świętokrzyską, grant nr 01.0.04.00/2.01.01.01.0019 MNSP.MKME.17.001

180
Fig. 1. Principle of gas heat pumps [1]: 1 – heating element, 2 – flue gas heat exchanger, 3 – heat exchanger – engine cooler, 4 – condenser, 5 – flue gas condenser, 6 – pump of the heating system, 7 – gas engine, 8 – compressor, 9 – expansion valve, 10 – evaporator, 11 – ambient air
MILAN MALCHO1
RICHARD LENHARDMARTIN VANTÚCHKATARÍNA KADUCHOVÁTOMÁŠ PUCHOR
University of Zilina, Slovakia1 e-mail: [email protected]
WORKING PARAMETERS OF GAS HEAT PUMP IN USE WITH LOW-POTENTIAL GEOTHERMAL ENERGYPARAMETRY PRACY GAZOWEJ POMPY CIEPŁA
WYKORZYSTUJĄCEJ GEOTERMALNĄ NISKIEJ ENTALPIIDOI: 10.30540/sae-2018-018
A b s t r a c tThe article presents the operating parameters of the heat pump for gas with low potential geothermal energy. It describes the measurement device and implementations of the experimental measurements resulted in a database of relevant data on the conversion of primary energy to natural gas to GHP heat, using low potential energy from a deep well.
Keywords: technological scheme diagram, heat pumps, heat exchanger, heating system
S t r e s z c z e n i eW artykule przedstawiono parametry pracy gazowej pompy ciepła, korzystającej z energii geotermalnej niskiej entalpii. Zaprezentowano wykorzystywane stanowisko pomiarowe, a także zastosowanie wyników pomiarów do budowy bazy da-nych eksperymentalnych na temat konwersji energii pierwotnej gazu ziemnego w ciepło, przy użyciu pompy ciepła współ-pracującej z pionowym wymiennikiem gruntowym.
Słowa kluczowe: schemat technologiczny, pompa ciepła, wymiennik ciepła, system grzewczy
Manuscript submitted 2018.03.26 – revised 2018.03.28, initially accepted for publication 2018.03.30, published in June 2018

181
PARAMETRY PRACY GAZOWEJ POMPY CIEPŁA WYKORZYSTUJĄCEJ GEOTERMALNĄ NISKIEJ ENTALPII
1. INTRODUCTIONFrequently used alternative heat sources include
heat pumps. Heat pumps are devices that acquire energy from the surrounding environment and use the physical changes of the working fluid (refrigerant) to transform it to a higher level – practically usable for heating. It is a wasteless technology using renewable energy sources that can fully replace conventional heat sources. One of the most promising applications is gas heat pumps. The advantage of gas heat pumps is the ease of their integration into the current energy infrastructure and the reduction of carbon dioxide emissions. The gas heat pump utilizes a plurality of heat sources that derive heat not only from the ambient air but also from the engine cooling circuit and the flue gas produced as shown in Figure 1. For this reason, the gas heat pump is a highly energy-efficient device.
2. CHARACTERISTICS AND CONNECTION OF THE GAS HEAT PUMP
As gas heat pumps exist only in air/water systems, a modification of the original type of gas heat pump to the ground/water system was carried out according to the scheme in Figure 2. By implementing experimental equipment with the necessary instrumentation, a unique device has been obtained that can verify different heat sources for a gas heat pump and perform detailed energy balance measurements and thermal performances in real conditions.
The experimental device is installed in the University of Žilina Campus. It is a model AISIN Toyota 10 HP model AXYGP 280 El with a heating output of 33.5 kW. The primary side of the heat pump is connected to a 150 m deep ground bore where the earth probe is
built. The earth probe consists of a double U-profile of the PE-Xa pipe system (polyethylene formed under high pressure) which is commonly used in practice for the purpose of high efficiency earth heat collection. The working medium of U-heat exchangers is a 50/50 mixture of ethylene glycol and water. This mixture is anti-freeze, which prevents freezing in the evaporator of the heat pump. The ground probe circuit is connected to a heat exchanger in which the low-potential terrestrial energy is delivered to the refrigerant in the primary circuit of GHP. The gas heat pump consists of an external and an internal unit that are interconnected with the refrigerant circuit (R410a). The outdoor unit also contains the original air-refrigerant evaporators, fans, a gas-fueled combustion engine with a heat exchanger for pre-heating the refrigerant and the compressor shown in Figure 2. The indoor unit of the experimental device is located in the BI 412 laboratory. In it, the thermal energy recovered from the earth is transferred to the heating system using a heat exchanger (condenser). The heating medium at the outlet of the indoor unit serves to heat the NI corridor around the laboratories, through several water heaters, the fan coils. A heat exchanger from the engine cooling is also involved in the heat production, HOTKIT. In this case, HOTKIT was not involved in total heat production.
3. RESULTS OF ExPERIMENTAL MEASUREMENTThe experimental measurement took place from
19.3 to 25.3 and the gas heat pump was operating for the entire heating time, with a pre-set heating temperature of 43°C ±2°C. The individual measured parameters needed to evaluate the energy efficiency
Fig. 2. Technological scheme diagram of the experimental apparatus

182
WORKING PARAMETERS OF GAS HEAT PUMP IN USE WITH LOW-POTENTIAL GEOTHERMAL ENERGY
Fig. 3. The average daily consumption of energy consumed by the gas heat pump
Fig. 4. COP and PER gas-water heat pump
Table 1. Average daily temperature and media flow rate for the primary and secondary side
DateTemperature VRT
output, °C Temperature VRT
input, °CFlow VRT,
m3·h-1
Temperature AWS output, °C
Temperature AWS input , °C
Flow AWS,m3·h-1
19.3 9.72 3.34 5.58 45.00 41.15 4.84
20.3 9.87 2.52 5.58 44.84 41.21 5.52
21.3 9.98 2.53 5.58 44.87 41.22 5.24
22.3 10.05 2.52 5.58 44.73 41.26 5.55
23.3 10.03 2.20 5.58 44.70 41.28 5.53
24.3 10.00 2.26 5.58 44.77 41.28 5.55
25.3 9.85 2.50 5.58 44.93 41.20 5.55
Average 9.93 2.55 5.58 44.83 41.23 5.40
183
PARAMETRY PRACY GAZOWEJ POMPY CIEPŁA WYKORZYSTUJĄCEJ GEOTERMALNĄ NISKIEJ ENTALPII
of the GHP were recorded at minute intervals and the hourly averages were then calculated. From the measured data, the charts were created for the individual measurement days and the whole measurement time was finally evaluated.
Figure 3 shows the average daily consumption of energy consumed by the gas heat pump. Daily gas consumption averaged 9 kWh/24 h. Electricity consumption for primary pump (0.83 kWh/24 hours) and secondary (0.32 kWh/24 hr) was constant during the measurement period.
The average daily temperatures and flow rates of the working medium on the primary and secondary side are shown in Table. 1. On the primary side (deep borehole) there was the difference in temperature Δt = 7.3°C and the working medium flow 5.58 m3·h-1. On the secondary side was determined the average difference of the heating water temperatures ~t = 3.6°C and the flow was 5.4 m3·h-1.
After measuring and evaluating the necessary parameters, the energy efficiency of the experimental device was determined. Energy efficiency Assessed against two Coefficients of Performance (COP) and PER (Primary Energy Ratio).
4. CONCLUSIONBy modifying the air-to-ground GHP system to
the ground-water system, the Earth heat analysis was confirmed as a potential heat source suitable for gas heat pumps. Throughout the measurement period, the heating factor ranged from COP = 2 to 2.68, corresponding to the PER = 0.52 to 0.64. Implementation of the experimental measurements has resulted in a database of relevant data on the conversion of primary energy to natural gas to GHP heat, taking low-potential energy from deep borehole.
AcknowledgementThis publication is the result of the project implementation: Device for the use of low-potential geotermal heat without forced circulation of the heat carier in deep boreholes, ITMS 26220220057 supported by the Operational Programme Research and development funded by the ERDF.
REFERENCES[1] Bakker E. et al., Gas heat pump. Netherlands: GassTerra/Castel International Publishers, 2010.[2] Baehr H.D., Stephan K., Heat and mass transfer. Berlin: Springer, 2006, p. 688. [3] Lenhard R., Malcho M., Numerical simulation device for the transport of geothermal heat with forced circulation of
media. Mathematical and Computer Modelling, 2013, 57, 1-2, pp. 111-125, ISSN 0895-7177.[4] Lenhard R., Gavlas S., Malcho M., Numerical simulation of borehole model which utilizes low-potential geothermal
heat. Czech Republic, Proc. of Conf. Experimental fluid mechanics, 2011.[5] Malcho M. et al., Modifikácia plynového tepelného čerpadla vzduch – voda pre iné druhy nízkopotenciálneho tepla.
Bratislava, 2012, ISBN 978-80-89216-45-1.[6] Plynové tepelné čerpadlá, www.yzamer.sk.[7] Janovcová M., Výskum činnosti premeny primárnej energie v tepelných čerpadlách s elektrickým a plynovým pohonom
v reálnych podmienkach. Diploma work. 2015.

184
1. INTRODUCTIONDevelopment and introduction of new energy
technology is very important for safeness delivery, tenability and competitiveness energy sectors. Research pertinent to energetics considerably contribute for energy effectiveness (e.g. in the engine of cars) and diversification of energy through piggybacking on revivable source of power. Balk renewable energy sources range from too low – potentially heat contained in the surface and those situated more deeply below neutral zone (10-20 m away from the levels of surface earth). Heat is possible to gain in several ways. One of them is the system of vertical heat exchangers (earth probes). The system with vertical heat – exchanger does not require big jerked – in – fillings and is independent from the intense solar radiation, which impinges topsides earth. Vertical heat – exchangers effectively work virtually in all the geological environments, besides soils with low thermic conductivity (for example they are in dry sand or dry gravel).
In the surrounding of ZU there are two boreholes of 150 m depths for retrieving low – potential heat on principle vertical exchangers through the medium:– forced circulation heat carrier substance (with
brine circulation),– circulation heat carrier substance (heat pipes
technology) on thermosyphon principle.
2. IMPLEMENTATION BOREHOLE FOR LOW-POTENCIAL HEAT TRANSPORT
Laboratory results from measuring on simulation field prepared for laboratory measurement, provided information for the next progress realization in the real conditions.
Two boreholes of over 150 meters depth were drilled at distance approximately 25 meters apart to avoid mutual thermic influenced. By the realization propeller with forced circulation with brine media was treated the same way as is used to heat the pump type of ground-water. This means U-type pipe PE
MARTIN VANTÚCH1
ANDREJ KAPJORMICHAL HOLUBčÍK
University of Zilina, Slovakia1 e-mail: [email protected]
ALTERNATIVE METHODS OF OBTAINING GEOTHERMAL HEAT FROM THE EARTH
ALTERNATYWNE METODY POZYSKIWANIA CIEPŁA Z WNĘTRZA ZIEMI
DOI: 10.30540/sae-2018-019
A b s t r a c tThe paper describes the possibility of obtaining low-potential heat of the earth from deep borehole. It describes the possibilities of using a heat pump in combination with a heat pipe. The gravity heat pipe with the working substance represents an alternative and more efficient heat transfer technique from the vertical earth borehole. The article describes the possibilities and measurements of using this method on the primary side of the ground / water heat pump.
Keywords: geothermal energy, heat pumps
S t r e s z c z e n i eArtykuł przedstawia możliwości odzysku niskotemperaturowego ciepła z wnętrza ziemi przy użyciu pionowego wymiennika gruntowego. Opisuje on zastosowanie pompy ciepła współpracującej z rurą ciepła. Takie rozwiązanie w przypadku wymiennika pionowego stanowi interesującą koncepcję. Prezentowany wymiennik ciepła w takim przypadku cechuje się większą wydajnością. Praca przedstawia możliwości i wyniki pomiarów dla pierwotnej strony układu pompy ciepła.
Słowa kluczowe: energia geotermalna, pompy ciepła
Manuscript submitted 2018.03.26 – revised 2018.03.28, initially accepted for publication 2018.03.30, published in June 2018

185
ALTERNATYWNE METODY POZYSKIWANIA CIEPŁA Z WNĘTRZA ZIEMI
100 RC is embedded in the soil massif with special sensors temperature. Sensors were attached to the pipe axis grouting duct designated for supply of bentonite to the bottom of the borehole. Liquid bentonite is then filled to the free space and air bubbles in the borehole from the bottom up to the surface of the tubes are removed. Contact surface of the tubes will provide more efficient heat transfer to vertical heat exchangers. Temperature sensors were positioned to detect high temperatures accelerate changes in four different depth of the borehole and in the range 150, 100, 50 meters and 2 m close to the ground surface. The thermocouples type K (NiCr-Ni) series TFAU were used. There being it is an thermocouple wires, it should provide safe berth of the measurement ends so as not to damage when the pipes set into the ground. For this reason, these thermocouples were attached to removal ribbons of short sections of pipe for injection, which is held in the middle of the piping system of PE 100 RC geothermal probes.
Thermocouples are so protected in the pipe to collect heat. Heat pipe of the second hole is made in the same way, but on the surface of the borehole they will be equipped with specially designed heat exchanger for heat pipes of this type. Gravitational heat pipe working on the principle of phase transition working substance of CO2 will work under high pressure because at 0°C exists saturated vapor pressure of this substance around 35 bar. It is 5 times more than in ammonia NH3 (R717), which is also part of the experiment using heat pipe.
This method of obtaining low-potential heat by HP is a method in the research stage. It is therefore necessary to have a detailed overview of all the thermodynamic processes in its operation. Stainless steel heat exchanger for HP will be planted about 1.5 meters in the ground in sewage shaft on the concrete surface.
Fig. 1. Scheme for obtaining low-power heat
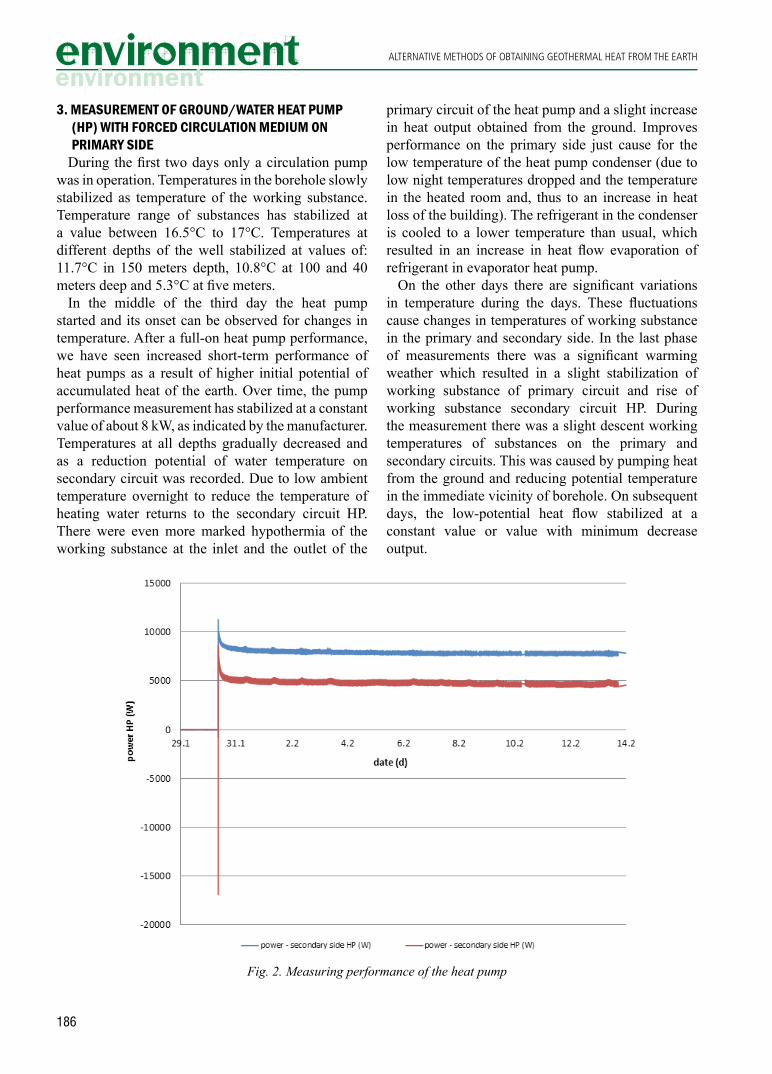
186
ALTERNATIVE METHODS OF OBTAINING GEOTHERMAL HEAT FROM THE EARTH
3. MEASUREMENT OF GROUND/WATER HEAT PUMP (HP) WITH FORCED CIRCULATION MEDIUM ON PRIMARY SIDE
During the first two days only a circulation pump was in operation. Temperatures in the borehole slowly stabilized as temperature of the working substance. Temperature range of substances has stabilized at a value between 16.5°C to 17°C. Temperatures at different depths of the well stabilized at values of: 11.7°C in 150 meters depth, 10.8°C at 100 and 40 meters deep and 5.3°C at five meters.
In the middle of the third day the heat pump started and its onset can be observed for changes in temperature. After a full-on heat pump performance, we have seen increased short-term performance of heat pumps as a result of higher initial potential of accumulated heat of the earth. Over time, the pump performance measurement has stabilized at a constant value of about 8 kW, as indicated by the manufacturer. Temperatures at all depths gradually decreased and as a reduction potential of water temperature on secondary circuit was recorded. Due to low ambient temperature overnight to reduce the temperature of heating water returns to the secondary circuit HP. There were even more marked hypothermia of the working substance at the inlet and the outlet of the
primary circuit of the heat pump and a slight increase in heat output obtained from the ground. Improves performance on the primary side just cause for the low temperature of the heat pump condenser (due to low night temperatures dropped and the temperature in the heated room and, thus to an increase in heat loss of the building). The refrigerant in the condenser is cooled to a lower temperature than usual, which resulted in an increase in heat flow evaporation of refrigerant in evaporator heat pump.
On the other days there are significant variations in temperature during the days. These fluctuations cause changes in temperatures of working substance in the primary and secondary side. In the last phase of measurements there was a significant warming weather which resulted in a slight stabilization of working substance of primary circuit and rise of working substance secondary circuit HP. During the measurement there was a slight descent working temperatures of substances on the primary and secondary circuits. This was caused by pumping heat from the ground and reducing potential temperature in the immediate vicinity of borehole. On subsequent days, the low-potential heat flow stabilized at a constant value or value with minimum decrease output.
Fig. 2. Measuring performance of the heat pump
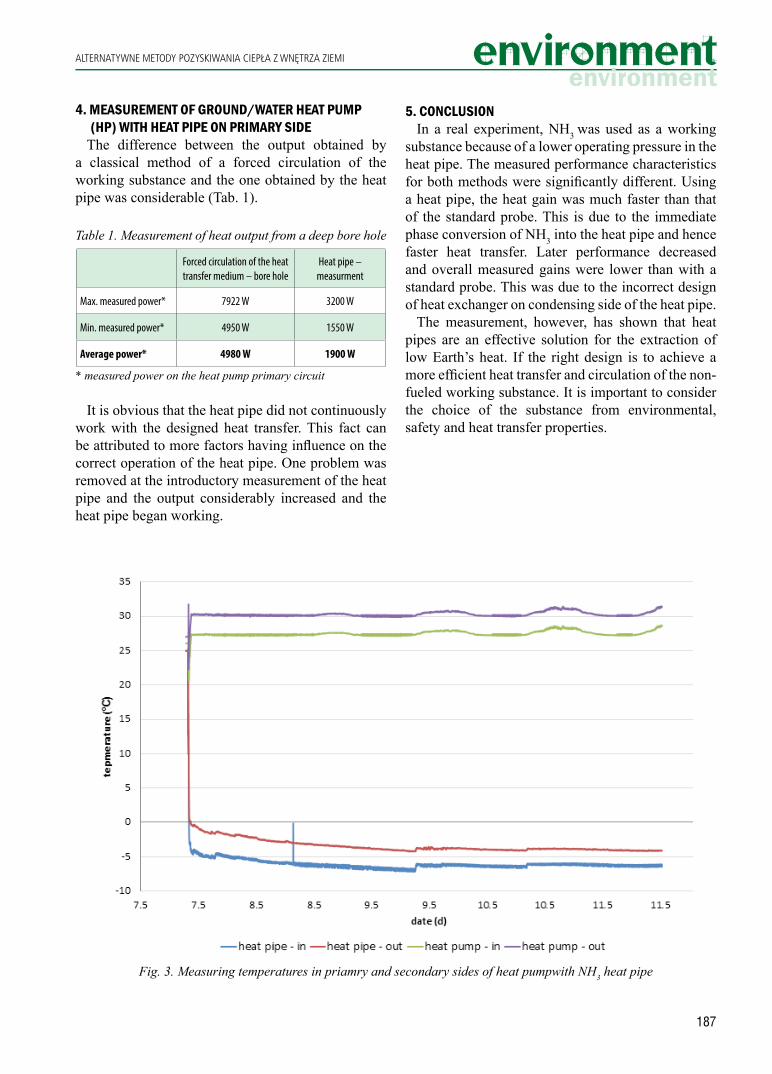
187
ALTERNATYWNE METODY POZYSKIWANIA CIEPŁA Z WNĘTRZA ZIEMI
Fig. 3. Measuring temperatures in priamry and secondary sides of heat pumpwith NH3 heat pipe
4. MEASUREMENT OF GROUND/WATER HEAT PUMP (HP) WITH HEAT PIPE ON PRIMARY SIDE
The difference between the output obtained by a classical method of a forced circulation of the working substance and the one obtained by the heat pipe was considerable (Tab. 1).
It is obvious that the heat pipe did not continuously work with the designed heat transfer. This fact can be attributed to more factors having influence on the correct operation of the heat pipe. One problem was removed at the introductory measurement of the heat pipe and the output considerably increased and the heat pipe began working.
Table 1. Measurement of heat output from a deep bore hole
Forced circulation of the heat transfer medium – bore hole
Heat pipe – measurment
Max. measured power* 7922 W 3200 W
Min. measured power* 4950 W 1550 W
Average power* 4980 W 1900 W
* measured power on the heat pump primary circuit
5. CONCLUSIONIn a real experiment, NH3 was used as a working
substance because of a lower operating pressure in the heat pipe. The measured performance characteristics for both methods were significantly different. Using a heat pipe, the heat gain was much faster than that of the standard probe. This is due to the immediate phase conversion of NH3 into the heat pipe and hence faster heat transfer. Later performance decreased and overall measured gains were lower than with a standard probe. This was due to the incorrect design of heat exchanger on condensing side of the heat pipe.
The measurement, however, has shown that heat pipes are an effective solution for the extraction of low Earth’s heat. If the right design is to achieve a more efficient heat transfer and circulation of the non-fueled working substance. It is important to consider the choice of the substance from environmental, safety and heat transfer properties.
188
ALTERNATIVE METHODS OF OBTAINING GEOTHERMAL HEAT FROM THE EARTH
AcknowledgementThis publication is the result of the project implementation: Device for the use of low-potential geotermal heat without forced circulation of the heat carier in deep boreholes, ITMS 26220220057 supported by the Operational Programme Research and development funded by the ERDF.
REFERENCES[1] Nemec P., Výskum kapilárnych tepelných trubíc pre prevádzkové teploty od -30 do +50°C. Zilina, Diploma work
under supervision of: Milan Malcho, Žilinská univerzita v Žiline, Žilina 2010.[2] Lenhard R., Numerical simulation device for the transport of geothermal heat with forced circulation of media.
Kuching – Sarawak – Malaysia: Proc. of Fourth Global Conference on PCO 2010, 2010.[3] Lenhard R., Jandačka J., Jakubsky M., Zariadenia na simuláciu transformácie nízkopotenciálneho geotermálneho
tepla na teplo vhodné pre vykurovanie. Žilina 2010.[4] Čaja A., Nemec P., Malcho M., The dependence of quantum and filling type to heat transport of gravity heat pipe.
Liberec: Proc of Conf. Experimental fluid mechanics 2010, 2010.[5] Jakubsky M., Lenhard R., Simulácia geotermálnych procesov: zariadenie na využitie nízko potenciálneho
geotermálneho tepla bez núteného obehu tepelného nosiča v hlbokom vrte. „PRO-ENERGY magazín“ 2010, 4, pp. 56-58, ISSN 1802-4599.
[6] Lenhard R., Jakubsky M., Nemec P., Device for simulation of transfer geothermal heat with forced and without forced circulation of heat carrier. Kuching, Malaysia. Power control and optimization: proc. of fourth global conference. 2010, ISBN 978-983-44483-32.
[7] Lenhard R., Malcho M., Numerical simulation device for the transport of geothermal heat with forced circulation of media. „Mathematical and Computer Modelling“, 2013, 57, 1-2, pp. 111-125.
189
A b s t r a c tThis article reports the results of a study evaluating the effect of natural zeolite and silica fume on the properties of cement mortar. The study used binders in which 20% of portland cement was replaced with the pozzolanic admixtures. Both admixtures were studied separately and combined as a 1:1 blend. Reference samples were produced with non-modified cement binders. The tests were conducted for hydration kinetics on cement pastes, consistencies and strength in flexure and compression on mortars. The results indicated that different pozzolans affected the mortar differently. The effect of zeolite and silica fume blend on the properties of mortars is not an averaged effect of those admixtures used individually.
S t r e s z c z e n i eNiniejsze opracowanie dotyczy wpływu zeolitu naturalnego i pyłu krzemionkowego na właściwości zaprawy cementowej. W tym celu sporządzono spoiwa, w których 20% cementu portlandzkiego zastępowano dodatkami pucolanowymi. Oba dodatki przebadano oddzielnie, jak i łącznie w formie mie-szanki pucolan w stosunku 1:1. Próbki odniesienia wykonano z niemodyfikowanego spoiwa cementowego. Wykonano ba-dania kinetyki hydratacji na zaczynach oraz konsystencji, jak również wytrzymałości na zginanie i ściskanie na zapra-wach. Wyniki badań wykazały, że wpływ różnych rodzajów pucolan na właściwości zaprawy jest odmienny. Wpływ mie-szanki zeolitu i pyłu krzemionkowego na właściwości zapra-wy nie jest uśrednionym wpływem, jaki wywierają te dodatki stosowane oddzielnie.
ANNA SKAWIŃSKAALEKSANDRA TKOCZPELAGIA LASKA-JÓZEFCZAK TOMASZ FOSZCZ
THE POSSIBILITY OF THE USE OF SECONDARY RAW MATERIALS FROM ENERGY AND IRON&STEEL INDUSTRIES FOR GLASS-CERAMICS PRODUCTION
MOŻLIWOŚĆ WYKORZYSTANIA SUROWCÓW WTÓRNYCH PRZEMYSŁU ENERGETYCZNEGO I HUTNICZEGO DO WYTWARZANIA SZKŁA-CERAMIKI
Structure and Environment No. 2/2018, vol. 10, p. 114 DOI: 10.30540/sae-2018-011
A b s t r a c tAn effective way to glass strengthening is controlled crystallization, which results in obtaining the material with very favourable mechanical properties compared to parent glass. Crystallization process is conducted between glass transformation temperature and liquidus temperature. Information concerning the production of glass-ceramics material, as well as materials, which are the most commonly used in its production, were analyzed in this paper.
S t r e s z c z e n i eSkutecznym sposobem wzmocnienia szkła jest kontrolo-wana krystalizacja, co skutkuje otrzymaniem materiału o bardzo dobrych właściwościach mechanicznych w po-równaniu do szkła macierzystego. Proces krystalizacji pro-wadzony jest pomiędzy temperaturą transformacji szkła a temperaturą likwidusu. W artykule przenalizowano in-formacje dotyczące otrzymywania tworzywa szkło-cerami-ki, jak również materiałów najczęściej wykorzystywanych podczas produkcji tego materiału.
PRZEMYSŁAW CZAPIKMATEUSZ CEBULSKI
THE PROPERTIES OF CEMENT MORTAR WITH NATURAL ZEOLITE AND SILICA FUME ADDITIONS
WŁAŚCIWOŚCI ZAPRAWY CEMENTOWEJ Z DODATKIEM ZEOLITU NATURALNEGO I PYŁU KRZEMIONKOWEGO
Structure and Environment No. 2/2018, vol. 10, p. 105 DOI: 10.30540/sae-2018-010

190
A b s t r a c tThe paper examines the problem of snow-drafts on roads and ways of mitigating them. The results of theoretical analyses of development of snow-drafts and experimental investigations with road models are presented. Authors examined low and high blowing snows with different wind velocities, roads with road bed at terrain elevation and situated on an embankment, with and without snow protective facilities and with variable amount of traffic. Based on the conducted analyses a set of recommendations for snow protection of roads are provided.
S t r e s z c z e n i eW artykule dokonano analizy problemu występowania za-śnieżania dróg oraz opisano sposoby ich ochrony przed tym zjawiskiem. Przedstawiono także wyniki analizy teoretycz-nej przyczyn zaśnieżania dróg oraz wyniki badań ekspery-mentalnych z wykorzystaniem modeli dróg. Badano wpływ małych i dużych opadów śniegu występujących przy różnej prędkości wiatru na drogę usytuowaną w poziomie tere-nu (zero niwelety) i na nasypie, z uwzględnieniem wpływu obecności zasłon przeciwśnieżnych oraz niewielkiego ruchu pojazdów Na podstawie wykonanych analiz sformułowano zalecenia dotyczące ochrony drogi przed opadami śniegu.
MICHAIL VASILEVICH NEMCHINOV ANNA GENNADIEVNA IVANOVA
SNOWDRIFT EXTENT ON MOTORWAYS WITH BUSY TRAFFICZASIĘG POKRYWY ŚNIEŻNEJ NA AUTOSTRADACH O DUŻYM NATĘŻENIU RUCHU
Structure and Environment No. 2/2018, vol. 10, p. 122 DOI: 10.30540/sae-2018-012
ANNA BAZAN-KRZYWOSZAŃSKA
GIS TECHNOLOGY AS A TOOL FOR PROTECTING LANDSCAPE AND CULTURAL VALUES IN SPATIAL PLANNING
TECHNOLOGIA GIS NARZĘDZIEM OCHRONY KRAJOBRAZU I WARTOŚCI KULTUROWYCH W PLANOWANIU PRZESTRZENNYM
Structure and Environment No. 2/2018, vol. 10, p. 129 DOI: 10.30540/sae-2018-013
A b s t r a c tThe issue of a landscape protection is quite a significant element of municipal spatial policy. Currently, there is no legal obligation to implement, within the statutory activities of institutions responsible for the landscape protection, guidance documents prior to work on the development of the municipality. Space management, through planning a development and land use or the landscape protection, requires access to comprehensive and reliable information. The use of GIS technology in spatial analysis and monitoring changes in space, for the landscape and cultural values protection, provides opportunities to assist decisions on the destination and land use in spatial planning carried out using planning documents (A study of the conditions and directions of the spatial planning and the local zoning plan).
S t r e s z c z e n i eW odniesieniu do polityki przestrzennej gmin, problema-tyka ochrony krajobrazu stanowi element dość znaczący. Aktualnie brak jest prawnego obowiązku realizacji, w ra-mach działań statutowych instytucji odpowiedzialnych za ochronę krajobrazu, dokumentów o charakterze wytycz-nych wyprzedzających prace nad kierunkami rozwoju gmi-ny. Zarządzanie przestrzenią, przez planowanie rozwoju oraz sposobu zagospodarowania terenu lub ochrony kra-jobrazu wymaga dostępu do wszechstronnej i wiarygodnej informacji. Wykorzystanie technologii GIS w ramach ana-liz przestrzennych oraz monitoringu zmian zagospodaro-wania przestrzeni na potrzeby ochrony krajobrazu i war-tości kulturowych daje możliwości wspomagające decyzje dotyczące przeznaczenia i sposobu zagospodarowania przestrzeni w planowaniu przestrzennym, realizowanym za pomocą dokumentów planistycznych gmin (studium uwa-runkowań i kierunków zagospodarowania przestrzennego gminy i miejscowego planu zagospodarowania).
191
A b s t r a c tModernist architecture has grown out of the possibility of using new construction materials as well as a widespread criticism of historical architectural styles. The development of contemporary architecture in Kielce is consonant with the development trends in architecture throughout Poland and in Europe. In order to characterise the facets of contemporary architecture in Kielce, the author of the paper has focused on the selection of the most distinctive and valuable buildings. The image of Kielce’s contemporary architecture presented here evinces its diversity and great value. The city’s fabric holds noteworthy objects of modernist and postmodernist architecture.
S t r e s z c z e n i eArchitektura modernistyczna wyrosła na gruncie możliwości stosowania nowych materiałów konstrukcyjnych i powszech-nej krytyce stylów historycznych. Rozwój współczesnej ar-chitektury w Kielcach odpowiada tendencjom rozwojowym w architekturze w Polsce i w Europie. Aby scharakteryzo-wać oblicza architektury współczesnej w Kielcach, autor skupił się na wybranych przykładach obiektów najbardziej charakterystycznych i wartościowych. Zaprezentowa-ny obraz architektury współczesnej Kielc świadczy o jej zróżnicowaniu i dużych walorach. W tkance miasta znaj-dują się znaczące obiekty architektury modernistycznej i postmodernistycznej.
LUCJAN W. KAMIONKA
THE IMAGE OF THE CONTEMPORARY ARCHITECTURE OF KIELCE – A REVIEW OF THE SELECTED BUILDINGS
OBRAZ WSPÓŁCZESNEJ ARCHITEKTURY KIELC NA PRZYKŁADZIE WYBRANYCH OBIEKTÓW
Structure and Environment No. 2/2018, vol. 10, p. 138 DOI: 10.30540/sae-2018-014
VADYM ABYZOV
ARCHITECTURE-&-BUILDING SYSTEMS IN CIVIL CONSTRUCTIONSYSTEMY ARCHITEKTONICZNE I BUDOWLANE W BUDOWNICTWIE CYWILNYM
Structure and Environment No. 2/2018, vol. 10, p. 153 DOI: 10.30540/sae-2018-015
A b s t r a c tThe article deals with the role of Architecture-&-Building systems in Residential and Public Construction. The concept and definition of the Architecture-&-Building systems are determined and reviewed. The structural model of Architecture-&-Building systems that have signs of integrity, the hierarchy of structure and openness is proposed. They include three main subsystems, which are in organic unity and interaction: functional-spatial (architectural and planning); constructive (tectonic); technological (production-building).
S t r e s z c z e n i eArtykuł dotyczy roli systemów architektonicznych i bu-dowlanych w budownictwie mieszkaniowym i publicz-nem. Koncepcja i definicja systemów architektonicznych i budowlanych są określone i przejrzane. Zaproponowa-no model strukturalny systemów architektonicznych i bu-dowlanych o oznakach integralności, hierarchii struktury i otwartości. Te systemy obejmują trzy główne podsystemy, które są w organicznej jedności i interakcji: funkcjonalno--przestrzenne (architektoniczne i planistyczne); konstruk-tywny (tektoniczny); technologiczny (produkcja-budynek).

192
A b s t r a c tThe paper reports statistical analysis of the data recorded by two stations monitoring traffic noise in a medium-sized city, such as Kielce. One station is located beside the national road, the other beside the provincial road. The results under analysis included the equivalent sound levels recorded in 2013. The coefficient of variation, quartile deviation and deviations from the mean were proposed for comparing the dependencies recorded.
S t r e s z c z e n i eW artykule przedstawiono analizę statystyczną wyników pomiarów zarejestrowanych przez dwie stacje monitorują-ce hałas drogowy w mieście średniej wielkości takim jak Kielce. Jedna stacja znajduje się przy drodze krajowej, a druga przy drodze wojewódzkiej. Analizowane wyniki dotyczą równoważnego poziomu dźwięku zarejestrowa-nego w roku 2013. Współczynnik zmienności odchylenia standardowego, odchylenie ćwiartkowe, współczynnik zmienności odchylenia od wartości średnich zostały zapro-ponowane do porównywania zarejestrowanych zależności.
A b s t r a c tThe paper presents a review of passive techniques used in environmental engineering and construction, aimed at reducing energy consumption for heating or cooling purposes. These are: green facades, cooling coatings, thermopaints, heater screens, shutters and other solutions. Their disadvantages, advantages and working methods were discussed. The heat gain calculations for the exemplary building whose baffles were painted with pigmented pigment with varying degrees of dilution resulted in a facade of varying color intensity. It has been found that by applying bright colors, nearly 30 percent of energy consumption for cooling purposes for heat gains through opaque seams compared to dark colors has been reduced.
S t r e s z c z e n i eW pracy przedstawiono przegląd technik pasywnych sto-sowanych w inżynierii środowiska i budownictwie, któ-rych zadaniem jest ograniczenie zużycia energii na cele grzewcze lub chłodnicze. Są to: zielone fasady, powłoki chłodzące, termofarby, ekrany zagrzejnikowe, żaluzje oraz inne rozwiązania. Przedyskutowano ich wady, zalety oraz sposób pracy. Przedstawiono również obliczenia zysków ciepła dla przykładowego budynku, którego przegrody zo-stały pomalowane farbą zabarwioną pigmentem o różnym stopniu rozcieńczenia, czego wynikiem jest fasada o różnej intensywności koloru. Stwierdzono, że przez zastosowanie jasnego koloru doszło do obniżenia o blisko 30 procent zu-życia energii na cele chłodnicze dla zysków ciepła przez przegrody nieprzezroczyste w porównaniu z ciemną barwą.
PAWEŁ LESIAK
PASSIVE ENERGY REDUCTION TECHNOLOGIES IN ENVIRONMENTAL ENGINEERINGTECHNOLOGIE PASYWNEGO OGRANICZANIA ZUŻYCIA ENERGII W INŻYNIERII ŚRODOWISKA
Structure and Environment No. 2/2018, vol. 10, p. 161 DOI: 10.30540/sae-2018-016
ANDRZEJ BĄKOWSKILESZEK RADZISZEWSKIPAWEŁ ŚWIETLIKVLADIMIR DEKÝŠ
COMPARATIVE ANALYSIS OF MEASUREMENT DATA RECORDED BY TWO TRAFFIC MONITORING STATIONS
ANALIZA PORÓWNAWCZA WYNIKÓW POMIARÓW ZAREJESTROWANYCH PRZEZ DWIE STACJE MONITORUJĄCE RUCH POJAZDÓW DROGOWYCH
Structure and Environment No. 2/2018, vol. 10, p. 170 DOI: 10.30540/sae-2018-017

193
MILAN MALCHORICHARD LENHARDMARTIN VANTÚCHKATARÍNA KADUCHOVÁTOMÁŠ PUCHOR
WORKING PARAMETERS OF GAS HEAT PUMP IN USE WITH LOW-POTENTIAL GEOTHERMAL ENERGYPARAMETRY PRACY GAZOWEJ POMPY CIEPŁA
WYKORZYSTUJĄCEJ GEOTERMALNĄ NISKIEJ ENTALPII
Structure and Environment No. 2/2018, vol. 10, p. 180 DOI: 10.30540/sae-2018-018
A b s t r a c tThe article presents the operating parameters of the heat pump for gas with low potential geothermal energy. It describes the measurement device and implementations of the experimental measurements resulted in a database of relevant data on the conversion of primary energy to natural gas to GHP heat, using low potential energy from a deep well.
S t r e s z c z e n i eW artykule przedstawiono parametry pracy gazowej pompy ciepła, korzystającej z energii geotermalnej niskiej entalpii. Zaprezentowano wykorzystywane stanowisko pomiarowe, a także zastosowanie wyników pomiarów do budowy bazy danych eksperymentalnych na temat konwersji energii pier-wotnej gazu ziemnego w ciepło, przy użyciu pompy ciepła współpracującej z pionowym wymiennikiem gruntowym.
MARTIN VANTÚCHANDREJ KAPJORMICHAL HOLUBčÍK
ALTERNATIVE METHODS OF OBTAINING GEOTHERMAL HEAT FROM THE EARTH
ALTERNATYWNE METODY POZYSKIWANIA CIEPŁA Z WNĘTRZA ZIEMI
Structure and Environment No. 2/2018, vol. 10, p. 184 DOI: 10.30540/sae-2018-019
A b s t r a c tThe paper describes the possibility of obtaining low-potential heat of the earth from deep borehole. It describes the possibilities of using a heat pump in combination with a heat pipe. The gravity heat pipe with the working substance represents an alternative and more efficient heat transfer technique from the vertical earth borehole. The article describes the possibilities and measurements of using this method on the primary side of the ground / water heat pump.
S t r e s z c z e n i eArtykuł przedstawia możliwości odzysku niskotempera-turowego ciepła z wnętrza ziemi przy użyciu pionowego wymiennika gruntowego. Opisuje on zastosowanie pompy ciepła współpracującej z rurą ciepła. Takie rozwiązanie w przypadku wymiennika pionowego stanowi interesującą koncepcję. Prezentowany wymiennik ciepła w takim przy-padku cechuje się większą wydajnością. Praca przedstawia możliwości i wyniki pomiarów dla pierwotnej strony układu pompy ciepła.

195
Uniform requirements for manuscripts submitted to “Structure and Environment”
All manuscripts should be submitted in English and Polish.
Given name(s) and surname(s) of each authorInstitutional affiliation(s) Author’s e-mail
TitleFormat for the paper:– Abstract– Keywords– Introduction– Subsequent headings– Summary– References
The text should be single-spaced throughout. The font should be 11 pt Times New Roman. All paragraphs should be indented 0.5 cm.
Formulas, tables, figures and photographs should be numbered consecutively
Figures and photographs with a resolution of 300 dpi or higher must be submitted in *.TIFF, *.EPS, *.JPG, *.WMF format.
Figures, photographs and tables should be in English, but their captions should be given in English and Polish.
References: The paper submitted for publication must comply with copyright law provisions. Authors have to document sources of the photographs, figures, quotes and borrowings used in the article. References should be cited in square brackets through the text. The full list of references arranged in the citing order as they appear in the text should be placed at the end of the paper (with one language version only). The reference style is defined by the standard PN-ISO 690:2012 Information and documentation. Guidelines for bibliographic references and citations to information resources.Examples Whole books [1] Author’s surname followed by the initials: Title of the book. Place of publication: Publisher, Year of
publication, ISBN number. Edited books[2] Surname and initials of the editor (Ed.): Title of the book. Place of publication: Publisher, Year of
publication, ISBN number. Chapters in edited books [3] Author’s surname followed by the initials: Title of the charter. (in): Title of the book. Place of publication:
Publisher, Year of publication, page numbers (for example: pp. 10-20), ISBN number.Journal articles [4] Author’s surname followed by the initials: Title of the article. “journal title” Year, Number, page numbers
(for example: pp. 10-20), ISSN numberWeb references [5] Author’s surname followed by the initials: Title of the work. [type of the source, for example: online].
[date when the reference was last Accessed: …]. Available online: web page

196
THE REVIEW PROCESSThe following requirements need to be met by the paper:– the title should reflect the content of the paper– the content should be within the thematic scope of the journal– the paper should be properly and clearly divided into paragraphs – original elements need to be part of the paper – the research method should be properly selected – adequate references need to be cited– interpretation and conclusions should match the presented test results– the paper should not contain parts indicating commercial use
Podstawowe wymagania edytorskie dotyczące pisania artykułów do czasopisma „Structure and Environment”
Artykuł powinien być napisany w dwóch wersjach językowych: angielskiej oraz polskiej.
Imię i nazwisko autoraNazwa uczelnie-mail autora
Tytuł artykułuStruktura artykułu:– Streszczenie– Słowa kluczowe– Wprowadzenie– Kolejne podtytuły– Podsumowanie– Bibliografia
Tekst artykułu powinien być napisany czcionką Times New Roman 11, interlinia pojedyncza, wcięcie akapitowe 0,5 cm.Wzory, tabele, rysunki oraz zdjęcia powinny być ponumerowane zgodnie z kolejnością ich występowania w tekście.Rysunki oraz zdjęcia o rozdzielczości 300 dpi lub wyższej, format *.TIFF, *.EPS, *.JPG, *.WMF.Rysunki, zdjęcia oraz tabele zamieszczamy w wersji angielskiej, a ich tytuły podajemy zarówno w języku angielskim,
jak i języku polskim.Bibliografia: Artykuł przeznaczony do publikacji musi być przygotowany zgodnie z postanowieniami ustawy „Prawo
autorskie”, które nakłada na autora obowiązek wykazania źródeł wykorzystanych zdjęć, rysunków cytowań, zapożyczeń. Źródła takie należy umieszczać w tekście w nawiasach kwadratowych. Zbiorcze zestawienie bibliografii umieszczamy na końcu artykułu w kolejności cytowania (tylko przy jednej wersji językowej).
Styl bibliograficzny definiuje norma: PN-ISO 690:2012 Informacja i dokumentacja. Wytyczne opracowania przypisów bibliograficznych i powołań na zasoby informacji.PrzykładyPozycje książkowe [1] Nazwisko i inicjały imion autora: Tytuł: podtytuł. Miejsce wydania: Wydawca, Rok, Numer ISBN. Praca zbiorowa[2] Nazwisko i inicjały imion redaktora (red): Tytuł: podtytuł. Miejsce wydania: Wydawca, Rok, Numer ISBN.Rozdziały książek [3] Nazwisko i inicjały imion autora: Tytuł: podtytuł rozdziału. [w]: Tytuł publikacji. Miejsce wydania: Wydawca, Rok,
Strony (np. s. 10-20), Numer ISBN.Artykuły w czasopismach [4] Nazwisko i inicjały imion autora: Tytuł artykułu. „Tytuł czasopisma” Rok, Numer, Strony (np. s. 8-27), Numer ISSN. Strony internetowe [5] Nazwisko i inicjały imion autora: Tytuł. [typ nośnika (np. online)]. [data dostępu: ...]. Dostępny w internecie: Adres
strony internetowej

STR
UC
TUR
E A
ND
EN
VIR
ON
MEN
T
No.
2/2
018
vol
. 10
STRUCTURE ANDENVIRONMENTSTRUCTURE ANDENVIRONMENTNo. 2/2018 vol. 10 PL ISSN 2081-1500 www.sae.tu.kielce.pl KIELCE UNIVERSITY OF TECHNOLOGY
ARCHITECTURE, CIVIL ENGINEERING, ENVIRONMENTAL ENGINEERING, ENERGY AND GEOMATIC

![FOR THE VIRTUAL BATTLESPACE SYSTEM HYDROGEN – A ... · Lazarus development environment [6]. The compiler and the Lazarus development ... HYDROGEN – a development environment for](https://static.fdocuments.pl/doc/165x107/5be43a4209d3f233038ceef1/for-the-virtual-battlespace-system-hydrogen-a-lazarus-development-environment.jpg)

![[Revit Structure 2009] Podręcznik Użytkowania](https://static.fdocuments.pl/doc/165x107/5695d5251a28ab9b02a43b30/revit-structure-2009-podrecznik-uzytkowania.jpg)