SSI report
8
Visit SSI Research on Bloomberg at SSIV <GO> No part of this material may be (i) copied, photocopied or duplicated in any form by any mean or (ii) redistributed without the prior written consent of Saigon Securities Incorporation. 1 VN Index Intra Day HNX Index Intra Day MARKET SUMMARY (click here) VIETNAM MACRO SUMMARY (click here) MARKET WRAP On HOSE - Top 5 big caps diverged as GAS dropped 1.8%; BVH and VIC stayed flat; while MSN and VNM gained 1.09% and 2.46% respectively. Real estate tickers also diverged as HDC, KDH, PDR, SII slumped; BCI, DXG, LCG, NVN, QCG, SC5, VRC moved sideways; while CII, DIG, DRH, HAG, HAR, HDG, HQC, IJC, ITA, ITC, KBC, LGL, MCG, NLG, NTL, NVT, PTL, PXL, SJS, TDC, TDH, UDC, VNI, VPH advance or even hit ceiling in the end. Divergence was also seen among the banking stocks as BID increased 0.66%; MBB remained unchanged; while CTG, EIB, STB and VCB all decreased at the end. Securities brokerage (AGR, BSI, HCM, SSI) altogether moved up at market close. - FLC topped of the liquidity list with over 11.32 mil shares changing hands. The ticker closed the day at VND 11,900, up 4.38%. - Put-through value amounted to approx. VND 141.89 bil VND. VNM was the most crossed ticker (870,000 shares) with net crossing value of approx. 113.1 VND bil. - Foreign investors continued to register as a net buyer on HOSE with net value of approx. 11.2 bil VND. They mostly registered net buys of CSM with net value of approx. VND 9.18 bil while net sells of VSH with net value of approx. VND 26.89 bil. On HNX - With only ACB stayed flat; other top leading market indicators such as ACB, SHB, BVS, KLS, VND, PVX, SCR and VCG accelerated under strong buying pressure. - PVX topped the liquidity list with over 4.71 mil shares being exchanged. The ticker closed the day at VND 4,400, up 2.32%. - Foreign investors maintained their net buy status on HNX with value of approx. 36.34 bil VND. PVS was the most accumulated ticker with net value of approx. 23.52 bil VND while PVC was the most unloaded name with net value of approx. 4.56 bil VND. Banking sector update The following are the latest updates on the banking sector: - Credit growth as of June 2014 is 2.3%: This figure is lower than 4.72% YTD credit growth as of 30 June 2013. Sluggish domestic demand is at the heart of impaired credit growth. Enterprises remain reluctant to borrow from banks as weak domestic consumption still lingers. The irony is that banks are only offering loans to financially sound companies that are not in need of extra capital. At the same time, most companies are in need of capital injection but do not have access. We believe that the target credit growth of 12% - 14% is still attainable due t o seasonable effect of lending activities (2H is the high season for lending activities) and banks are equipped with methods and techniques to achieve target credit growth by year end. However, if lending is only heightened at year end, and this is obviously the predominant source of income for banks – interest income accounts for 80% of total operating profit for banks in Vietnam, earnings will be negatively affected in 2014. Credit growth NPL ratio Source: the State Bank of Vietnam (SBV) Source: the SBV - NPL ratio as of April 2014 is 4.03%: Since the beginning of 2014, NPL ratio of Vietnam’s banking sector has gradually increased. The increase in NPL ratio indicates that economic difficulties continue to be an issue which has exacerbated bad debts. Another reason could also be traced to Vietnam Asset Management Company (VAMC) bad debt purchasing program which evidently has appeared to lost some of its initial vigor. - In 6M14, Vietnam Asset Management Company (VAMC) has purchased bad debts worth VND 11,414 billion, increasing total bad debts purchased to VND 50,751 billion. VAMC began purchasing bad debts on 11 Oct 2013. In 2013, total purchased bad debts reached VND 39,337 billion, which indicates that VMAC has appeased its purchasing program. We have yet to see any signals related to selling bad debts to foreign investors which we think is critical factor in resolving bad debts. Positive signals we are closely watching are interests from foreign investors and revisions of Vietnam’s regulations on purchasing bad debt s of foreign investors. ECONOMIC WRAP M A R K E T M O V E M E N T S SSI DAILY CALL July 03 2014 H N X - I N D E X 78.90 0.82 (1.05%) Value: VND 744.3 bn Foreigner (net): VND 36.3 bn Market wrap: The Vietnamese Stock Market advanced yesterday as energetic demand forces commanded the market from the opening towards the end. Liquidity surged perpetuated by robust money inflow. Macro wrap: Update on Banking Sector data Equity wrap: Update on BMP SUMMARY VN Index YTD HNX Index YTD Source: Stockbiz .vn V N - I NDEX 578.80 0.73 (0.13%) Value: VND 1,659.9 bn Foreigners (net):VND 11.2 bn
-
Upload
cuong-tien -
Category
Documents
-
view
230 -
download
0
Transcript of SSI report
7/23/2019 SSI report
http://slidepdf.com/reader/full/ssi-report 1/7
Visit SSI Research on Bloomberg at SSIV <GO>
No part of this material may be (i) copied, photocopied or duplicated in any form by any mean or (ii)
redistributed without the prior written consent of Saigon Securities Incorporation.
1
VN Index Intra Day
HNX Index Intra Day
MARKET SUMMARY (click here)
VIETNAM MACRO SUMMARY (click here)
ARKET WRAP
On HOSE
Top 5 big caps diverged as GAS dropped 1.8%; BVH and VIC stayed flat; while MSN and VNM gained.09% and 2.46% respectively. Real estate tickers also diverged as HDC, KDH, PDR, SII slumped; BCI,XG, LCG, NVN, QCG, SC5, VRC moved sideways; while CII, DIG, DRH, HAG, HAR, HDG, HQC, IJC, ITA,
TC, KBC, LGL, MCG, NLG, NTL, NVT, PTL, PXL, SJS, TDC, TDH, UDC, VNI, VPH advance or even hiteiling in the end. Divergence was also seen among the banking stocks as BID increased 0.66%; MBBemained unchanged; while CTG, EIB, STB and VCB all decreased at the end. Securities brokerage (AGR,SI, HCM, SSI) altogether moved up at market close.
FLC topped of the liquidity list with over 11.32 mil shares changing hands. The ticker closed the day atND 11,900, up 4.38%.
Put-through value amounted to approx. VND 141.89 bil VND. VNM was the most crossed ticker870,000 shares) with net crossing value of approx. 113.1 VND bil.
Foreign investors continued to register as a net buyer on HOSE with net value of approx. 11.2 bil VND.hey mostly registered net buys of CSM with net value of approx. VND 9.18 bil while net sells of VSH withet value of approx. VND 26.89 bil.
On HNX
With only ACB stayed flat; other top leading market indicators such as ACB, SHB, BVS, KLS, VND,VX, SCR and VCG accelerated under strong buying pressure.
PVX topped the liquidity list with over 4.71 mil shares being exchanged. The ticker closed the day atND 4,400, up 2.32%.
Foreign investors maintained their net buy status on HNX with value of approx. 36.34 bil VND. PVS washe most accumulated ticker with net value of approx. 23.52 bil VND while PVC was the most unloaded nameith net value of approx. 4.56 bil VND.
anking sector update
he following are the latest updates on the banking sector:
Credit growth as of June 2014 is 2.3%: This figure is lower than 4.72% YTD credit growth as of 30une 2013. Sluggish domestic demand is at the heart of impaired credit growth. Enterprises remain reluctanto borrow from banks as weak domestic consumption still lingers. The irony is that banks are only offeringoans to financially sound companies that are not in need of extra capital. At the same time, most companiesre in need of capital injection but do not have access. We believe that the target credit growth of 12% - 14% still attainable due to seasonable effect of lending activities (2H is the high season for lending activities) andanks are equipped with methods and techniques to achieve target credit growth by year end. However, if
ending is only heightened at year end, and this is obviously the predominant source of income for banks – terest income accounts for 80% of total operating profit for banks in Vietnam, earnings will be negativelyffected in 2014.
redit growth NPL ratio
Source: the State Bank of Vietnam (SBV) Source: the SBV
NPL ratio as of April 2014 is 4.03%: Since the beginning of 2014, NPL ratio of Vietnam’s bankingector has gradually increased. The increase in NPL ratio indicates that economic difficulties continue to ben issue which has exacerbated bad debts. Another reason could also be traced to Vietnam Asset
Management Company (VAMC) bad debt purchasing program which evidently has appeared to lost some ofs initial vigor.
In 6M14, Vietnam Asset Management Company (VAMC) has purchased bad debts worth VND1,414 billion, increasing total bad debts purchased to VND 50,751 billion. VAMC began purchasing badebts on 11 Oct 2013. In 2013, total purchased bad debts reached VND 39,337 billion, which indicates thatMAC has appeased its purchasing program. We have yet to see any signals related to selling bad debts to
oreign investors which we think is critical factor in resolving bad debts. Positive signals we are closelyatching are interests from foreign investors and revisions of Vietnam’s regulations on purchasing bad debtsf foreign investors.
CONOMIC WRAP
M A R K E T M O V E M E N T S
SSI DAILY CALLJuly 03 2014
HNX- I NDEX78.90
0.82 (1.05%) Value: VND 744.3 bnForeigner (net): VND 36.3 bn
Market wrap: The Vietnamese Stock Market advanced yesterday as energetic demand forces commanded the market from the opening towards the end.quidity surged perpetuated by robust money inflow.
Macro wrap: Update on Banking Sector data
quity wrap: Update on BMP
UMMARY
VN Index YTD
HNX Index YTD
Source: Stockbiz .vn
VN- I NDEX578.80
0.73 (0.13%) Value: VND 1,659.9 bnForeigners (net):VND 11.2 bn
7/23/2019 SSI report
http://slidepdf.com/reader/full/ssi-report 2/7
Visit SSI Research on Bloomberg at SSIV <GO>
No part of this material may be (i) copied, photocopied or duplicated in any form by any mean or (ii)
redistributed without the prior written consent of Saigon Securities Incorporation.
2
Binh Minh Plastic JSC (BMP:HOSE): Tax fine relaxed
Plastic Pipe Analyst: Kien Nguyen, [email protected]
BMP will not have to pay tax fine of VND 42 billion: As mentioned in recent reports, BMP was retroactively tax
collected and fined VND 75bn and VND 42bn, respectively. BMP already paid the retroactive tax of VND 75bn to Ho Chi
Minh City taxation department and recorded the amount as an AR on its balance sheet, but has yet to pay the tax fine. BMP
sent an appeal to HCMC’s taxation department, requesting that it does not pay the both tax payments, but its appeal was
rejected. BMP continued to appeal to the General Taxation department. The department recently approved that BMP does
not have to pay the tax interest fine (VND 42 bn), but rejected the retroactive tax claim. Although BMP continues to appeal
for the retroactive tax, we believe that BMP has to pay the amount.
Estimated 2014 net profit to be revised up: We believe recent developments are encouraging news for BMP. In our recent
updated report, we expect that BMP must pay both amounts in 2014 and it will reduce BMP’s earnings and book value
significantly. We have revised up our net profit and EPS estimates for BMP in 2014 to VND 393bn(+6% YoY) and VND
8,632 (+6% YoY), respectively.
Investment view: We have also slightly revised up our 1Y TP from VND 86,700 to VND 87,500/share, equivalent to a 25%
upside. We reiterate our BUY recommendation for BMP at PER target of 10x.
EQUITY WRAP
7/23/2019 SSI report
http://slidepdf.com/reader/full/ssi-report 3/7
Visit SSI Research on Bloomberg at SSIV <GO>
No part of this material may be (i) copied, photocopied or duplicated in any form by any mean or (ii)
redistributed without the prior written consent of Saigon Securities Incorporation.
3
Market Data
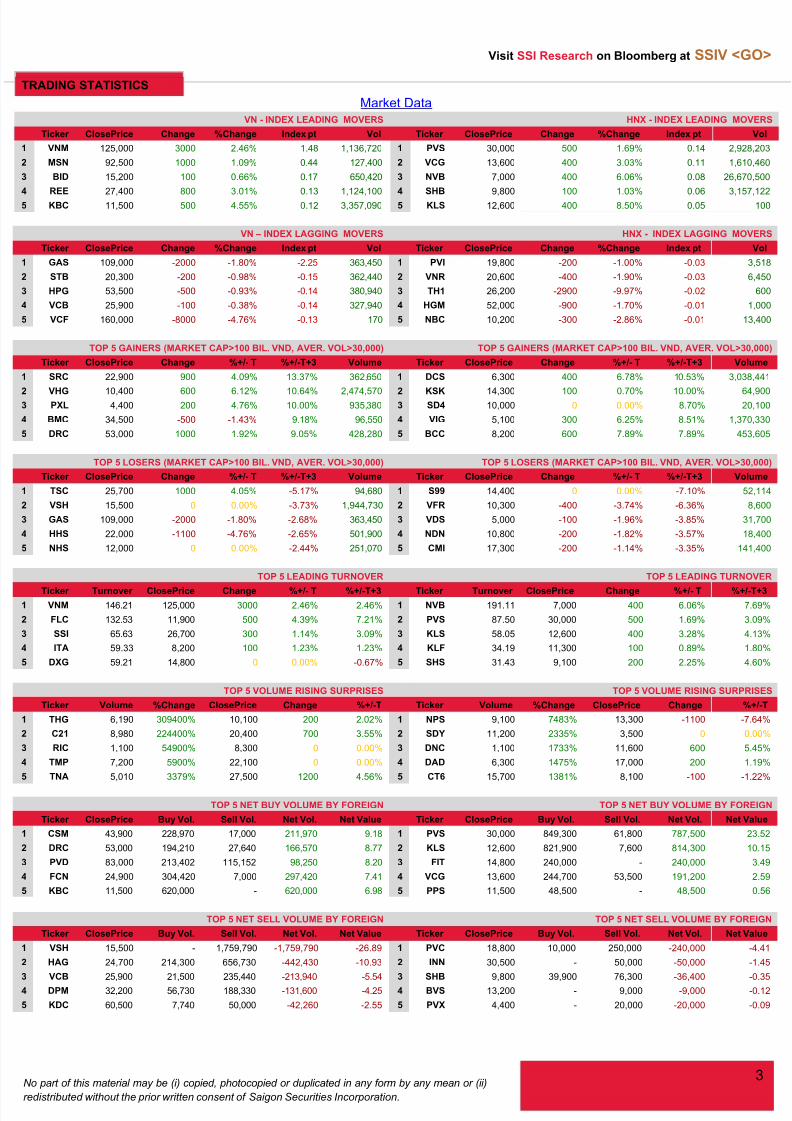
VN - INDEX LEADING MOVERS HNX - INDEX LEADING MOVERS
Ticker ClosePrice Change %Change Index pt Vol Ticker ClosePrice Change %Change Index pt Vol
VNM 125,000 3000 2.46% 1.48 1,136,720 1 PVS 30,000 500 1.69% 0.14 2,928,203
MSN 92,500 1000 1.09% 0.44 127,400 2 VCG 13,600 400 3.03% 0.11 1,610,460
BID 15,200 100 0.66% 0.17 650,420 3 NVB 7,000 400 6.06% 0.08 26,670,500
REE 27,400 800 3.01% 0.13 1,124,100 4 SHB 9,800 100 1.03% 0.06 3,157,122
KBC 11,500 500 4.55% 0.12 3,357,090 5 KLS 12,600 400 8.50% 0.05 100
VN – INDEX LAGGING MOVERS HNX - INDEX LAGGING MOVERS
Ticker ClosePrice Change %Change Index pt Vol Ticker ClosePrice Change %Change Index pt Vol
GAS 109,000 -2000 -1.80% -2.25 363,450 1 PVI 19,800 -200 -1.00% -0.03 3,518
STB 20,300 -200 -0.98% -0.15 362,440 2 VNR 20,600 -400 -1.90% -0.03 6,450
HPG 53,500 -500 -0.93% -0.14 380,940 3 TH1 26,200 -2900 -9.97% -0.02 600
VCB 25,900 -100 -0.38% -0.14 327,940 4 HGM 52,000 -900 -1.70% -0.01 1,000
VCF 160,000 -8000 -4.76% -0.13 170 5 NBC 10,200 -300 -2.86% -0.01 13,400
TOP 5 GAINERS (MARKET CAP>100 BIL. VND, AVER. VOL>30,000) TOP 5 GAINERS (MARKET CAP>100 BIL. VND, AVER. VOL>30,000)
Ticker ClosePrice Change %+/- T %+/-T+3 Volume Ticker ClosePrice Change %+/- T %+/-T+3 Volume
SRC 22,900 900 4.09% 13.37% 362,650 1 DCS 6,300 400 6.78% 10.53% 3,038,441
VHG 10,400 600 6.12% 10.64% 2,474,570 2 KSK 14,300 100 0.70% 10.00% 64,900PXL 4,400 200 4.76% 10.00% 935,380 3 SD4 10,000 0 0.00% 8.70% 20,100
BMC 34,500 -500 -1.43% 9.18% 96,550 4 VIG 5,100 300 6.25% 8.51% 1,370,330
DRC 53,000 1000 1.92% 9.05% 428,280 5 BCC 8,200 600 7.89% 7.89% 453,605
TOP 5 LOSERS (MARKET CAP>100 BIL. VND, AVER. VOL>30,000) TOP 5 LOSERS (MARKET CAP>100 BIL. VND, AVER. VOL>30,000)
Ticker ClosePrice Change %+/- T %+/-T+3 Volume Ticker ClosePrice Change %+/- T %+/-T+3 Volume
TSC 25,700 1000 4.05% -5.17% 94,680 1 S99 14,400 0 0.00% -7.10% 52,114
VSH 15,500 0 0.00% -3.73% 1,944,730 2 VFR 10,300 -400 -3.74% -6.36% 8,600
GAS 109,000 -2000 -1.80% -2.68% 363,450 3 VDS 5,000 -100 -1.96% -3.85% 31,700
HHS 22,000 -1100 -4.76% -2.65% 501,900 4 NDN 10,800 -200 -1.82% -3.57% 18,400
NHS 12,000 0 0.00% -2.44% 251,070 5 CMI 17,300 -200 -1.14% -3.35% 141,400
TOP 5 LEADING TURNOVER TOP 5 LEADING TURNOVER
Ticker Turnover ClosePrice Change %+/- T %+/-T+3 Ticker Turnover ClosePrice Change %+/- T %+/-T+3
VNM 146.21 125,000 3000 2.46% 2.46% 1 NVB 191.11 7,000 400 6.06% 7.69%
FLC 132.53 11,900 500 4.39% 7.21% 2 PVS 87.50 30,000 500 1.69% 3.09%
SSI 65.63 26,700 300 1.14% 3.09% 3 KLS 58.05 12,600 400 3.28% 4.13%
ITA 59.33 8,200 100 1.23% 1.23% 4 KLF 34.19 11,300 100 0.89% 1.80%
DXG 59.21 14,800 0 0.00% -0.67% 5 SHS 31.43 9,100 200 2.25% 4.60%
TOP 5 VOLUME RISING SURPRISES TOP 5 VOLUME RISING SURPRISES
Ticker Volume %Change ClosePrice Change %+/-T Ticker Volume %Change ClosePrice Change %+/-T
THG 6,190 309400% 10,100 200 2.02% 1 NPS 9,100 7483% 13,300 -1100 -7.64%
C21 8,980 224400% 20,400 700 3.55% 2 SDY 11,200 2335% 3,500 0 0.00%
RIC 1,100 54900% 8,300 0 0.00% 3 DNC 1,100 1733% 11,600 600 5.45%
TMP 7,200 5900% 22,100 0 0.00% 4 DAD 6,300 1475% 17,000 200 1.19%
TNA 5,010 3379% 27,500 1200 4.56% 5 CT6 15,700 1381% 8,100 -100 -1.22%
TOP 5 NET BUY VOLUME BY FOREIGN TOP 5 NET BUY VOLUME BY FOREIGN
Ticker ClosePrice Buy Vol. Sell Vol. Net Vol. Net Value Ticker ClosePrice Buy Vol. Sell Vol. Net Vol. Net Value
CSM 43,900 228,970 17,000 211,970 9.18 1 PVS 30,000 849,300 61,800 787,500 23.52
DRC 53,000 194,210 27,640 166,570 8.77 2 KLS 12,600 821,900 7,600 814,300 10.15
PVD 83,000 213,402 115,152 98,250 8.20 3 FIT 14,800 240,000 - 240,000 3.49
FCN 24,900 304,420 7,000 297,420 7.41 4 VCG 13,600 244,700 53,500 191,200 2.59
KBC 11,500 620,000 - 620,000 6.98 5 PPS 11,500 48,500 - 48,500 0.56
TOP 5 NET SELL VOLUME BY FOREIGN TOP 5 NET SELL VOLUME BY FOREIGN
Ticker ClosePrice Buy Vol. Sell Vol. Net Vol. Net Value Ticker ClosePrice Buy Vol. Sell Vol. Net Vol. Net Value
VSH 15,500 - 1,759,790 -1,759,790 -26.89 1 PVC 18,800 10,000 250,000 -240,000 -4.41
HAG 24,700 214,300 656,730 -442,430 -10.93 2 INN 30,500 - 50,000 -50,000 -1.45
VCB 25,900 21,500 235,440 -213,940 -5.54 3 SHB 9,800 39,900 76,300 -36,400 -0.35
DPM 32,200 56,730 188,330 -131,600 -4.25 4 BVS 13,200 - 9,000 -9,000 -0.12
KDC 60,500 7,740 50,000 -42,260 -2.55 5 PVX 4,400 - 20,000 -20,000 -0.09
TRADING STATISTICS
7/23/2019 SSI report
http://slidepdf.com/reader/full/ssi-report 4/7
Visit SSI Research on Bloomberg at SSIV <GO>
No part of this material may be (i) copied, photocopied or duplicated in any form by any mean or (ii)
redistributed without the prior written consent of Saigon Securities Incorporation.
4
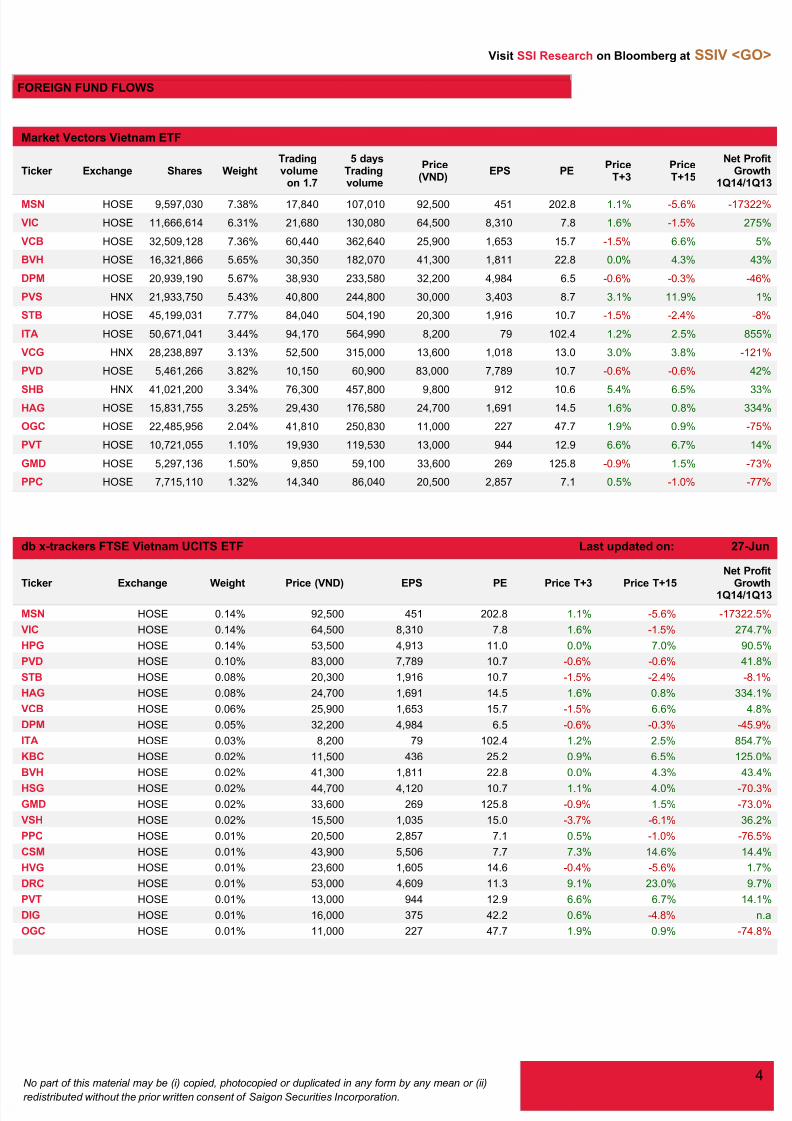
Market Vectors Vietnam ETF
Ticker Exchange Shares WeightTradingvolume
on 1.7
5 daysTradingvolume
Price(VND)
EPS PEPrice
T+3PriceT+15
Net ProfitGrowth
1Q14/1Q13
MSN HOSE 9,597,030 7.38% 17,840 107,010 92,500 451 202.8 1.1% -5.6% -17322%
VIC HOSE 11,666,614 6.31% 21,680 130,080 64,500 8,310 7.8 1.6% -1.5% 275%
VCB HOSE 32,509,128 7.36% 60,440 362,640 25,900 1,653 15.7 -1.5% 6.6% 5%
BVH HOSE 16,321,866 5.65% 30,350 182,070 41,300 1,811 22.8 0.0% 4.3% 43%
DPM HOSE 20,939,190 5.67% 38,930 233,580 32,200 4,984 6.5 -0.6% -0.3% -46%
PVS HNX 21,933,750 5.43% 40,800 244,800 30,000 3,403 8.7 3.1% 11.9% 1%
STB HOSE 45,199,031 7.77% 84,040 504,190 20,300 1,916 10.7 -1.5% -2.4% -8%
TA HOSE 50,671,041 3.44% 94,170 564,990 8,200 79 102.4 1.2% 2.5% 855%
VCG HNX 28,238,897 3.13% 52,500 315,000 13,600 1,018 13.0 3.0% 3.8% -121%
PVD HOSE 5,461,266 3.82% 10,150 60,900 83,000 7,789 10.7 -0.6% -0.6% 42%
SHB HNX 41,021,200 3.34% 76,300 457,800 9,800 912 10.6 5.4% 6.5% 33%HAG HOSE 15,831,755 3.25% 29,430 176,580 24,700 1,691 14.5 1.6% 0.8% 334%
OGC HOSE 22,485,956 2.04% 41,810 250,830 11,000 227 47.7 1.9% 0.9% -75%
PVT HOSE 10,721,055 1.10% 19,930 119,530 13,000 944 12.9 6.6% 6.7% 14%
GMD HOSE 5,297,136 1.50% 9,850 59,100 33,600 269 125.8 -0.9% 1.5% -73%
PPC HOSE 7,715,110 1.32% 14,340 86,040 20,500 2,857 7.1 0.5% -1.0% -77%
db x-trackers FTSE Vietnam UCITS ETF Last updated on: 27-Jun
Ticker Exchange Weight Price (VND) EPS PE Price T+3 Price T+15Net Profit
Growth1Q14/1Q13
MSN HOSE 0.14% 92,500 451 202.8 1.1% -5.6% -17322.5%
VIC HOSE 0.14% 64,500 8,310 7.8 1.6% -1.5% 274.7%
HPG HOSE 0.14% 53,500 4,913 11.0 0.0% 7.0% 90.5%
PVD HOSE 0.10% 83,000 7,789 10.7 -0.6% -0.6% 41.8%
STB HOSE 0.08% 20,300 1,916 10.7 -1.5% -2.4% -8.1%
HAG HOSE 0.08% 24,700 1,691 14.5 1.6% 0.8% 334.1%
VCB HOSE 0.06% 25,900 1,653 15.7 -1.5% 6.6% 4.8%
DPM HOSE 0.05% 32,200 4,984 6.5 -0.6% -0.3% -45.9%
TA HOSE 0.03% 8,200 79 102.4 1.2% 2.5% 854.7%
KBC HOSE 0.02% 11,500 436 25.2 0.9% 6.5% 125.0%
BVH HOSE 0.02% 41,300 1,811 22.8 0.0% 4.3% 43.4%
HSG HOSE 0.02% 44,700 4,120 10.7 1.1% 4.0% -70.3%
GMD HOSE 0.02% 33,600 269 125.8 -0.9% 1.5% -73.0%
VSH HOSE 0.02% 15,500 1,035 15.0 -3.7% -6.1% 36.2%
PPC HOSE 0.01% 20,500 2,857 7.1 0.5% -1.0% -76.5%
CSM HOSE 0.01% 43,900 5,506 7.7 7.3% 14.6% 14.4%
HVG HOSE 0.01% 23,600 1,605 14.6 -0.4% -5.6% 1.7%
DRC HOSE 0.01% 53,000 4,609 11.3 9.1% 23.0% 9.7%
PVT HOSE 0.01% 13,000 944 12.9 6.6% 6.7% 14.1%
DIG HOSE 0.01% 16,000 375 42.2 0.6% -4.8% n.a
OGC HOSE 0.01% 11,000 227 47.7 1.9% 0.9% -74.8%
OREIGN FUND FLOWS
7/23/2019 SSI report
http://slidepdf.com/reader/full/ssi-report 5/7
Visit SSI Research on Bloomberg at SSIV <GO>
No part of this material may be (i) copied, photocopied or duplicated in any form by any mean or (ii)
redistributed without the prior written consent of Saigon Securities Incorporation.
5
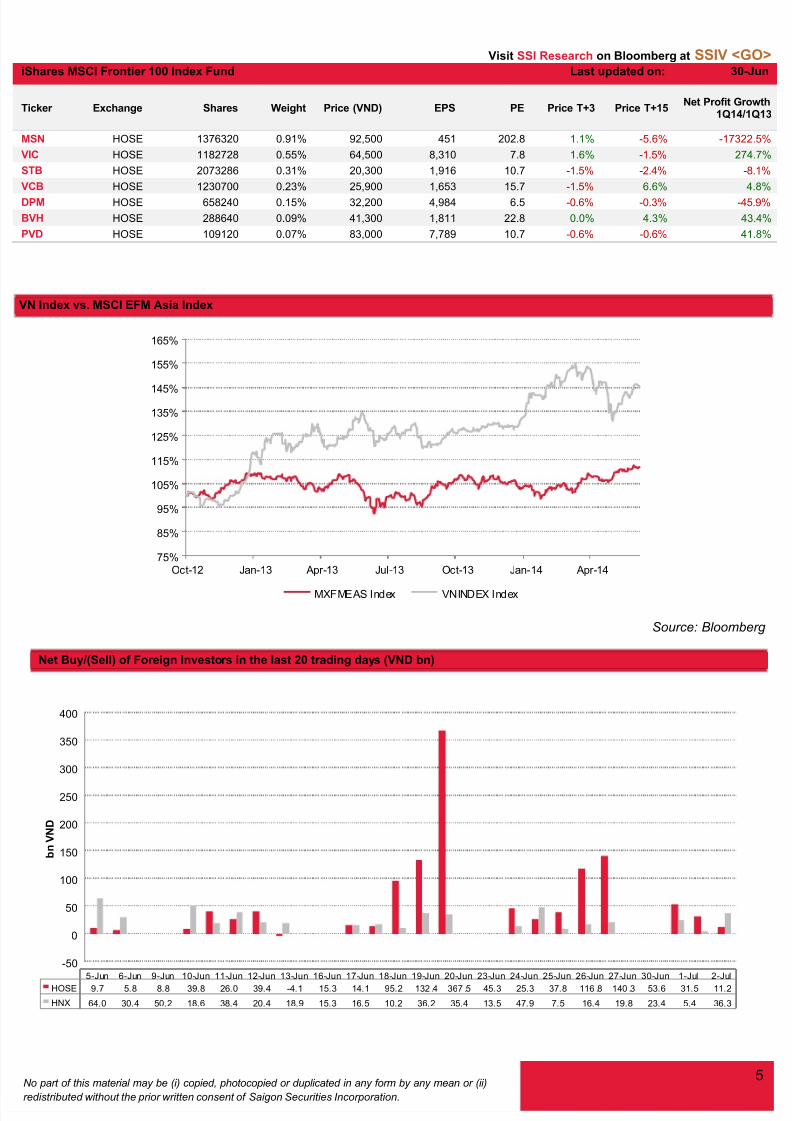
Shares MSCI Frontier 100 Index Fund Last updated on: 30-Jun
Ticker Exchange Shares Weight Price (VND) EPS PE Price T+3 Price T+15Net Profit Growth
1Q14/1Q13
MSN HOSE 1376320 0.91% 92,500 451 202.8 1.1% -5.6% -17322.5%
VIC HOSE 1182728 0.55% 64,500 8,310 7.8 1.6% -1.5% 274.7%
STB HOSE 2073286 0.31% 20,300 1,916 10.7 -1.5% -2.4% -8.1%
VCB HOSE 1230700 0.23% 25,900 1,653 15.7 -1.5% 6.6% 4.8%
DPM HOSE 658240 0.15% 32,200 4,984 6.5 -0.6% -0.3% -45.9%
BVH HOSE 288640 0.09% 41,300 1,811 22.8 0.0% 4.3% 43.4%
PVD HOSE 109120 0.07% 83,000 7,789 10.7 -0.6% -0.6% 41.8%
Source: Bloomberg
75%
85%
95%
105%
115%
125%
135%
145%
155%
165%
Oct-12 Jan-13 Apr-13 Jul-13 Oct-13 Jan-14 Apr-14
MXFMEAS Index VNINDEX Index
-50
0
50
100
150
200
250
300
350
400
b n V N D
5-Jun 6-Jun 9-Jun 10-Jun 11-Jun 12-Jun 13-Jun 16-Jun 17-Jun 18-Jun 19-Jun 20-Jun 23-Jun 24-Jun 25-Jun 26-Jun 27-Jun 30-Jun 1-Jul 2-Jul
HOSE 9.7 5.8 8.8 39.8 26.0 39.4 -4.1 15.3 14.1 95.2 132 .4 367 .5 45.3 25.3 37.8 116 .8 140 .3 53.6 31.5 11.2
HNX 64.0 30.4 50.2 18.6 38.4 20.4 18.9 15.3 16.5 10.2 36.2 35.4 13.5 47.9 7.5 16.4 19.8 23.4 5.4 36.3
Net Buy/(Sell) of Foreign Investors in the last 20 trading days (VND bn)
N Index vs. MSCI EFM Asia Index
7/23/2019 SSI report
http://slidepdf.com/reader/full/ssi-report 6/7
Visit SSI Research on Bloomberg at SSIV <GO>
No part of this material may be (i) copied, photocopied or duplicated in any form by any mean or (ii)
redistributed without the prior written consent of Saigon Securities Incorporation.
6
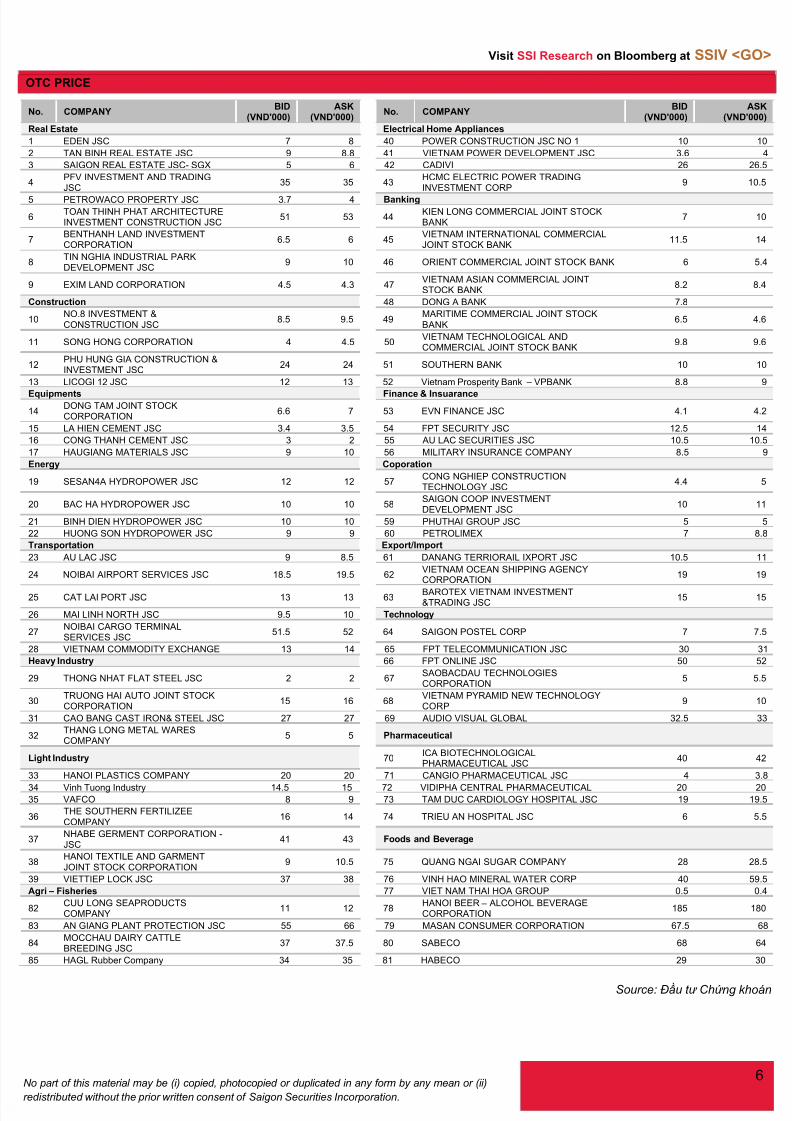
No. COMPANYBID
(VND'000)ASK
(VND'000)No. COMPANY
BID(VND'000)
ASK(VND'000)
Real Estate Electrical Home Appliances
1 EDEN JSC 7 8 40 POWER CONSTRUCTION JSC NO 1 10 10
2 TAN BINH REAL ESTATE JSC 9 8.8 41 VIETNAM POWER DEVELOPMENT JSC 3.6 4
3 SAIGON REAL ESTATE JSC- SGX 5 6 42 CADIVI 26 26.5
4PFV INVESTMENT AND TRADINGJSC
35 35 43HCMC ELECTRIC POWER TRADINGINVESTMENT CORP
9 10.5
5 PETROWACO PROPERTY JSC 3.7 4 Banking
6TOAN THINH PHAT ARCHITECTUREINVESTMENT CONSTRUCTION JSC
51 53 44KIEN LONG COMMERCIAL JOINT STOCKBANK
7 10
7BENTHANH LAND INVESTMENTCORPORATION
6.5 6 45VIETNAM INTERNATIONAL COMMERCIALJOINT STOCK BANK
11.5 14
8TIN NGHIA INDUSTRIAL PARKDEVELOPMENT JSC
9 10 46 ORIENT COMMERCIAL JOINT STOCK BANK 6 5.4
9 EXIM LAND CORPORATION 4.5 4.3 47VIETNAM ASIAN COMMERCIAL JOINTSTOCK BANK
8.2 8.4
Construction 48 DONG A BANK 7.8
10NO.8 INVESTMENT &CONSTRUCTION JSC
8.5 9.5 49MARITIME COMMERCIAL JOINT STOCKBANK
6.5 4.6
11 SONG HONG CORPORATION 4 4.5 50VIETNAM TECHNOLOGICAL ANDCOMMERCIAL JOINT STOCK BANK
9.8 9.6
12PHU HUNG GIA CONSTRUCTION &INVESTMENT JSC
24 24 51 SOUTHERN BANK 10 10
13 LICOGI 12 JSC 12 13 52 Vietnam Prosperity Bank – VPBANK 8.8 9
Equipments Finance & Insuarance
14DONG TAM JOINT STOCKCORPORATION
6.6 7 53 EVN FINANCE JSC 4.1 4.2
15 LA HIEN CEMENT JSC 3.4 3.5 54 FPT SECURITY JSC 12.5 14
16 CONG THANH CEMENT JSC 3 2 55 AU LAC SECURITIES JSC 10.5 10.5
17 HAUGIANG MATERIALS JSC 9 10 56 MILITARY INSURANCE COMPANY 8.5 9
Energy Coporation
19 SESAN4A HYDROPOWER JSC 12 12 57CONG NGHIEP CONSTRUCTIONTECHNOLOGY JSC
4.4 5
20 BAC HA HYDROPOWER JSC 10 10 58SAIGON COOP INVESTMENTDEVELOPMENT JSC
10 11
21 BINH DIEN HYDROPOWER JSC 10 10 59 PHUTHAI GROUP JSC 5 5
22 HUONG SON HYDROPOWER JSC 9 9 60 PETROLIMEX 7 8.8
Transportation Export/Import
23 AU LAC JSC 9 8.5 61 DANANG TERRIORAIL IXPORT JSC 10.5 11
24 NOIBAI AIRPORT SERVICES JSC 18.5 19.5 62VIETNAM OCEAN SHIPPING AGENCYCORPORATION
19 19
25 CAT LAI PORT JSC 13 13 63BAROTEX VIETNAM INVESTMENT&TRADING JSC
15 15
26 MAI LINH NORTH JSC 9.5 10 Technology
27NOIBAI CARGO TERMINALSERVICES JSC
51.5 52 64 SAIGON POSTEL CORP 7 7.5
28 VIETNAM COMMODITY EXCHANGE 13 14 65 FPT TELECOMMUNICATION JSC 30 31
Heavy Industry 66 FPT ONLINE JSC 50 52
29 THONG NHAT FLAT STEEL JSC 2 2 67SAOBACDAU TECHNOLOGIESCORPORATION
5 5.5
30TRUONG HAI AUTO JOINT STOCKCORPORATION
15 16 68VIETNAM PYRAMID NEW TECHNOLOGYCORP
9 10
31 CAO BANG CAST IRON& STEEL JSC 27 27 69 AUDIO VISUAL GLOBAL 32.5 33
32THANG LONG METAL WARESCOMPANY
5 5 Pharmaceutical
Light Industry 70ICA BIOTECHNOLOGICALPHARMACEUTICAL JSC
40 42
33 HANOI PLASTICS COMPANY 20 20 71 CANGIO PHARMACEUTICAL JSC 4 3.8
34 Vinh Tuong Industry 14.5 15 72 VIDIPHA CENTRAL PHARMACEUTICAL 20 2035 VAFCO 8 9 73 TAM DUC CARDIOLOGY HOSPITAL JSC 19 19.5
36THE SOUTHERN FERTILIZEECOMPANY
16 14 74 TRIEU AN HOSPITAL JSC 6 5.5
37NHABE GERMENT CORPORATION -JSC
41 43 Foods and Beverage
38HANOI TEXTILE AND GARMENTJOINT STOCK CORPORATION
9 10.5 75 QUANG NGAI SUGAR COMPANY 28 28.5
39 VIETTIEP LOCK JSC 37 38 76 VINH HAO MINERAL WATER CORP 40 59.5
Agri – Fisheries 77 VIET NAM THAI HOA GROUP 0.5 0.4
82CUU LONG SEAPRODUCTSCOMPANY
11 12 78HANOI BEER – ALCOHOL BEVERAGECORPORATION
185 180
83 AN GIANG PLANT PROTECTION JSC 55 66 79 MASAN CONSUMER CORPORATION 67.5 68
84MOCCHAU DAIRY CATTLEBREEDING JSC
37 37.5 80 SABECO 68 64
85 HAGL Rubber Company 34 35 81 HABECO 29 30
Source: Đầu tư Chứ ng khoán
OTC PRICE
7/23/2019 SSI report
http://slidepdf.com/reader/full/ssi-report 7/7
Visit SSI Research on Bloomberg at SSIV <GO>
No part of this material may be (i) copied, photocopied or duplicated in any form by any mean or (ii)7
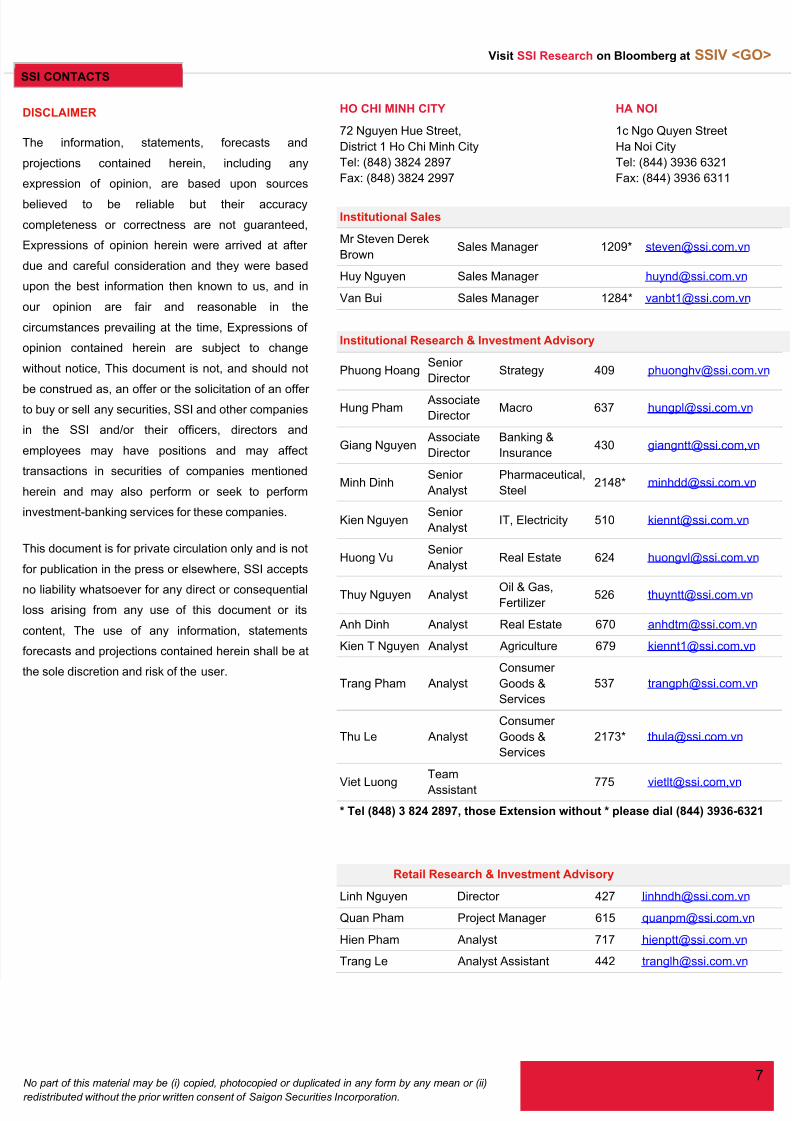
DISCLAIMER
The information, statements, forecasts and
projections contained herein, including any
expression of opinion, are based upon sources
believed to be reliable but their accuracy
completeness or correctness are not guaranteed,
Expressions of opinion herein were arrived at after
due and careful consideration and they were based
upon the best information then known to us, and in
our opinion are fair and reasonable in the
circumstances prevailing at the time, Expressions of
opinion contained herein are subject to change
without notice, This document is not, and should not
be construed as, an offer or the solicitation of an offero buy or sell any securities, SSI and other companies
n the SSI and/or their officers, directors and
employees may have positions and may affect
ransactions in securities of companies mentioned
herein and may also perform or seek to perform
nvestment-banking services for these companies.
This document is for private circulation only and is not
or publication in the press or elsewhere, SSI accepts
no liability whatsoever for any direct or consequential
oss arising from any use of this document or its
content, The use of any information, statements
orecasts and projections contained herein shall be at
he sole discretion and risk of the user.
HO CHI MINH CITY
72 Nguyen Hue Street,
District 1 Ho Chi Minh City
Tel: (848) 3824 2897
Fax: (848) 3824 2997
HA NOI
1c Ngo Quyen Street
Ha Noi City
Tel: (844) 3936 6321
Fax: (844) 3936 6311
Institutional Sales
Mr Steven Derek
BrownSales Manager 1209* [email protected]
Huy Nguyen Sales Manager [email protected]
Van Bui Sales Manager 1284* [email protected]
Institutional Research & Investment Advisory
Phuong HoangSenior
DirectorStrategy 409 [email protected]
Hung Pham Associate
DirectorMacro 637 [email protected]
Giang Nguyen Associate
Director
Banking &
Insurance430 [email protected],vn
Minh DinhSenior
Analyst
Pharmaceutical,
Steel2148* [email protected]
Kien NguyenSenior
AnalystIT, Electricity 510 [email protected]
Huong VuSenior
AnalystReal Estate 624 [email protected]
Thuy Nguyen Analyst Oil & Gas,Fertilizer
Anh Dinh Analyst Real Estate 670 [email protected]
Kien T Nguyen Analyst Agriculture 679 [email protected]
Trang Pham Analyst
Consumer
Goods &
Services
Thu Le Analyst
Consumer
Goods &
Services
2173* [email protected]
Viet Luong
Team
Assistant 775 [email protected],vn
* Tel (848) 3 824 2897, those Extension without * please dial (844) 3936-6321
Retail Research & Investment Advisory
Linh Nguyen Director 427 [email protected]
Quan Pham Project Manager 615 [email protected]
Hien Pham Analyst 717 [email protected]
Trang Le Analyst Assistant 442 [email protected]
SSI CONTACTS