
South Q1 2014 IND Report
4
Current Market Trends Rental Rates Rental rates are up, particularly in Class A Office/Warehouse & Bulk product. Class B rates are poised to increase in 2014. Overall, flex rates have been relatively flat. Leasing Activity Though activity was likely mired by adverse weather experienced throughout the first quarter, leasing fundamentals continue to improve. Tenant Concessions Tenant concessions remained relatively flat during the first quarter and are expected to diminish throughout the year as the market continues to recover. cassidyturley.com | 1 Baltimore I-95 South Industrial Market Review First Quarter 2014 Baltimore Metropolitan Overview The Greater Baltimore Metropolitan area has emerged as one of the strongest second-tier markets in the United States. While Baltimore is a stand-alone metropolitan statistical area (MSA) with over 2.7 million residents, it is also part of the Washington-Baltimore consolidated statistical area (CSA) with a total population over 8 million. The Greater Baltimore region comprises Anne Arundel, Baltimore, Carroll, Cecil, Harford, and Howard Counties as well as Baltimore City. As of March 2014, the Baltimore metropolitan area’s unemployment rate was 6.3% compared to the national unemployment rate of 6.7%. Baltimore I-95 South Industrial Market Prince George’s County contributed the majority of the 1.3 million square feet of negative absorption that raised the I-95 South industrial vacancy rate to 13.10%. Leasing velocity suffered during the winter months due to historically bad weather, but should rebound throughout the rest of 2014. Rental rates increased in the first quarter despite the slowdown in leasing velocity. Market performance in 2012 and 2013 have created a more favorable landlord environment, making asking rents immune to the temporary slowdown in tenant activity. Q1 2014 Vacancy Rates & Average Quoted Rental Rates Vacancy Rate Product Type # Of Buildings SF SF Vacant Vacancy Rate Flex 320 13,248,985 1,570,765 11.86% Office Warehouse 453 31,001,123 4,196,159 13.54% Bulk 189 31,756,320 3,684,504 11.60% I-95 South Totals 962 76,006,428 9,451,428 12.44% By Submarket # Of Buildings SF SF Vacant Vacancy Rate Corridor 550 51,231,914 5,715,127 11.16% Southeast 173 7,409,408 828,125 11.18% Southwest 239 17,364,225 2,477,642 14.27% PG County 455 30,365,306 4,484,457 14.77% I-95 South Totals 962 76,005,547 9,020,894 11.87% Average Quoted Rental Rate By Submarket Flex O/W Bulk Average Corridor $7.45 $5.65 $6.17 $6.17 Southeast $6.24 $7.92 $4.13 $5.57 Southwest $6.71 $6.04 $4.23 $5.31 PG County $8.48 $6.63 $5.42 $6.91 I-95 South Averages $7.83 $6.24 $5.46 $6.34
Transcript of South Q1 2014 IND Report
Current Market Trends
Rental Rates
Rental rates are up, particularly in Class A Office/Warehouse & Bulk product. Class B rates are poised to increase in 2014. Overall, flex rates have been relatively flat.
Leasing Activity
Though activity was likely mired by adverse weather experienced throughout the first quarter, leasing fundamentals continue to improve.
Tenant Concessions
Tenant concessions remained relatively flat during the first quarter and are expected to diminish throughout the year as the market continues to recover.
cassidyturley.com | 1
Baltimore I-95 SouthIndustrial Market Review First Quarter 2014
Baltimore Metropolitan OverviewThe Greater Baltimore Metropolitan area
has emerged as one of the strongest
second-tier markets in the United States.
While Baltimore is a stand-alone
metropolitan statistical area (MSA) with
over 2.7 million residents, it is also part
of the Washington-Baltimore
consolidated statistical area (CSA) with a
total population over 8 million. The
Greater Baltimore region comprises
Anne Arundel, Baltimore, Carroll, Cecil,
Harford, and Howard Counties as well as
Baltimore City. As of March 2014, the
Baltimore metropolitan area’s
unemployment rate was 6.3% compared
to the national unemployment rate of
6.7%.
Baltimore I-95 South Industrial MarketPrince George’s County contributed the
majority of the 1.3 million square feet of
negative absorption that raised the I-95
South industrial vacancy rate to 13.10%.
Leasing velocity suffered during the
winter months due to historically bad
weather, but should rebound throughout
the rest of 2014.
Rental rates increased in the first quarter
despite the slowdown in leasing velocity.
Market performance in 2012 and 2013
have created a more favorable landlord
environment, making asking rents
immune to the temporary slowdown in
tenant activity.
Q1 2014 Vacancy Rates & Average Quoted Rental RatesVacancy Rate
Product Type # Of Buildings SF SF Vacant Vacancy Rate
Flex 320 13,248,985 1,570,765 11.86%
Office Warehouse 453 31,001,123 4,196,159 13.54%
Bulk 189 31,756,320 3,684,504 11.60%
I-95 South Totals 962 76,006,428 9,451,428 12.44%
By Submarket # Of Buildings SF SF Vacant Vacancy Rate
Corridor 550 51,231,914 5,715,127 11.16%
Southeast 173 7,409,408 828,125 11.18%
Southwest 239 17,364,225 2,477,642 14.27%
PG County 455 30,365,306 4,484,457 14.77%
I-95 South Totals 962 76,005,547 9,020,894 11.87%
Average Quoted Rental Rate
By Submarket Flex O/W Bulk Average
Corridor $7.45 $5.65 $6.17 $6.17
Southeast $6.24 $7.92 $4.13 $5.57
Southwest $6.71 $6.04 $4.23 $5.31
PG County $8.48 $6.63 $5.42 $6.91
I-95 South Averages $7.83 $6.24 $5.46 $6.34
BALTIMORE I-95 SOUTH • INDUSTRIAL • FIRST QUARTER 2014
About Cassidy TurleyCassidy Turley is a leading commercial real estate services provider with more than 4,000 professionals in more than 60 offices nationwide. With headquarters in Washington, DC, the company represents a wide range of clients—from small businesses to Fortune 500 companies, from local non-profits to major institutions. The firm completed transactions valued at $25.8 billion in 2013, manages approximately 400 million square feet on behalf of institutional, corporate and private clients and supports more than 24,000 domestic corporate services locations. Cassidy Turley serves owners, investors and tenants with a full spectrum of integrated commercial real estate services—including capital markets, tenant representation, corporate services, project leasing, property management, project and development services, and research and consulting. Cassidy Turley enhances its global service delivery outside North America through a partnership with GVA, giving clients access to commercial real estate professionals in 65 international markets. Please visit www.cassidyturley.com for more information about Cassidy Turley. cassidyturley.com | 2
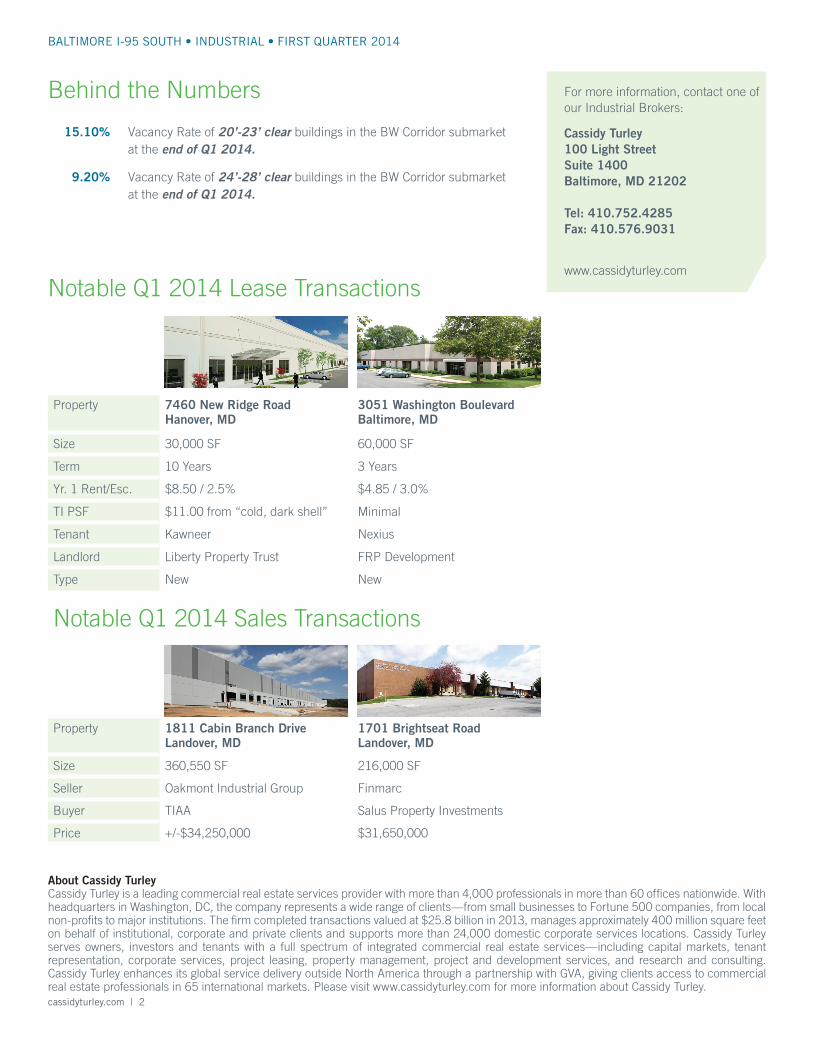
Notable Q1 2014 Lease Transactions
Property 7460 New Ridge Road Hanover, MD
3051 Washington Boulevard Baltimore, MD
Size 30,000 SF 60,000 SF
Term 10 Years 3 Years
Yr. 1 Rent/Esc. $8.50 / 2.5% $4.85 / 3.0%
TI PSF $11.00 from “cold, dark shell” Minimal
Tenant Kawneer Nexius
Landlord Liberty Property Trust FRP Development
Type New New
15.10% Vacancy Rate of 20’-23’ clear buildings in the BW Corridor submarket at the end of Q1 2014.
9.20% Vacancy Rate of 24’-28’ clear buildings in the BW Corridor submarket at the end of Q1 2014.
For more information, contact one of our Industrial Brokers:
Cassidy Turley 100 Light Street Suite 1400 Baltimore, MD 21202 Tel: 410.752.4285 Fax: 410.576.9031
www.cassidyturley.com
Notable Q1 2014 Sales Transactions
Property 1811 Cabin Branch Drive Landover, MD
1701 Brightseat Road Landover, MD
Size 360,550 SF 216,000 SF
Seller Oakmont Industrial Group Finmarc
Buyer TIAA Salus Property Investments
Price +/-$34,250,000 $31,650,000
Behind the Numbers
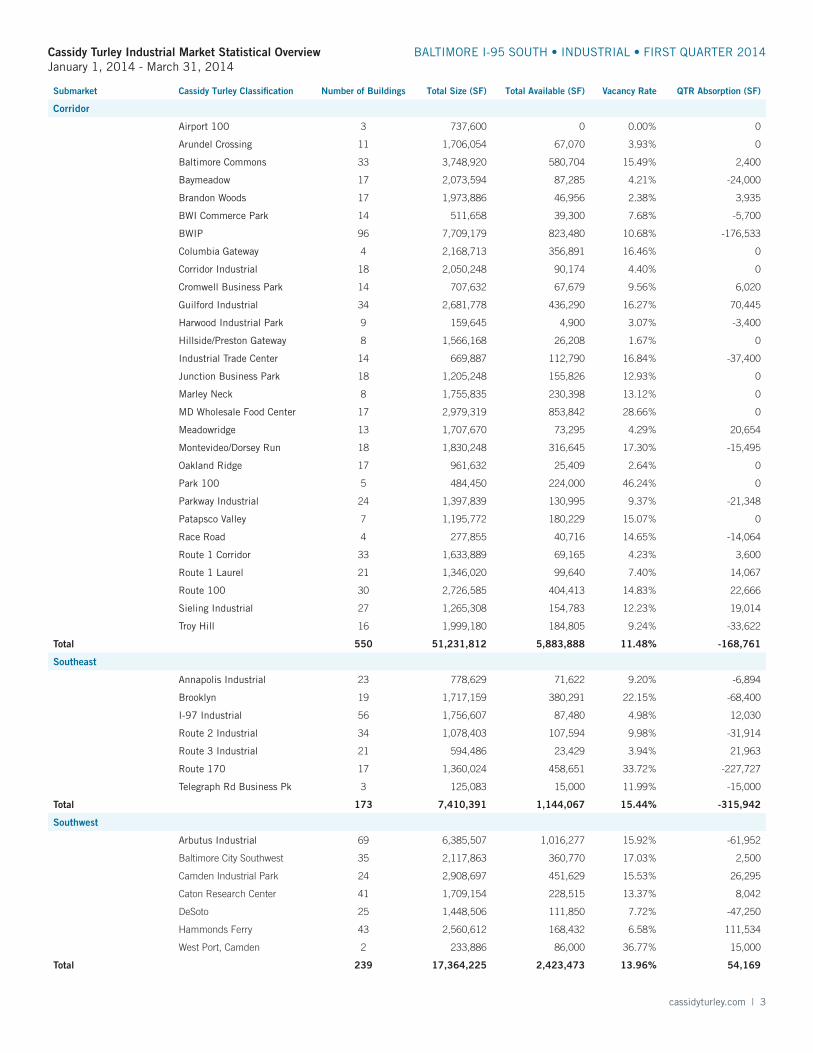
Submarket Cassidy Turley Classification Number of Buildings Total Size (SF) Total Available (SF) Vacancy Rate QTR Absorption (SF)
Corridor
Airport 100 3 737,600 0 0.00% 0
Arundel Crossing 11 1,706,054 67,070 3.93% 0
Baltimore Commons 33 3,748,920 580,704 15.49% 2,400
Baymeadow 17 2,073,594 87,285 4.21% -24,000
Brandon Woods 17 1,973,886 46,956 2.38% 3,935
BWI Commerce Park 14 511,658 39,300 7.68% -5,700
BWIP 96 7,709,179 823,480 10.68% -176,533
Columbia Gateway 4 2,168,713 356,891 16.46% 0
Corridor Industrial 18 2,050,248 90,174 4.40% 0
Cromwell Business Park 14 707,632 67,679 9.56% 6,020
Guilford Industrial 34 2,681,778 436,290 16.27% 70,445
Harwood Industrial Park 9 159,645 4,900 3.07% -3,400
Hillside/Preston Gateway 8 1,566,168 26,208 1.67% 0
Industrial Trade Center 14 669,887 112,790 16.84% -37,400
Junction Business Park 18 1,205,248 155,826 12.93% 0
Marley Neck 8 1,755,835 230,398 13.12% 0
MD Wholesale Food Center 17 2,979,319 853,842 28.66% 0
Meadowridge 13 1,707,670 73,295 4.29% 20,654
Montevideo/Dorsey Run 18 1,830,248 316,645 17.30% -15,495
Oakland Ridge 17 961,632 25,409 2.64% 0
Park 100 5 484,450 224,000 46.24% 0
Parkway Industrial 24 1,397,839 130,995 9.37% -21,348
Patapsco Valley 7 1,195,772 180,229 15.07% 0
Race Road 4 277,855 40,716 14.65% -14,064
Route 1 Corridor 33 1,633,889 69,165 4.23% 3,600
Route 1 Laurel 21 1,346,020 99,640 7.40% 14,067
Route 100 30 2,726,585 404,413 14.83% 22,666
Sieling Industrial 27 1,265,308 154,783 12.23% 19,014
Troy Hill 16 1,999,180 184,805 9.24% -33,622
Total 550 51,231,812 5,883,888 11.48% -168,761
Southeast
Annapolis Industrial 23 778,629 71,622 9.20% -6,894
Brooklyn 19 1,717,159 380,291 22.15% -68,400
I-97 Industrial 56 1,756,607 87,480 4.98% 12,030
Route 2 Industrial 34 1,078,403 107,594 9.98% -31,914
Route 3 Industrial 21 594,486 23,429 3.94% 21,963
Route 170 17 1,360,024 458,651 33.72% -227,727
Telegraph Rd Business Pk 3 125,083 15,000 11.99% -15,000
Total 173 7,410,391 1,144,067 15.44% -315,942
Southwest
Arbutus Industrial 69 6,385,507 1,016,277 15.92% -61,952
Baltimore City Southwest 35 2,117,863 360,770 17.03% 2,500
Camden Industrial Park 24 2,908,697 451,629 15.53% 26,295
Caton Research Center 41 1,709,154 228,515 13.37% 8,042
DeSoto 25 1,448,506 111,850 7.72% -47,250
Hammonds Ferry 43 2,560,612 168,432 6.58% 111,534
West Port, Camden 2 233,886 86,000 36.77% 15,000
Total 239 17,364,225 2,423,473 13.96% 54,169
Cassidy Turley Industrial Market Statistical OverviewJanuary 1, 2014 - March 31, 2014
BALTIMORE I-95 SOUTH • INDUSTRIAL • FIRST QUARTER 2014
cassidyturley.com | 3
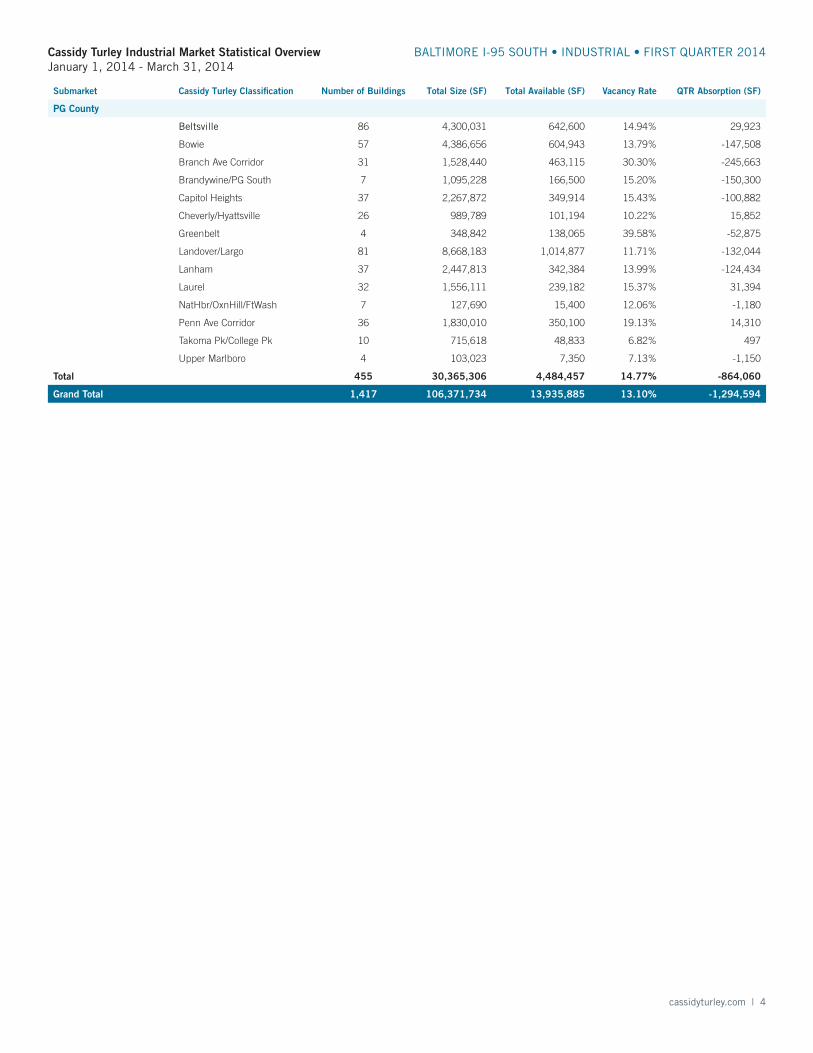
Cassidy Turley Industrial Market Statistical OverviewJanuary 1, 2014 - March 31, 2014
BALTIMORE I-95 SOUTH • INDUSTRIAL • FIRST QUARTER 2014
Submarket Cassidy Turley Classification Number of Buildings Total Size (SF) Total Available (SF) Vacancy Rate QTR Absorption (SF)
PG County
Beltsville 86 4,300,031 642,600 14.94% 29,923
Bowie 57 4,386,656 604,943 13.79% -147,508
Branch Ave Corridor 31 1,528,440 463,115 30.30% -245,663
Brandywine/PG South 7 1,095,228 166,500 15.20% -150,300
Capitol Heights 37 2,267,872 349,914 15.43% -100,882
Cheverly/Hyattsville 26 989,789 101,194 10.22% 15,852
Greenbelt 4 348,842 138,065 39.58% -52,875
Landover/Largo 81 8,668,183 1,014,877 11.71% -132,044
Lanham 37 2,447,813 342,384 13.99% -124,434
Laurel 32 1,556,111 239,182 15.37% 31,394
NatHbr/OxnHill/FtWash 7 127,690 15,400 12.06% -1,180
Penn Ave Corridor 36 1,830,010 350,100 19.13% 14,310
Takoma Pk/College Pk 10 715,618 48,833 6.82% 497
Upper Marlboro 4 103,023 7,350 7.13% -1,150
Total 455 30,365,306 4,484,457 14.77% -864,060
Grand Total 1,417 106,371,734 13,935,885 13.10% -1,294,594
cassidyturley.com | 4


![PREZENTACJA WYNIKOWA za 1 kwartał 2016 roku · 2016-08-18 · Q1 2014 Q1 2016 ROE [%] 122,1 131,5 133,0 13,4 15,7 17,7 0 5 10 15 0 50 100 150 Q1 2014 Q1 2015 Q1 2016 mln z ... WYNIKI](https://static.fdocuments.pl/doc/165x107/5f57034afb6cbe52ea12d716/prezentacja-wynikowa-za-1-kwarta-2016-roku-2016-08-18-q1-2014-q1-2016-roe-.jpg)