Rollins 2011 ar
92
2011 Rollins, Inc. Annual Report
Transcript of Rollins 2011 ar
2011 Rollins, Inc. Annual Report
ROLLIN
S 2011 AN
NU
AL REPO
RT


Rollins, Inc. is a premier North American consumer
and commercial service company consisting of its
wholly-owned subsidiaries: Orkin, Orkin Canada,
HomeTeam Pest Defense, Western Pest Services, The
Industrial Fumigant Company, Waltham Services, LLC.
Crane Pest Control and Trutech LLC. The Company
provides essential pest control services and protection
against termite damage, rodents, and insects to more
than 2 million customers in the United States, Canada,
Central America, the Caribbean, the Middle East, Asia, the
Mediterranean, Europe and Africa from over 500 locations.
You can learn more about our subsidiaries by visiting
our websites at www.orkin.com, www.orkincanada.ca,
www.pestdefense.com, www.westernpest.com,
www.indfumco.com, www.walthamservices.com,
www.cranepestcontrol.com, www.trutechinc.com
and www.rollins.com.
01 Company Overview
02 Financial Highlights
03 Shareholder Letter
05 Narrative
11 Corporate and Field Executive Leadership
12 Form 10-K
Overview
Contents
1 2011 Annual Report
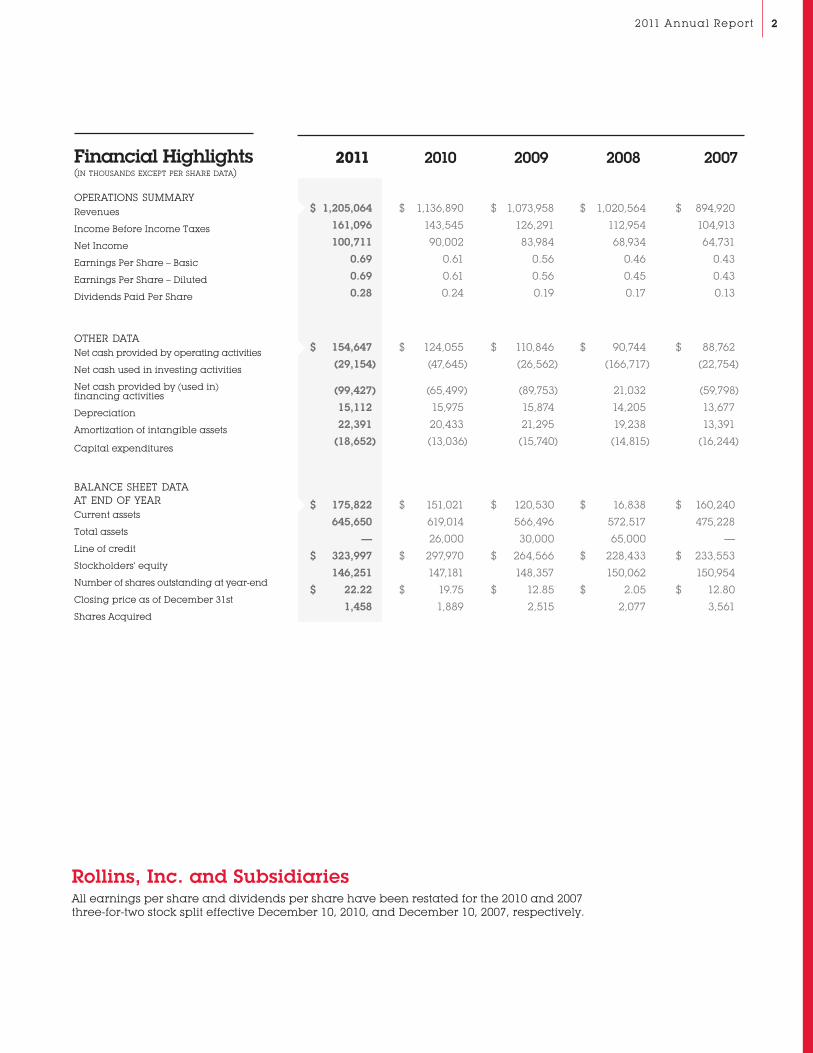
2008 2007 2006
Financial Highlights (in thousands except per share data) operations summaryRevenues
Income Before Income Taxes
Net Income
Earnings Per Share – Basic
Earnings Per Share – Diluted
Dividends Paid Per Share
other dataNet cash provided by operating activities
Net cash used in investing activities
Net cash provided by (used in) financing activities
Depreciation
Amortization of intangible assets
Capital expenditures
balance sheet data at end of yearCurrent assets
Total assets
Line of credit
Stockholders’ equity
Number of shares outstanding at year-end
Closing price as of December 31st
Shares Acquired
2011 2010 2009 2008 2007
Rollins, Inc. and SubsidiariesAll earnings per share and dividends per share have been restated for the 2010 and 2007 three-for-two stock split effective December 10, 2010, and December 10, 2007, respectively.
$ 1,205,064 $ 1,136,890 $ 1,073,958 $ 1,020,564 $ 894,920
161,096 143,545 126,291 112,954 104,913
100,711 90,002 83,984 68,934 64,731
0.69 0.61 0.56 0.46 0.43
0.69 0.61 0.56 0.45 0.43
0.28 0.24 0.19 0.17 0.13
$ 154,647 $ 124,055 $ 110,846 $ 90,744 $ 88,762
(29,154) (47,645) (26,562) (166,717) (22,754)
(99,427) (65,499) (89,753) 21,032 (59,798)
15,112 15,975 15,874 14,205 13,677
22,391 20,433 21,295 19,238 13,391
(18,652) (13,036) (15,740) (14,815) (16,244)
$ 175,822 $ 151,021 $ 120,530 $ 16,838 $ 160,240
645,650 619,014 566,496 572,517 475,228
— 26,000 30,000 65,000 —
$ 323,997 $ 297,970 $ 264,566 $ 228,433 $ 233,553
146,251 147,181 148,357 150,062 150,954
$ 22.22 $ 19.75 $ 12.85 $ 2.05 $ 12.80
1,458 1,889 2,515 2,077 3,561
22011 Annual Report
FINANCIAL SNAPSHOT
Rollins had another record year in 2011 – our
14th consecutive year of profit improvement and
improving revenue results. Revenues reached
$1.2 billion, representing 6.0% growth over 2010.
Residential pest control revenues grew 7.7%, termite
control revenues grew 2.8%, and our commercial
business posted 6.0% growth. As a result, net income
increased to $0.69 per diluted share, or a 13.1%
increase compared to last year. This is the first time
in our Company’s history that we have topped $100
million in profits.
Gross margin was up slightly at 48.8%, reflecting
higher fuel and administrative costs associated
with several strategic technology projects and the
integration of our 2010 acquisitions. However, we were
able to realize some overall efficiencies and increase
prices to offset some of these costs.
Rollins shareholders received dividends of $0.28
per share, which was a 16.7% increase over 2010.
This made 2011 the tenth consecutive year in which
dividends increased at least 12 percent. Shareholders
benefitted as well from our stock repurchase of 1.5
million shares of stock.
Total assets grew to more than $645 million and our
Company generated significant free cash flow, with
net cash from operations reaching $154.6 million,
an increase of 24.7% over 2010. Overall, Rollins’
performance demonstrates the strength of our
business and its value even in a weak economy.
We believe our persistent focus on exceeding
our customers’ expectations will continue to drive
exceptional performance despite the nation’s
ongoing economic malaise.
CONTRIBUTION FROM OUR BRANDS
During 2011, we realized significant advantages from
our 2010 acquisitions. Trutech, one of the nation’s
largest pest and wildlife removal companies,
exceeded our expectations, and Waltham Services
also performed ahead of plan.
Customers, employees and shareholders continue
to benefit as we adapt best practices from each of
our brands. For example, we adapted companywide
customer satisfaction survey programs attained
from HomeTeam to better gauge customer satisfaction
down to individual location levels. The results of
these processes also allow us to address customer
concerns early, which improves our customer
satisfaction and retention.
Building on the HomeTeam model, we are now
capitalizing on the consumer’s growing desire to
provide feedback and share experiences. This data
is quickly shared with our locations, improving our
focus to better satisfy and retain customers.
We are also constantly developing and honing
strategies to help each of our brands improve its
unique niche in the marketplace, including providing
technical and marketing support to better access new
customers online with more effective internet content.
In addition, we continue to benchmark with successful
companies outside of the pest control industry and
improve results by adapting applicable ideas and
programs. We realize that satisfying customers is a
journey, not a destination. Every customer interaction
is critical and should be better than the last.
ADDRESSING CHALLENGES AND OPPORTUNITIES
With rising vehicle purchasing and maintenance
costs, we investigated our brands’ and other successful
companies’ best practices to improve the management
of Rollins’ fleet. As a result, we began to co-source our
fleet management with Wheels, Inc., a well-known
and highly respected fleet management company.
By consolidating vehicle-related vendors, we expect
to save more than $5 million over the next six years
through improved purchasing, financing, maintenance
and management of our more than 8,000 vehicles.
We also launched several technology improvements
to increase productivity, efficiency and customer
service. We expect these investments to further help
us exceed customer expectations and result in future
cost reductions.
At Rollins, we remain focused on what we do best: providing superior pest control solutions to homes and businesses. We are continually looking for ways to innovate and improve our services. As Orkin founder Otto Orkin said, “We must never be satisfied with less than the best if we are to secure our share of tomorrow’s market.” In short, our culture dictates a commitment to continuous improvement, which is reflected in our Company’s performance.
To Our Shareholders
3 2011 Annual Report
On the opportunity side, the U.S. bed bug
market continued to grow as a result of this pest’s
proliferation and increased consumer and media
attention. We experienced good growth and market
penetration in residential as well as commercial bed
bug services. In total, our companywide bed bug
business increased 33.6% for the year.
Building on the growing bed bug awareness, we
provided a grant to the University of Kentucky to
study bed bug biology, behavior and control. Rollins’
support is the first programmatic funding for bed
bug research by any business, government agency
or institution. We believe the results of this research
can provide information for enhanced treatment and
prevention methods. We also published a bed bug
white paper last year to help businesses, consumers
and government agencies better understand the pest
control methods, detection and issues that are involved
with a bed bug infestation. These two initiatives helped
further position Rollins as the industry leader in bed
bug services and pest control in general.
Capitalizing on bed bug opportunities internally
within all Rollins brands sparked the company’s
Bed Bug Initiative, which included launching a
companywide Bed Bug Resource Center while
developing a certified training program for bed
bug treatment. This was Rollins’ first all-brand
endeavor with procedures and policies developed
by this multi-brand, multi-functional team.
In other firsts, Orkin established its first franchise in
China. With 25 Chinese cities having a population of
more than 10 million each, this initiative addresses the
significant potential for Orkin. We also launched two
other international franchises in Nigeria, which are the
first for Orkin in Africa. To date, we have 18 international
franchises, and they are financially beneficial while
providing brand enhancement for Orkin worldwide.
Overcoming challenges and taking advantage of
opportunities have resulted in impressive results for
Rollins. In fact, our stock has appreciated more than
140% over the past five years, which greatly benefits
the vast majority of Rollins employees who are
shareholders in the Company’s 401k plan. Even in
a soft economy, they have improved their financial
situation as a result of the stock’s performance.
Because these employees have a stake in the
Company’s performance, they think and act like
owners, which further drives our success.
OUR FOUNDATION FOR THE FUTURE
During 2011, the Rollins Board of Directors named
John Wilson, Gene Iarocci and Bob Wanzer as
corporate officers and vice presidents. These
respected and highly successful company leaders
possess years of diverse experience. We are fortunate
that they are now assuming a greater role in
directing the future of our Company.
Going forward, we will remain focused on better
satisfying our customers, delivering excellent pest
control solutions, and growing our business. We will
continue to pursue strategic acquisitions that are
complementary. We will maintain a relentless drive to
improve and innovate. We realize that if we are not
moving forward, we will fall behind – a realization
that fuels much of what we do.
We express our sincere thanks to our dedicated
employees for their commitment and hard work, for
without them, Rollins’ results would not be possible. We
also thank our Board members for their invaluable
guidance, our valued customers for their confidence
in us and our investors for their continued support.
R. Randall Rollins Chairman of the Board
Gary W. Rollins Chief Executive Officer,
President and Chief Operating Officer
42011 Annual Report

We must be relentlessly consumer-focused in the ways we deliver solutions, providing value each time we interact with a customer.
Today’s savvy consumers have greater access to research information and references about a product or service than ever before. As a result, they have greater knowledge and higher expectations from service companies like Rollins. Their loyalty to a brand or company cannot be taken for granted. That means we must be relentlessly consumer-focused in all that we do, while adding value at every opportunity.
In our quest to exceed customer expectations, we utilize customer satisfaction survey tools
that allow us to obtain immediate feedback to better understand or confirm what our
customers want and expect. These surveys allow us to focus on continually improving
every area of our business that touches customers – beginning with the sales interaction
and continuing through the technician’s visits, to billing. The data we receive can be acted
upon, and improve the entire customer experience by helping us communicate more
effectively, perform our services better, and ultimately improve customer retention.
We have begun to translate the feedback from these satisfaction surveys into key
learnings, improve our training to better equip technicians with greater knowledge
and ability to provide more effective pest solutions that meet our customers’ needs and
expectations. As a result of this customer information, we have improved our phone
systems and call processing to enhance our ability to communicate with our customers
through an after-hours local voicemail messaging system. This allows the branch
employees, who know their customers best, to more quickly address the needs of their
own customers and better react to those needs.
Making Service Second Nature
5 2011 Annual Report
We continue to embrace digital and social media to
better attract and respond to our customers, which
includes managing the online profile for all Rollins
brands. We’ve also added an interactive component
to our traditional advertising that allows us to better
gauge how it is performing. The “big bugs” and
rodent TV spots we ran last year grew in popularity
and resulted in more Orkin awareness, more
searches and more leads.
Serving varied communities goes hand in hand with
serving our customers and building our brands, To
that end we participated in many important causes.
Our Fight The Bite partner, Nothing But Nets, continued
distributing insecticide-treated bed nets to fight the
spread of malaria in Africa. In 2011, Nothing But Nets
targeted Cameroon where malaria rates have tripled in
the past five years, making this disease the number one
cause of death. We are proud to have sent more than
24,000 nets this year to Cameroon and other African
areas to help prevent this deadly disease, bringing our
four-year program total to more than 81,500 nets.
Because of our strong and long-standing relationship
with the Centers for Disease Control and Prevention
(CDC), Orkin became the exclusive pest control provider
for the CDC’s Lyme and Other Tick-borne Diseases
Prevention Study. Our technicians worked with CDC
and state health departments to provide one-time
preventative tick treatments to more than 1,500
properties in specific areas of New York, Connecticut
and Maryland. We believe that this is the first study
of its kind to examine potential links between pest
control and disease prevention. Findings are
expected in 2013.
On a local level, every branch, region and division is
challenged to support local community initiatives, such
as natural disaster aid, cancer research, youth sports
teams, local education, and many more. From Crane’s
Adopt-a-School Initiative and the Orkin Junior Pest
Investigators program, to donating mattress protectors
for a bed bug-infested YMCA shelter for homeless men,
we work diligently to make a positive impact in the
communities we serve.
And, for the 29th consecutive year, Rollins and its
subsidiaries have supported the United Way in numerous
cities, and provided more than $750,000 in 2011
to help support our local communities. Making a
difference in our communities is one more way we
can build stronger and lasting relationships with our
customers while attracting new business.
62011 Annual Report
Rollins, we realize that customer retention and employee retention are inextricably linked. Because satisfied employees remain at the Company longer and provide better service to customers, we’ve developed several
initiatives to understand employees’ attitudes toward their careers and the Company, and better address their concerns. These initiatives include confidential, written surveys, interviews with randomly selected employees, and mandatory town hall meetings at each location to discuss issues of interest. Management then develops action plans to address the concerns and reports back to employees with solutions. These efforts to gauge and improve employee satisfaction are paying off. During 2011, our surveys reflected high job satisfaction, which translated into the lowest turnover rate in the Company’s history.
Improving Opportunities For EmployeesLast year we were proud to recognize three
employees who each celebrated more than
50 years of service with the Company. During their
tenure, they all have witnessed dramatic changes
in the Company and in the pest control business. All
three have been provided a variety of opportunities
as our Company has grown and evolved with the
times. With the addition of the Rollins Independent
Brands, today we have even more employee
advancement opportunities throughout the Company.
Rollins remains one of the few corporations that have
continued to hire in a weak economic environment.
Accordingly, we are implementing a more friendly
and efficient new-hire on-boarding process to help
employees get on board and engaged in their new
jobs more quickly.
Our training overall benefits from using a Rollins
“all-brand,” best-in-class approach that harvests the
best methods and materials from all of our brands.
We are serious about cultivating human capital,
which is the key to our future. With the Company’s
continued growth, we will have a constant need
for bench strength to maintain high performance.
As a result, we’ve developed several management
programs to identify and train strong and innovative
Rollins leaders of the future.
At
7 2011 Annual Report
The highly successful Rollins University Management
Development School provides to our location
managers the skill development needed to better
manage their teams. During 2011, 54 managers
successfully completed this training. Additionally,
we added two new advanced management training
programs to further grow our leadership bench.
The Advanced Management Program is designed
to hone leadership skills for our more seasoned
managers. To accomplish this objective, Rollins
partnered with Georgia State University’s J. Mack
Robinson School of Business to develop a senior-
level leadership program, creating the Rollins
Leadership Development Program. This innovative
program is geared toward multi-unit leaders, to
further develop already high-achieving regional
staff and corporate support center managers. In its
inaugural class in late 2011, we graduated 24 of these
exceptional company leaders.
Additionally, through the Women’s Leadership Council
and Orkin’s Women of Excellence Award, the Company
continues to encourage hiring, training and promoting
women throughout the company.
Rollins is also in the process of transitioning from
training delivered by satellite to a Web-based system
that will allow us to expand training to a greater
number of sites in a more cost-effective manner. This
enables us to share training among all brands and
both domestic and international franchises.
The culmination of all of our training initiatives
resulted in Rollins being recognized by Training
Magazine for the ninth consecutive year, as one of
the Top 125 organizations for excellence in human
capital development. Orkin also received a Learning
Elite award from Chief Learning Officer magazine,
ranking 13th on the magazine’s list of 43 companies
that make employee learning and development an
important part of their culture. The magazine also
awarded Orkin the Editor’s Choice Award for overall
training excellence.
The pest control industry’s natural seasonal
fluctuations can negatively affect employee
retention, especially in our call centers. During 2011,
Rollins forged a partnership with a third party for
handling increased call volume during peak spring
and summer months. Instead of hiring employees
to handle the peak in consumer calls, and then
downsizing in the fall when call volume drops, we
began co-sourcing with an independent, home-
based contractor. This new initiative was the result of
benchmarking with a major corporation outside the
pest control industry to seek ways to improve our call
center performance. Co-sourcing allows us to maintain
our commitment to our core group of employees while
efficiently and more successfully serving an increased
number of customers in the high-volume season.
82011 Annual Report

9 2011 Annual Report
The Company’s investments in new technology are designed to improve our service delivery and better meet our customers’ needs. Ultimately these investments will result in improved customer and employee retention, while increasing revenue and profit – all of which will strengthen the Company’s results and performance.
During 2011, we tested a new customer relationship management (CRM) and branch system operating software designed to improve our business processes. After all issues and required interfaces are completed, the new system will roll out to more than 400 branches and 58 franchise operations. The expectation is to improve business execution and enhance real-time online reporting. We expect the rollout to be completed in 2013. The system’s advanced scheduling and routing capabilities will be integrated with mapping features to optimize route efficiency, thereby saving fuel and vehicle wear. In general, the new operating software will enable us to adapt more quickly to customer preferences and better meet or exceed their service expectations. An earlier release of the computer system is already in use at our Western Industries locations, most of our domestic franchises and at three pilot Orkin locations.
In addition, last year we completed developing and installing a new platform for all call centers to improve efficiencies and standardize management reporting. Feedback from our primary call center employees has been positive. Call time has been reduced as a result of the software’s streamlined screens and new processes.
In a related project, we replaced our seven-year-old PBX phone system, enhancing call routing for the entire Company and providing after-hour customer messaging.
For our large commercial customers, we recognized a need for an automated data and reporting system to satisfy these customers’ information requirements. By year-end, we defined the system we will use and mapped out an implementation plan for 2012.
Laptops, smart phones and enhanced software were important technology focuses for our commercial sales forces that occurred this year. Developed by our
Orkin Canada business, the sales management software was modified for use among all of the Rollins U.S. brands. We now have one system that helps commercial sales managers better direct the daily activities of their sales force thereby improving efficiency, data collection and sales. This software is in use at all Orkin commercial locations, and we expect it to be installed at our Rollins’ independent brands during the first quarter of 2012.
On the residential front, our Home Suite Sales Presentation application, developed by our marketing group, and designed for our termite sales inspectors, has also been field tested and will be rolled out in early 2012.
Throughout the company, we have replaced outdated computer hardware, including more than 2,350 desktop computers and 2,138 handheld devices. All of these replacements will help improve office and service technician productivity and overall branch profitability. Orkin Canada is rolling out its new proprietary handheld application, which already has contributed to increased technician productivity. We likewise look forward to benefits in the U.S. as we adapt their software and processes for use here.
These projects and others contributed to a busy and productive year of technological enhancement at Rollins, and we anxiously anticipate realizing operational improvement in the years ahead.
At Rollins, continuous improvement is deeply embedded in our culture. We are constantly striving to work more efficiently, effectively and economically, and nowhere is our commitment to improvement greater than where it relates to customer service. We know that strong customer relationships reaffirm their purchase decision and leads to valuable referrals to other potential customers. Our goal is to exceed their expectations every day in every way.
At Rollins, continuous improvement is deeply embedded in our culture of service.
Implementing New Technology
102011 Annual Report
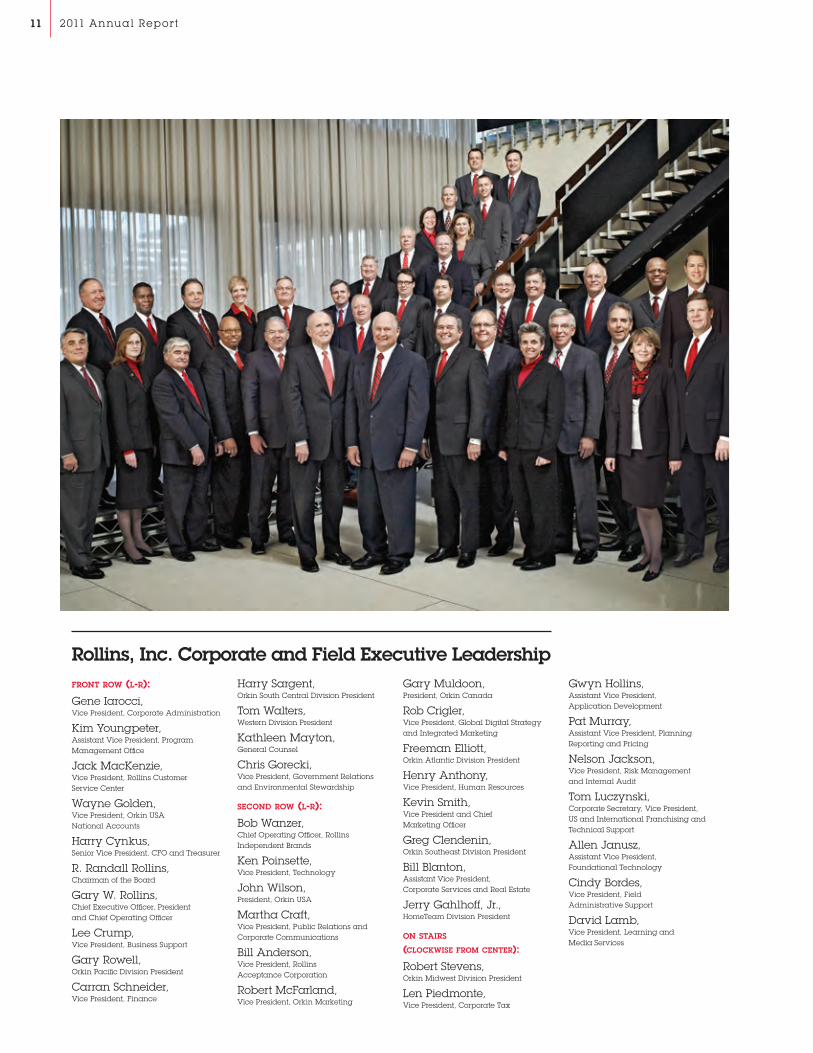
FRONT ROw (L-R): Gene Iarocci, Vice President, Corporate Administration
Kim Youngpeter, Assistant Vice President, Program Management Office
Jack MacKenzie, Vice President, Rollins Customer Service Center
Wayne Golden, Vice President, Orkin USA National Accounts
Harry Cynkus, Senior Vice President, CFO and Treasurer
R. Randall Rollins, Chairman of the Board
Gary W. Rollins, Chief Executive Officer, President and Chief Operating Officer
Lee Crump, Vice President, Business Support
Gary Rowell, Orkin Pacific Division President
Carran Schneider, Vice President, Finance
Harry Sargent, Orkin South Central Division President
Tom Walters, Western Division President
Kathleen Mayton, General Counsel
Chris Gorecki, Vice President, Government Relations and Environmental Stewardship
SECOND ROw (L-R): Bob Wanzer, Chief Operating Officer, Rollins Independent Brands
Ken Poinsette, Vice President, Technology
John Wilson, President, Orkin USA
Martha Craft, Vice President, Public Relations and Corporate Communications
Bill Anderson, Vice President, Rollins Acceptance Corporation
Robert McFarland, Vice President, Orkin Marketing
Gary Muldoon, President, Orkin Canada
Rob Crigler, Vice President, Global Digital Strategy and Integrated Marketing
Freeman Elliott, Orkin Atlantic Division President
Henry Anthony, Vice President, Human Resources
Kevin Smith, Vice President and Chief Marketing Officer
Greg Clendenin, Orkin Southeast Division President
Bill Blanton, Assistant Vice President, Corporate Services and Real Estate
Jerry Gahlhoff, Jr., HomeTeam Division President
ON STAIRS (CLOCkwISE FROM CENTER):
Robert Stevens, Orkin Midwest Division President
Len Piedmonte, Vice President, Corporate Tax
Gwyn Hollins, Assistant Vice President, Application Development
Pat Murray, Assistant Vice President, Planning Reporting and Pricing
Nelson Jackson, Vice President, Risk Management and Internal Audit
Tom Luczynski, Corporate Secretary, Vice President, US and International Franchising and Technical Support
Allen Janusz, Assistant Vice President, Foundational Technology
Cindy Bordes, Vice President, Field Administrative Support
David Lamb, Vice President, Learning and Media Services
Rollins, Inc. Corporate and Field Executive Leadership
11 2011 Annual Report
UNITED STATESSECURITIES AND EXCHANGE COMMISSION
Washington, D.C. 20549
FORM 10-KANNUAL REPORT PURSUANT TO SECTION 13 OR 15(d) OF THE SECURITIES EXCHANGE ACT OF 1934
FOR THE FISCAL YEAR ENDED DECEMBER 31, 2011
Commission file No. 1-4422
ROLLINS, INC.(Exact name of registrant as specified in its charter)
Delaware 51-0068479(State or other jurisdiction of (I.R.S. Employer Identification No.)incorporation or organization)
2170 Piedmont Road, N.E., Atlanta, Georgia 30324(Address of principal executive offices) (Zip Code)
Registrant’s telephone number, including area code: (404) 888-2000
Securities registered pursuant to Section 12(b) of the Act:
Name of eachTitle of each class Exchange on which registered
Common Stock, $1 Par Value The New York Stock Exchange
Securities registered pursuant to section 12(g) of the Act: None.
Indicate by check mark if the registrant is a well-known seasoned issuer, as defined in Rule 405 of the SecuritiesAct. Yes � No �
Indicate by check mark if the registrant is not required to file reports pursuant to Section 13 or Section 15(d) of theAct. Yes � No �
Indicate by check mark whether the Registrant (1) has filed all reports required to be filed by Section 13 or 15(d) of theSecurities Exchange Act of 1934 during the preceding 12 months (or for such shorter period that the Registrant was requiredto file such reports), and (2) has been subject to such filing requirements for the past 90 days. Yes � No �
Indicate by check mark whether the registrant has submitted electronically and posted on its corporate Web site, if any, everyInteractive Data File required to be submitted and posted pursuant to Rule 405 of Regulation S-T (§ 232.405 of this chapter)during the preceding 12 months (or for such shorter period that the registrant was required to submit and post suchfiles). Yes � No �
Indicate by check mark if disclosure of delinquent filers pursuant to Item 405 of Regulation S-K is not contained herein, andwill not be contained, to the best of Registrant’s knowledge, in definitive proxy or information statements incorporated byreference in Part III of this Form 10-K or any amendment to this Form 10-K. �
Indicate by check mark whether the registrant is a large accelerated filer, an accelerated filer, a non-accelerated filer or asmaller reporting company. See the definitions of ‘‘large accelerated filer,’’ ‘‘accelerated filer’’ and ‘‘smaller reportingcompany’’ in Rule 12b-2 of the Exchange Act.
Large accelerated filer � Accelerated filer � Non-accelerated filer � Smaller Reporting Company �
Indicate by check mark whether the registrant is a shell company (as defined in Rule 12b-2 of the ExchangeAct). Yes � No �
The aggregate market value of Rollins, Inc. Common Stock held by non-affiliates on June 30, 2011 was $1,303,058,136 basedon the reported last sale price of common stock on June 30, 2011, which is the last business day of the registrant’s mostrecently completed second fiscal quarter.
Rollins, Inc. had 146,868,151 shares of Common Stock outstanding as of January 31, 2012.
DOCUMENTS INCORPORATED BY REFERENCE
Portions of the Proxy Statement for the 2012 Annual Meeting of Stockholders of Rollins, Inc. are incorporated by referenceinto Part III, Items 10-14.
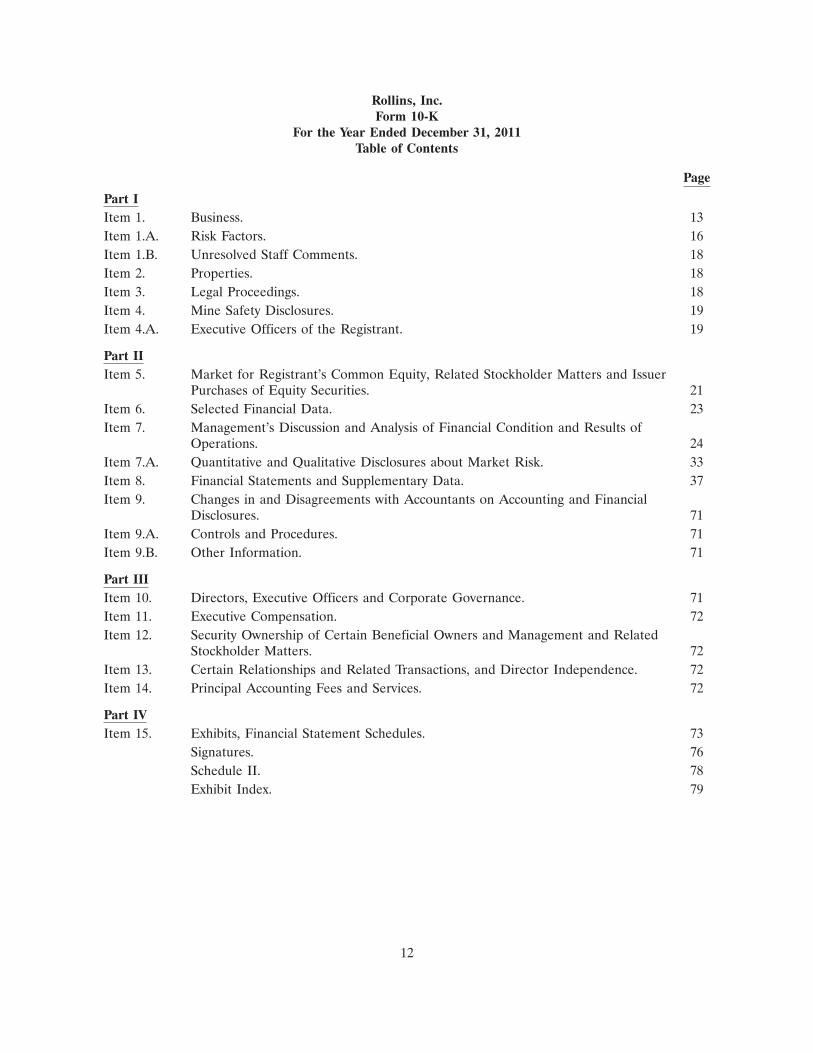
Rollins, Inc.Form 10-K
For the Year Ended December 31, 2011Table of Contents
Page
Part IItem 1. Business. 13Item 1.A. Risk Factors. 16Item 1.B. Unresolved Staff Comments. 18Item 2. Properties. 18Item 3. Legal Proceedings. 18Item 4. Mine Safety Disclosures. 19Item 4.A. Executive Officers of the Registrant. 19
Part IIItem 5. Market for Registrant’s Common Equity, Related Stockholder Matters and Issuer
Purchases of Equity Securities. 21Item 6. Selected Financial Data. 23Item 7. Management’s Discussion and Analysis of Financial Condition and Results of
Operations. 24Item 7.A. Quantitative and Qualitative Disclosures about Market Risk. 33Item 8. Financial Statements and Supplementary Data. 37Item 9. Changes in and Disagreements with Accountants on Accounting and Financial
Disclosures. 71Item 9.A. Controls and Procedures. 71Item 9.B. Other Information. 71
Part IIIItem 10. Directors, Executive Officers and Corporate Governance. 71Item 11. Executive Compensation. 72Item 12. Security Ownership of Certain Beneficial Owners and Management and Related
Stockholder Matters. 72Item 13. Certain Relationships and Related Transactions, and Director Independence. 72Item 14. Principal Accounting Fees and Services. 72
Part IVItem 15. Exhibits, Financial Statement Schedules. 73
Signatures. 76Schedule II. 78Exhibit Index. 79
12
PART I
Item 1. Business
General
Rollins, Inc. (the ‘‘Company’’) was originally incorporated in 1948 under the laws of the state of Delawareas Rollins Broadcasting, Inc.
The Company is an international service company with headquarters located in Atlanta, Georgia,providing pest and termite control services through its wholly-owned subsidiaries to both residential andcommercial customers in North America with international franchises in Central America, the Caribbean,the Middle East, Asia, the Mediterranean, Europe and Africa. Services are performed through a contractthat specifies the pricing arrangement with the customer.
Orkin, LLC. (‘‘Orkin’’), a wholly-owned subsidiary of the Company founded in 1901, is one of the world’slargest pest and termite control companies. It provides customized services from over 400 locations. Orkinserves customers, either directly or indirectly through franchises, in the United States, Canada, CentralAmerica, the Caribbean, the Middle East, Asia, the Mediterranean, Europe and Africa providing essentialpest control services and protection against termite damage, rodents and insects to homes and businesses,including hotels, food service establishments, food manufacturers, retailers and transportation companies.Orkin operates under the Orkin�, and Orkin Canada� trademarks and the AcuridSM service mark. TheOrkin� brand name makes Orkin the most recognized pest and termite company throughout the UnitedStates. The Orkin Canada brand name provides similar brand recognition throughout Canada.
Orkin Canada, a wholly-owned subsidiary of Orkin founded in 1952, was acquired by Orkin in 1999. OrkinCanada is Canada’s largest pest control provider and a leader in the development of fast, effective andenvironmentally responsible pest control solutions.
Western Pest Services (‘‘Western’’), a wholly-owned subsidiary of the Company founded in 1928, wasacquired by Rollins, Inc. in 2004. Western is primarily a commercial pest control service company and itsbusiness complements most of the services Orkin offers focusing on the northeastern United States.
The Industrial Fumigant Company (‘‘IFC’’), a wholly-owned subsidiary of the Company founded in 1937,was acquired by Rollins, Inc. in 2005. IFC is a leading provider of pest management and sanitation servicesand products to the food and commodity industries.
HomeTeam Pest Defense (‘‘HomeTeam’’), a wholly-owned subsidiary of the Company established in 1996,was acquired by Rollins, Inc. in April 2008. At the time of the acquisition, HomeTeam, with its uniqueTaexx in the wall system, was recognized as a premier pest control business and ranked as the 4th largestcompany in the industry. HomeTeam services home builders nationally.
The Company has several smaller wholly-owned subsidiaries that in total make up less than 5% of theCompany’s total revenues.
The Company has only one reportable segment, its pest and termite control business. Revenue, operatingprofit and identifiable assets for this segment, which includes the United States, Canada, Central America,the Caribbean, the Middle East, Asia, the Mediterranean, Europe and Africa are included in Item 8 of thisdocument, ‘‘Financial Statements and Supplementary Data’’ on pages 37 and 38. The Company’s results ofoperations and its financial condition are not reliant upon any single customer or a few customers or theCompany’s foreign operations.
Common Stock Repurchase Program
During the year ended December 31, 2011, the Company repurchased 1.5 million shares at a weightedaverage price of $18.68 with 1.9 million shares repurchased in 2010 at a weighted average price of $13.95.In total, there are 1.1 million additional shares authorized to be repurchased under prior Board approval.
13
The program does not have an expiration date. All share and per share repurchases are adjusted for the3-for-2 stock split effective December 10, 2010.
Backlog
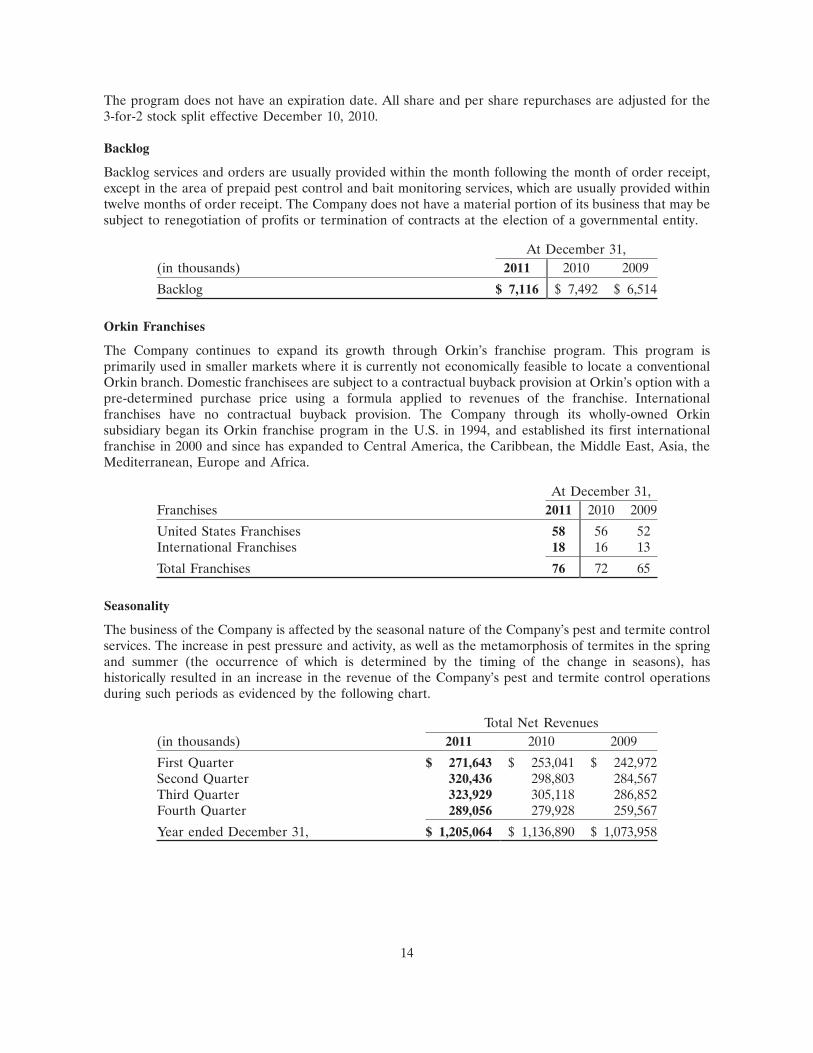
Backlog services and orders are usually provided within the month following the month of order receipt,except in the area of prepaid pest control and bait monitoring services, which are usually provided withintwelve months of order receipt. The Company does not have a material portion of its business that may besubject to renegotiation of profits or termination of contracts at the election of a governmental entity.
At December 31,(in thousands) 2011 2010 2009
Backlog $ 7,116 $ 7,492 $ 6,514
Orkin Franchises
The Company continues to expand its growth through Orkin’s franchise program. This program isprimarily used in smaller markets where it is currently not economically feasible to locate a conventionalOrkin branch. Domestic franchisees are subject to a contractual buyback provision at Orkin’s option with apre-determined purchase price using a formula applied to revenues of the franchise. Internationalfranchises have no contractual buyback provision. The Company through its wholly-owned Orkinsubsidiary began its Orkin franchise program in the U.S. in 1994, and established its first internationalfranchise in 2000 and since has expanded to Central America, the Caribbean, the Middle East, Asia, theMediterranean, Europe and Africa.
At December 31,Franchises 2011 2010 2009
United States Franchises 58 56 52International Franchises 18 16 13
Total Franchises 76 72 65
Seasonality
The business of the Company is affected by the seasonal nature of the Company’s pest and termite controlservices. The increase in pest pressure and activity, as well as the metamorphosis of termites in the springand summer (the occurrence of which is determined by the timing of the change in seasons), hashistorically resulted in an increase in the revenue of the Company’s pest and termite control operationsduring such periods as evidenced by the following chart.
Total Net Revenues(in thousands) 2011 2010 2009
First Quarter $ 271,643 $ 253,041 $ 242,972Second Quarter 320,436 298,803 284,567Third Quarter 323,929 305,118 286,852Fourth Quarter 289,056 279,928 259,567
Year ended December 31, $ 1,205,064 $ 1,136,890 $ 1,073,958
14
Inventories
The Company has a relationship with a national pest control product distributor and other vendors for pestand termite control treatment products. Rollins maintains a sufficient level of chemicals, materials andother supplies to fulfill its immediate servicing needs and to alleviate any potential short-term shortage inavailability from its national network of suppliers.
Competition
The Company believes that Rollins, through its wholly-owned subsidiaries Orkin, Orkin Canada,HomeTeam Pest Defense, Western Pest Services, The Industrial Fumigant Company, Crane Pest Control,Waltham Services and TruTech competes favorably with competitors as one of the world’s largest pest andtermite control companies. The Company’s competitors include Terminix, Ecolab and Rentokil.
The principal methods of competition in the Company’s pest and termite control business are quality ofservice and guarantees, including money-back guarantees on pest and termite control, and the termitere-treatment and damage repair guarantee to qualified homeowners.
Research and Development
Expenditures by the Company on research activities relating to the development of new products orservices are not significant. Some of the new and improved service methods and products are researched,developed and produced by unaffiliated universities and companies. Also, a portion of these methods andproducts are produced to the specifications provided by the Company.
The Company maintains a close relationship with several universities for research and validation oftreatment procedures and material selection.
The Company conducts tests of new products with the specific manufacturers of such products. TheCompany also works closely with leading entomologists, industry consultants and suppliers to improveservice protocols and materials.
Environmental and Regulatory Considerations
The Company’s pest control business is subject to various legislative and regulatory enactments that aredesigned to protect the environment, public health and consumers. Compliance with these requirementshas not had a material negative impact on the Company’s financial position, results of operations orliquidity.
Federal Insecticide Fungicide and Rodentcide Act (‘‘FIFRA’’)
This federal law (as amended) grants to the states the responsibility to be the primary agent inenforcement and conditions under which pest control companies operate. Each state must meet certainguidelines of the Environmental Protection Agency in regulating the following: licensing, record keeping,contracts, standards of application, training and registration of products. This allows each state to institutecertain features that set their regulatory programs in keeping with special interests of the citizens’ wishes ineach state. The pest control industry is impacted by these federal and state regulations.
Food Quality Protection Act of 1996 (‘‘FQPA’’)
The FQPA governs the manufacture, labeling, handling and use of pesticides and does not have a directimpact on how the Company conducts its business.
15
Environmental Remediation
The Comprehensive Environmental Response, Compensation and Liability Act (‘‘CERCLA’’), also knownas Superfund, is the primary Federal statute regulating the cleanup of inactive hazardous substance sitesand imposing liability for cleanup on the responsible parties. Responsibilities governed by this statuteinclude the management of hazardous substances, reporting releases of hazardous substances, andestablishing the necessary contracts and agreements to conduct cleanup. Customarily, the parties involvedwill work with the EPA and under the direction of the responsible state agency to agree and implement aplan for site remediation. Consistent with the Company’s responsibilities under these regulations, theCompany undertakes environmental assessments and remediation of hazardous substances from time totime as the Company determines its responsibilities for these purposes. As these situations arise, theCompany accrues management’s best estimate of future costs for these activities. Based on management’scurrent estimates of these costs, management does not believe these costs are material to the Company’sfinancial condition or operating results.
Employees
The number of persons employed by the Company as of January 31, 2012 was approximately 10,100.
At December 31,2011 2010 2009
Employees 10,112 10,088 9,758
Available Information
Our Annual Reports on Form 10-K, Quarterly Reports on Form 10-Q, Current Reports on Form 8-K andamendments to these reports, are available free of charge on our web site at www.rollins.com as soon asreasonably practicable after those reports are electronically filed with or furnished to the Securities andExchange Commission.
Item 1.A. Risk Factors.
We may not be able to maintain our competitive position in the competitive pest control industry in the future.
We operate in a highly competitive industry. Our revenues and earnings may be affected by changes incompetitive prices, and general economic issues. We compete with other large pest control companies, aswell as numerous smaller pest control companies, for a finite number of customers. We believe that theprincipal competitive factors in the market areas that we serve are service quality and product andavailability, terms of guarantees, reputation for safety, technical proficiency and price. Although we believethat our experience and reputation for safety and quality service is excellent, we cannot assure that we willbe able to maintain our competitive position.
Economic conditions may adversely affect our business.
Pest and termite services represent discretionary expenditures to most of our residential customers. Asconsumers restrict their discretionary expenditures, we may suffer a decline in revenues from ourresidential service lines. Economic downturns can also adversely affect our commercial customers,including food service, hospitality and food processing industries whose business levels are particularlysensitive to adverse economies. For example, we may lose commercial customers and related revenuesbecause of consolidation or cessation of commercial businesses or because these businesses switch to alower cost provider.
16
We may not be able to identify, complete or successfully integrate acquisitions.
Acquisitions have been and may continue to be an important element of our business strategy. We cannotassure that we will be able to identify and acquire acceptable acquisition candidates on terms favorable tous in the future. We cannot assure that we will be able to integrate successfully the operations and assets ofany acquired business with our own business. Any inability on our part to integrate and manage the growthfrom acquired businesses could have a material adverse effect on our results of operations and financialcondition.
Our operations are affected by adverse weather conditions.
Our operations are directly impacted by the weather conditions across the United States and Canada. Thebusiness of the Company is affected by the seasonal nature of the Company’s pest and termite controlservices. The increase in pest pressure and activity, as well as the metamorphosis of termites in the springand summer (the occurrence of which is determined by the timing of the change in seasons), hashistorically resulted in an increase in the revenue and income of the Company’s pest and termite controloperations during such periods. The business of the Company is also affected by extreme weather such asdrought which can greatly reduce the pest population for extended periods.
Our inability to attract and retain skilled workers may impair growth potential and profitability.
Our ability to remain productive and profitable will depend substantially on our ability to attract and retainskilled workers. Our ability to expand our operations is in part impacted by our ability to increase our laborforce. The demand for skilled employees is high, and the supply is very limited. A significant increase in thewages paid by competing employers could result in a reduction in our skilled labor force, increases in wagerates paid by us, or both. If either of these events occurred, our capacity and profitability could bediminished, and our growth potential could be impaired.
Our operations could be affected by pending and ongoing litigation.
In the normal course of business, some of the Company’s subsidiaries are defendants in a number oflawsuits or arbitrations, which allege that plaintiffs have been damaged. The Company does not believethat any pending claim, proceeding or litigation, either alone or in the aggregate, will have a materialadverse effect on the Company’s financial position; however, it is possible that an unfavorable outcome ofsome or all of the matters, however unlikely, could result in a charge that might be material to the resultsof an individual year.
Our operations may be adversely affected if we are unable to comply with regulatory and environmental laws.
Our business is significantly affected by environmental laws and other regulations relating to the pestcontrol industry and by changes in such laws and the level of enforcement of such laws. We are unable topredict the level of enforcement of existing laws and regulations, how such laws and regulations may beinterpreted by enforcement agencies or court rulings, or whether additional laws and regulations will beadopted. We believe our present operations substantially comply with applicable federal and stateenvironmental laws and regulations. We also believe that compliance with such laws has had no materialadverse effect on our operations to date. However, such environmental laws are changed frequently. Weare unable to predict whether environmental laws will, in the future, materially affect our operations andfinancial condition. Penalties for noncompliance with these laws may include cancellation of licenses, fines,and other corrective actions, which would negatively affect our future financial results.
17
The Company’s Management Has a Substantial Ownership Interest; Public Stockholders May Have NoEffective Voice In the Company’s Management
The Company has elected the ‘‘Controlled Company’’ exemption under rule 303A of the New York StockExchange (‘‘NYSE’’) Company Guide. The Company is a ‘‘Controlled Company’’ because a group thatincludes the Company’s Chairman of the Board, R. Randall Rollins and his brother, Gary W. Rollins, whois the President, Chief Executive Officer and Chief Operating Officer, also a director of the Company andcertain companies under their control, controls in excess of fifty percent of the Company’s voting power.As a ‘‘Controlled Company,’’ the Company need not comply with certain NYSE rules.
Rollins, Inc.’s executive officers, directors and their affiliates hold directly or through indirect beneficialownership, in the aggregate, approximately 57 percent of the Company’s outstanding shares of commonstock. As a result, these persons will effectively control the operations of the Company, including theelection of directors and approval of significant corporate transactions such as acquisitions and approval ofmatters requiring stockholder approval. This concentration of ownership could also have the effect ofdelaying or preventing a third party from acquiring control of the Company at a premium.
Item 1.B. Unresolved Staff Comments.
None
Item 2. Properties.
The Company’s administrative headquarters are owned by the Company, and are located at 2170 PiedmontRoad, N.E., Atlanta, Georgia 30324. The Company owns or leases over 500 branch offices and operatingfacilities used in its business as well as the Rollins Training Center located in Atlanta, Georgia, the RollinsCustomer Service Center located in Covington, Georgia, and the Pacific Division Administration andTraining Center in Riverside, California. None of the branch offices, individually considered, represents amaterially important physical property of the Company. The facilities are suitable and adequate to meetthe current and reasonably anticipated future needs of the Company.
Item 3. Legal Proceedings.
In the normal course of business, certain of the Company’s subsidiaries are defendants in a number oflawsuits or arbitrations, which allege that plaintiffs have been damaged as a result of the rendering ofservices by the defendant subsidiary. The subsidiaries are actively contesting these actions. Some lawsuitshave been filed (John Maciel v. Orkin, Inc., et al.; Douglas F. Bracho, Jr. v. Orkin, Inc., et al.; Salazar v. OrkinExterminating Company, Inc.; Jennifer M. Welsh et al. v. Orkin, LLC, et al.; and Jennifer Thompson and JanetFlood v. Philadelphia Management Company, Parkway Associated, Parkway House Apartments, BarbaraWilliams, and Western Pest Services) in which the plaintiffs are seeking certification of a class. These casesoriginate in California, South Carolina (Welsh), and Pennsylvania (Flood), respectively. The Maciel lawsuit,a wage and hour related matter, was filed in the Superior Court of Los Angeles County, California. TheBracho lawsuit, a matter related to payroll deductions for use of Company vehicles, was filed in theSuperior Court of Orange County, California. The Welsh lawsuit, a termite service related matter, wasfiled in the Court of Common Pleas Fourteenth Judicial Circuit, County of Beaufort, South Carolina. TheFlood lawsuit, a bed bug service related matter filed by residents of an apartment complex, was filed in theCourt of Common Pleas of Philadelphia County, Pennsylvania. None of these matters has been scheduledfor a class certification hearing. The Salazar lawsuit, a wage and hour related matter, was filed in theSuperior Court of Orange County, California, and was removed to the United States District Court for theCentral District of California. The class claims of this matter were voluntarily dismissed in November 2011and are no longer pending. The Company believes these matters are without merit and intends tovigorously contest certification and defend itself through trial or arbitration, if necessary. Additionally, theCompany and a subsidiary, The Industrial Fumigant Company, LLC, are named defendants in Severn
18
Peanut Co. and Meherrin Agriculture & Chemical Co. v. Industrial Fumigant Co., et al. The Severn lawsuit, amatter related to a fumigation service, has been filed in the Northern Division of the United States DistrictCourt for the Eastern District of North Carolina. The plaintiffs are seeking damages for breach of contractand negligence. The Company believes the lawsuit to be without merit and intends to defend itselfvigorously through trial, if necessary. The Company does not believe that any pending claim, proceeding orlitigation, either alone or in the aggregate, will have a material adverse effect on the Company’s financialposition, results of operations or liquidity; however, it is possible that an unfavorable outcome of some orall of the matters, however unlikely, could result in a charge that might be material to the results of anindividual quarter or year.
Orkin is involved in certain environmental matters primarily arising in the normal course of business. Inthe opinion of management, the Company’s liability under any of these matters would not and did notmaterially affect its financial condition, results of operations or liquidity.
Item 4 Mine Safety Disclosures.
Not applicable.
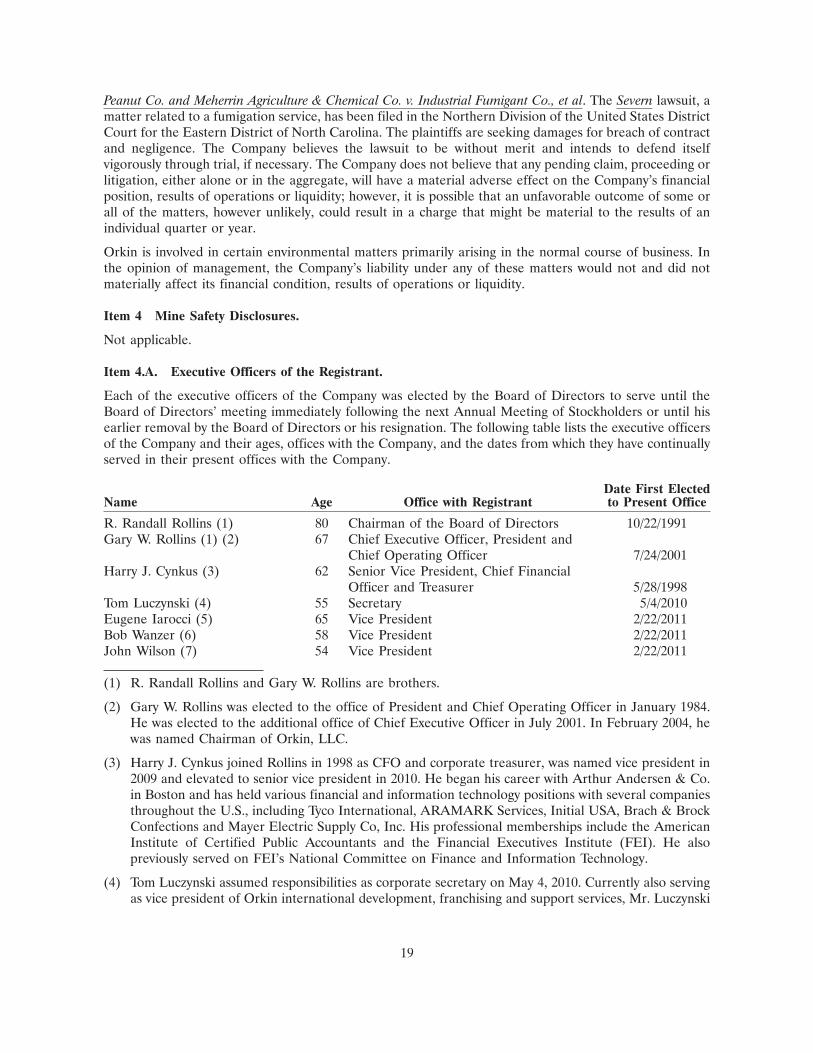
Item 4.A. Executive Officers of the Registrant.
Each of the executive officers of the Company was elected by the Board of Directors to serve until theBoard of Directors’ meeting immediately following the next Annual Meeting of Stockholders or until hisearlier removal by the Board of Directors or his resignation. The following table lists the executive officersof the Company and their ages, offices with the Company, and the dates from which they have continuallyserved in their present offices with the Company.
Date First ElectedName Age Office with Registrant to Present Office
R. Randall Rollins (1) 80 Chairman of the Board of Directors 10/22/1991Gary W. Rollins (1) (2) 67 Chief Executive Officer, President and
Chief Operating Officer 7/24/2001Harry J. Cynkus (3) 62 Senior Vice President, Chief Financial
Officer and Treasurer 5/28/1998Tom Luczynski (4) 55 Secretary 5/4/2010Eugene Iarocci (5) 65 Vice President 2/22/2011Bob Wanzer (6) 58 Vice President 2/22/2011John Wilson (7) 54 Vice President 2/22/2011
(1) R. Randall Rollins and Gary W. Rollins are brothers.
(2) Gary W. Rollins was elected to the office of President and Chief Operating Officer in January 1984.He was elected to the additional office of Chief Executive Officer in July 2001. In February 2004, hewas named Chairman of Orkin, LLC.
(3) Harry J. Cynkus joined Rollins in 1998 as CFO and corporate treasurer, was named vice president in2009 and elevated to senior vice president in 2010. He began his career with Arthur Andersen & Co.in Boston and has held various financial and information technology positions with several companiesthroughout the U.S., including Tyco International, ARAMARK Services, Initial USA, Brach & BrockConfections and Mayer Electric Supply Co, Inc. His professional memberships include the AmericanInstitute of Certified Public Accountants and the Financial Executives Institute (FEI). He alsopreviously served on FEI’s National Committee on Finance and Information Technology.
(4) Tom Luczynski assumed responsibilities as corporate secretary on May 4, 2010. Currently also servingas vice president of Orkin international development, franchising and support services, Mr. Luczynski
19
joined the company in 1985 as manager of reporting and was promoted to vice president of Orkinfinance in 1995. Prior to joining Rollins, Mr. Luczynski held financial positions with Revere Copperand Brass and Keytek-Elco Corporation. Mr. Luczynski is active in the pest control industry and haspreviously served on various industry board committees. In addition, he has served as president of theAtlanta chapter of FEI and president of the Atlanta chapter of the Institute of ManagementAccountants.
(5) Eugene Iarocci joined the Company in 2003 and has more than 20 years experience in multi-unitmanagement with a number of service and manufacturing industries, including Union CarbideCorporation where he worked for 24 years. He has served as Region Manager in Louisiana, DivisionVice President and President of Orkin’s Atlantic Division. Mr. Iarocci currently serves as Rollins’ VicePresident of Corporate Administration.
(6) Bob Wanzer joined the Company with the acquisition of HomeTeam Pest Defense in 2008. He joinedHomeTeam Pest Defense as President in 1998, became Chief Operating Officer in 2003 and CEO in2007. Prior to joining HomeTeam, Mr. Wanzer served as Regional Vice President and RegionalManager of Tru-Green / Chemlawn. Previously, Mr. Wanzer was employed as Regional GeneralManager for Emery Worldwide, a national provider of domestic and international airfreight deliveryservices. In addition, he has served on the Boards of Directors for both the Professional PestManagement Alliance and the National Pest Management Association. Mr. Wanzer now serves asChief Operating Officer for the Company’s wholly-owned subsidiaries HomeTeam Pest Defense,Orkin Canada, Western Pest Services, The Industrial Fumigant Company and Waltham Services.
(7) John Wilson joined the Company in 1996 and has held various positions of increasing responsibility,serving as a technician, sales inspector, branch manager, region manager, vice president and divisionpresident. His most senior positions have included Southeast Division president, Atlantic Division vicepresident and Central Commercial region manager. Mr. Wilson currently serves as President of OrkinUSA.
20
PART II
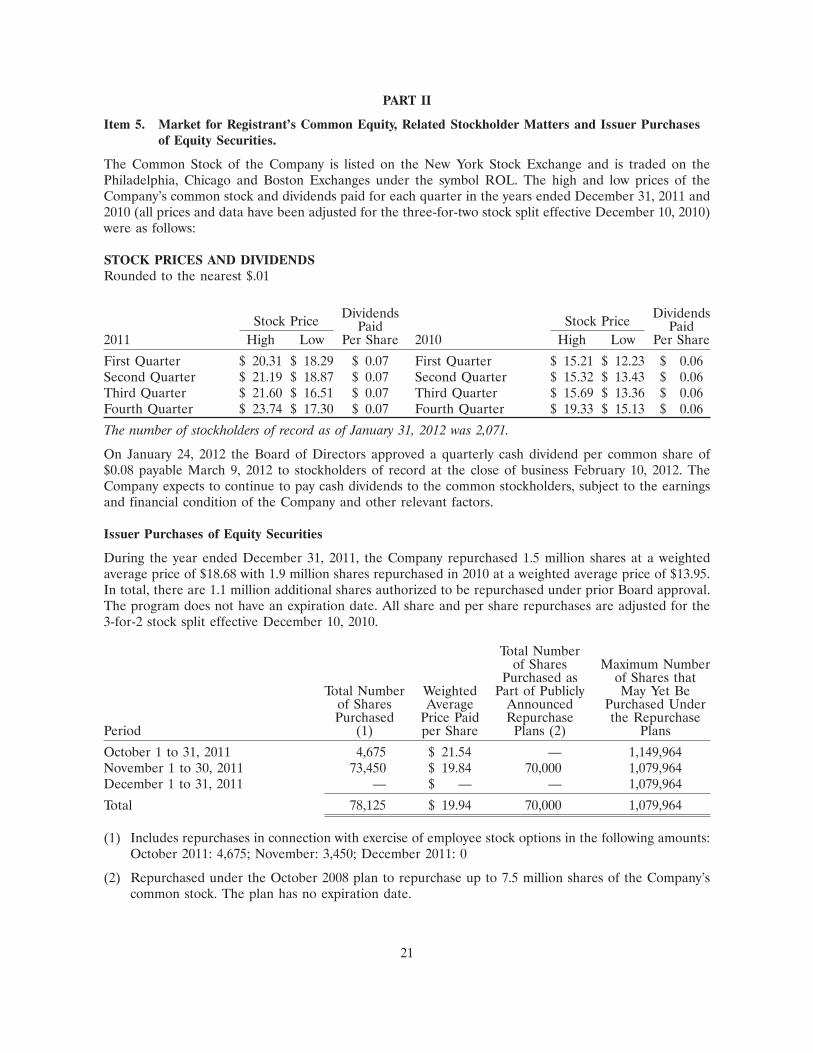
Item 5. Market for Registrant’s Common Equity, Related Stockholder Matters and Issuer Purchasesof Equity Securities.
The Common Stock of the Company is listed on the New York Stock Exchange and is traded on thePhiladelphia, Chicago and Boston Exchanges under the symbol ROL. The high and low prices of theCompany’s common stock and dividends paid for each quarter in the years ended December 31, 2011 and2010 (all prices and data have been adjusted for the three-for-two stock split effective December 10, 2010)were as follows:
STOCK PRICES AND DIVIDENDSRounded to the nearest $.01
Dividends DividendsStock Price Stock PricePaid Paid2011 High Low Per Share 2010 High Low Per Share
First Quarter $ 20.31 $ 18.29 $ 0.07 First Quarter $ 15.21 $ 12.23 $ 0.06Second Quarter $ 21.19 $ 18.87 $ 0.07 Second Quarter $ 15.32 $ 13.43 $ 0.06Third Quarter $ 21.60 $ 16.51 $ 0.07 Third Quarter $ 15.69 $ 13.36 $ 0.06Fourth Quarter $ 23.74 $ 17.30 $ 0.07 Fourth Quarter $ 19.33 $ 15.13 $ 0.06
The number of stockholders of record as of January 31, 2012 was 2,071.
On January 24, 2012 the Board of Directors approved a quarterly cash dividend per common share of$0.08 payable March 9, 2012 to stockholders of record at the close of business February 10, 2012. TheCompany expects to continue to pay cash dividends to the common stockholders, subject to the earningsand financial condition of the Company and other relevant factors.
Issuer Purchases of Equity Securities
During the year ended December 31, 2011, the Company repurchased 1.5 million shares at a weightedaverage price of $18.68 with 1.9 million shares repurchased in 2010 at a weighted average price of $13.95.In total, there are 1.1 million additional shares authorized to be repurchased under prior Board approval.The program does not have an expiration date. All share and per share repurchases are adjusted for the3-for-2 stock split effective December 10, 2010.
Total Numberof Shares Maximum Number
Purchased as of Shares thatTotal Number Weighted Part of Publicly May Yet Be
of Shares Average Announced Purchased UnderPurchased Price Paid Repurchase the Repurchase
Period (1) per Share Plans (2) Plans
October 1 to 31, 2011 4,675 $ 21.54 — 1,149,964November 1 to 30, 2011 73,450 $ 19.84 70,000 1,079,964December 1 to 31, 2011 — $ — — 1,079,964
Total 78,125 $ 19.94 70,000 1,079,964
(1) Includes repurchases in connection with exercise of employee stock options in the following amounts:October 2011: 4,675; November: 3,450; December 2011: 0
(2) Repurchased under the October 2008 plan to repurchase up to 7.5 million shares of the Company’scommon stock. The plan has no expiration date.
21
22FEB201202284884
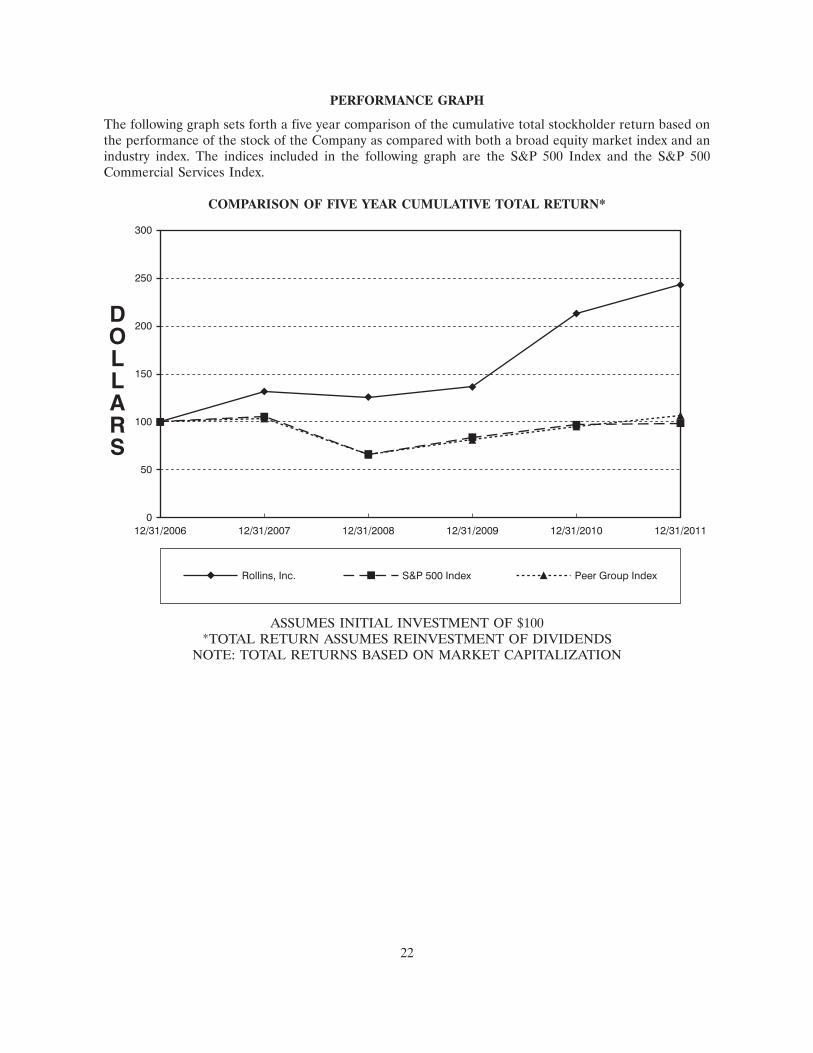
PERFORMANCE GRAPH
The following graph sets forth a five year comparison of the cumulative total stockholder return based onthe performance of the stock of the Company as compared with both a broad equity market index and anindustry index. The indices included in the following graph are the S&P 500 Index and the S&P 500Commercial Services Index.
COMPARISON OF FIVE YEAR CUMULATIVE TOTAL RETURN*
Rollins, Inc. S&P 500 Index Peer Group Index
12/31/2006 12/31/2007 12/31/2008 12/31/2009 12/31/201112/31/2010
DOLLARS
300
250
200
150
100
50
0
ASSUMES INITIAL INVESTMENT OF $100*TOTAL RETURN ASSUMES REINVESTMENT OF DIVIDENDS
NOTE: TOTAL RETURNS BASED ON MARKET CAPITALIZATION
22
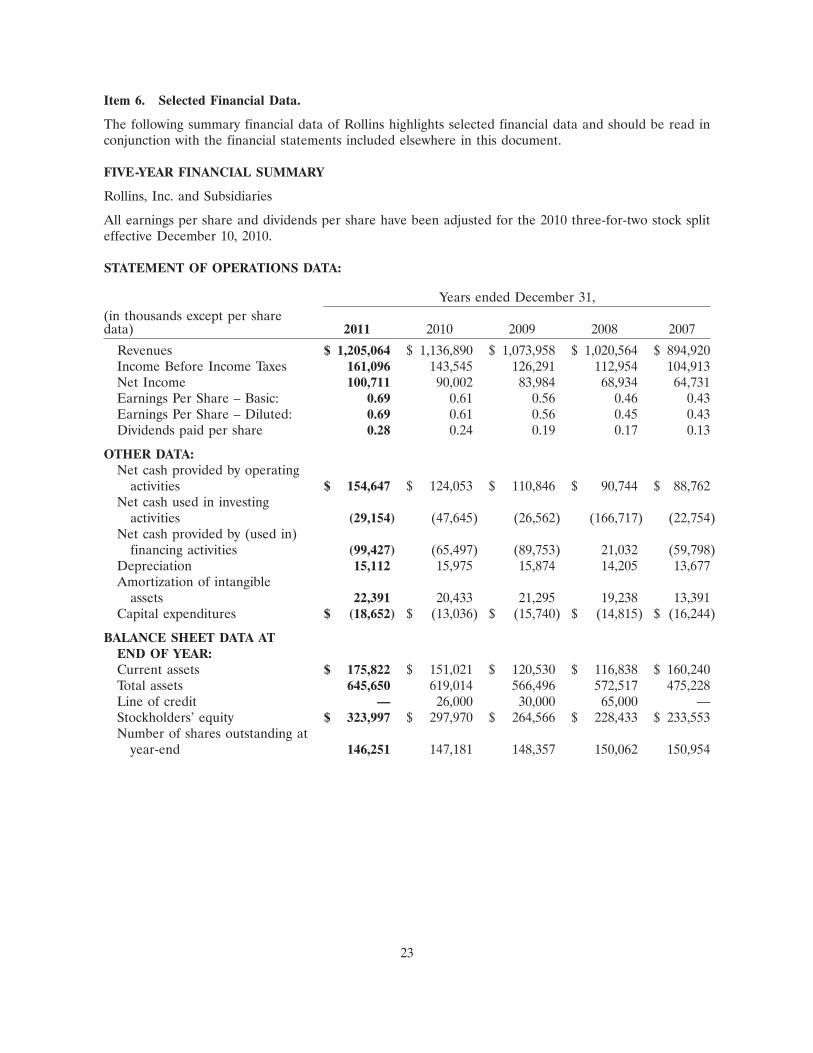
Item 6. Selected Financial Data.
The following summary financial data of Rollins highlights selected financial data and should be read inconjunction with the financial statements included elsewhere in this document.
FIVE-YEAR FINANCIAL SUMMARY
Rollins, Inc. and Subsidiaries
All earnings per share and dividends per share have been adjusted for the 2010 three-for-two stock spliteffective December 10, 2010.
STATEMENT OF OPERATIONS DATA:
Years ended December 31,(in thousands except per sharedata) 2011 2010 2009 2008 2007
Revenues $ 1,205,064 $ 1,136,890 $ 1,073,958 $ 1,020,564 $ 894,920Income Before Income Taxes 161,096 143,545 126,291 112,954 104,913Net Income 100,711 90,002 83,984 68,934 64,731Earnings Per Share – Basic: 0.69 0.61 0.56 0.46 0.43Earnings Per Share – Diluted: 0.69 0.61 0.56 0.45 0.43Dividends paid per share 0.28 0.24 0.19 0.17 0.13
OTHER DATA:Net cash provided by operating
activities $ 154,647 $ 124,053 $ 110,846 $ 90,744 $ 88,762Net cash used in investing
activities (29,154) (47,645) (26,562) (166,717) (22,754)Net cash provided by (used in)
financing activities (99,427) (65,497) (89,753) 21,032 (59,798)Depreciation 15,112 15,975 15,874 14,205 13,677Amortization of intangible
assets 22,391 20,433 21,295 19,238 13,391Capital expenditures $ (18,652) $ (13,036) $ (15,740) $ (14,815) $ (16,244)
BALANCE SHEET DATA ATEND OF YEAR:Current assets $ 175,822 $ 151,021 $ 120,530 $ 116,838 $ 160,240Total assets 645,650 619,014 566,496 572,517 475,228Line of credit — 26,000 30,000 65,000 —Stockholders’ equity $ 323,997 $ 297,970 $ 264,566 $ 228,433 $ 233,553Number of shares outstanding at
year-end 146,251 147,181 148,357 150,062 150,954
23
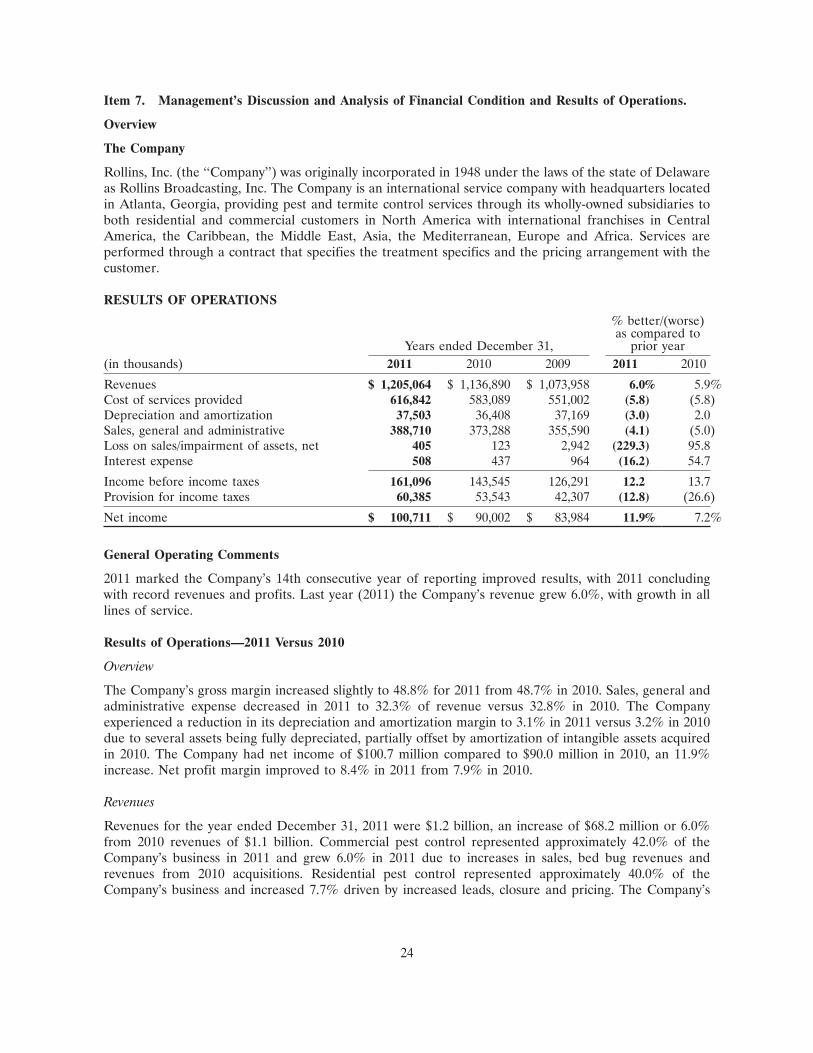
Item 7. Management’s Discussion and Analysis of Financial Condition and Results of Operations.
Overview
The Company
Rollins, Inc. (the ‘‘Company’’) was originally incorporated in 1948 under the laws of the state of Delawareas Rollins Broadcasting, Inc. The Company is an international service company with headquarters locatedin Atlanta, Georgia, providing pest and termite control services through its wholly-owned subsidiaries toboth residential and commercial customers in North America with international franchises in CentralAmerica, the Caribbean, the Middle East, Asia, the Mediterranean, Europe and Africa. Services areperformed through a contract that specifies the treatment specifics and the pricing arrangement with thecustomer.
RESULTS OF OPERATIONS
% better/(worse)as compared to
Years ended December 31, prior year(in thousands) 2011 2010 2009 2011 2010
Revenues $ 1,205,064 $ 1,136,890 $ 1,073,958 6.0% 5.9%Cost of services provided 616,842 583,089 551,002 (5.8) (5.8)Depreciation and amortization 37,503 36,408 37,169 (3.0) 2.0Sales, general and administrative 388,710 373,288 355,590 (4.1) (5.0)Loss on sales/impairment of assets, net 405 123 2,942 (229.3) 95.8Interest expense 508 437 964 (16.2) 54.7
Income before income taxes 161,096 143,545 126,291 12.2 13.7Provision for income taxes 60,385 53,543 42,307 (12.8) (26.6)
Net income $ 100,711 $ 90,002 $ 83,984 11.9% 7.2%
General Operating Comments
2011 marked the Company’s 14th consecutive year of reporting improved results, with 2011 concludingwith record revenues and profits. Last year (2011) the Company’s revenue grew 6.0%, with growth in alllines of service.
Results of Operations—2011 Versus 2010
Overview
The Company’s gross margin increased slightly to 48.8% for 2011 from 48.7% in 2010. Sales, general andadministrative expense decreased in 2011 to 32.3% of revenue versus 32.8% in 2010. The Companyexperienced a reduction in its depreciation and amortization margin to 3.1% in 2011 versus 3.2% in 2010due to several assets being fully depreciated, partially offset by amortization of intangible assets acquiredin 2010. The Company had net income of $100.7 million compared to $90.0 million in 2010, an 11.9%increase. Net profit margin improved to 8.4% in 2011 from 7.9% in 2010.
Revenues
Revenues for the year ended December 31, 2011 were $1.2 billion, an increase of $68.2 million or 6.0%from 2010 revenues of $1.1 billion. Commercial pest control represented approximately 42.0% of theCompany’s business in 2011 and grew 6.0% in 2011 due to increases in sales, bed bug revenues andrevenues from 2010 acquisitions. Residential pest control represented approximately 40.0% of theCompany’s business and increased 7.7% driven by increased leads, closure and pricing. The Company’s
24
termite business, which represented approximately 18.0% of the Company’s revenue, grew 2.8% in 2011due to increases in ancillary services sales as well as the Company’s expanded sales force and priceincreases.
The Company’s foreign operations accounted for approximately 8% of total revenues for the years endedDecember 31, 2011 and 2010. The Company established new franchises in China and two locations inNigeria for a total of 18 and 16 international franchises at December 31, 2011 and 2010, respectively. Orkinhad 76 and 72 total domestic and international franchises at December 31, 2011 and 2010, respectively.
Cost of Services Provided
For the twelve months ended December 31, 2011 cost of services provided increased $33.8 million or 5.8%,compared to the twelve months ended December 31, 2010. Gross margin for the year was 48.8% for 2011and 48.7% for 2010. While all costs increased during the year due to the Company’s 2010 acquisitions, fleetexpenses were marginally better due to better routing and scheduling and telephone costs were downmarginally due to cost controls.
Depreciation and Amortization
For the twelve months ended December 31, 2011, depreciation and amortization increased $1.1 million, or3.0% compared to the twelve months ended December 31, 2010. The increase is due to amortization ofintangible assets acquired in 2010, partially offset several assets being fully depreciated.
Sales, General and Administrative
For the twelve months ended December 31, 2011, sales, general and administrative (SG&A) expensesincreased $15.4 million, or 4.1% compared to the twelve months ended December 31, 2010 representing32.3% of revenues compared to 32.8% of revenues in the prior year. As a percentage of revenues, SG&Adecreased due to reductions in professional services related to the Company’s 2010 pricing study andreduced salaries as a percentage of revenues as the Company continues to maximize efficiency in itsworkforce.
Interest Expense, Net
Interest expense, net for the year ended December 31, 2011 was $0.5 million, an increase of $0.1 millioncompared to $0.4 million in 2010 due interest on acquisition related payables and outstanding debt duringthe year.
Loss on Sales/Impairment of assets, Net
Loss on Sales/Impairment of assets, net increased to $0.4 million loss for the year ended December 31,2011 compared to $0.1 million loss in 2010. The Company recognized an impairment on software relatedto terminated projects for approximately $0.5 million in 2011.
Taxes
The Company’s effective tax rate was 37.5% in 2011 compared to 37.3% in 2010, due primarily todifference in state tax rates.
25
Results of Operations—2010 Versus 2009
Overview
The Company’s gross margin remained flat at 48.7% for 2010 and 2009. Sales, general and administrativeexpense showed an improvement in 2010 lowering to 32.8% of revenue versus 33.1% in 2009. TheCompany experienced a reduction in its depreciation and amortization margin to 3.2% in 2010 versus 3.5%in 2009, due to amortization of intangible assets of several older acquisitions being fully amortized. TheCompany had net income of $90.0 million compared to $84.0 million in 2009, a 7.2% increase. Net profitmargin improved to 7.9% in 2010 from 7.8% in 2009.
Revenues
Revenues for the year ended December 31, 2010 were $1.137 billion, an increase of $62.9 million or 5.9%from 2009 revenues of $1.074 billion. Commercial pest control represented approximately 42.0% of theCompany’s business in 2010 and grew 6.9% in 2010 due to increases in sales and improved retention.Residential pest control represented approximately 39.0% of the Company’s business and increased 5.5%driven by increased leads, closure and pricing. The Company’s termite business, which representedapproximately 19.0% of the Company’s revenue, grew 3.5% in 2010 due to increases in ancillary servicessales as well as the Company’s expanded sales force.
The Company’s foreign operations accounted for approximately 8% and 7% of total revenues for the yearsended December 31, 2010 and 2009, respectively. The Company established new franchises in Jamaica,Ireland and Turkey for a total of sixteen international franchises at December 31, 2010. Orkin had 72 and65 total domestic and international franchises at December 31, 2010 and 2009, respectively.
Cost of Services Provided
For the twelve months ended December 31, 2010 cost of services provided increased $32.1 million or 5.8%,compared to the twelve months ended December 31, 2009. Gross margins for the year remained flat at48.7% for 2010 and 2009. Overall reductions in insurance and risk related costs as well as service salarieswere offset by increased cost of fuel as well as higher personnel related costs, primarily health costs andemployment taxes.
Depreciation and Amortization
For the twelve months ended December 31, 2010, depreciation and amortization decreased $0.8 million, or2.0% compared to the twelve months ended December 31, 2009. The decrease is due to amortization ofintangible assets acquired related to several older acquisitions by Orkin becoming fully amortized, partiallyoffset by additional intangible asset amortization associated with the acquisition of Waltham Services andother smaller acquisitions.
Sales, General and Administrative
For the twelve months ended December 31, 2010, sales, general and administrative expenses increased$17.7 million, or 5.0% compared to the twelve months ended December 31, 2009 representing 32.8% ofrevenues compared to 33.1% of revenues in the prior year. The increase in total dollars primarily reflectshigher personnel related cost due to higher health insurance expense, employment taxes, sales cost andconsulting work while advertising and promotion costs declined. Overall costs rose at a lesser rate thanrevenue, reducing the costs as a percent of revenue.
26
Interest Expense, Net
Interest expense, net for the year ended December 31, 2010 was a $0.4 million, a decrease of $0.5 millioncompared to $1.0 million in 2009 due to average debt outstanding over the full year being less than theprior year and an increase in cash on hand.
Loss on Sales/Impairment of assets, Net
Loss on Sales/Impairment of assets, net improved to $0.1 million loss for the year ended December 31,2010 compared to $2.9 million loss in 2009 due to an impairment of assets charge of $2.9 million attributedto a write down of the Company’s routing and scheduling initiative in 2009.
Taxes
The Company’s effective tax rate was 37.3% in 2010 compared to 33.5% in 2009. The reduced rate in 2009was due to a tax benefit by converting several of Rollins, Inc.’s wholly-owned subsidiaries from Ccorporations to limited liability companies partially offset by taxes on repatriation of Canadian cash to theUnited States from Orkin, Inc.’s wholly-owned subsidiary Orkin Canada.
Liquidity and Capital Resources
Cash and Cash Flow
The Company’s cash and cash equivalents at December 31, 2011, 2010, and 2009 were $46.3 million,$20.9 million and $9.5 million, respectively.
Years ended December 31,(in thousands) 2011 2010 2009
Net cash provided by operating activities $ 154,647 $ 124,053 $ 110,846Net cash used in investing activities (29,154) (47,645) (26,562)Net cash provided by (used in) financing activities (99,427) (65,497) (89,753)Effect of exchange rate changes on cash (704) 498 1,257
Net increase/(decrease) in cash and cash equivalents $ 25,362 $ 11,409 $ (4,212)
The Company’s operations generated cash of $154.6 million for the year ended December 31, 2011primarily from net income of $100.7 million, compared with cash provided by operating activities of$124.1 million in 2010 and $110.8 million in 2009. The Company believes its current cash and cashequivalents balances, future cash flows expected to be generated from operating activities and availableborrowings under its $175.0 million credit facility will be sufficient to finance its current operations andobligations, and fund expansion of the business for the foreseeable future.
The Company made contributions totaling $4.9 million to the Rollins, Inc. and its wholly-ownedsubsidiaries defined benefit retirement plans (the ‘‘Plans’’) during the year ended December 31, 2011 and$5.2 million and $5.0 million during the years ended December 31, 2010 and 2009, respectively, as a resultof the Plans’ funding status. The Company is considering making contributions to its Plans ofapproximately $5.0 million during fiscal 2012. In the opinion of management, additional Plan contributionswill not have a material effect on the Company’s financial position, results of operations or liquidity.
The Company used $29.2 million on investing activities for the year ended December 31, 2011 compared to$47.6 million and $26.6 million during 2010 and 2009, respectively, and of that, invested approximately$18.7 million in capital expenditures during the 2011 compared to $13.0 million and $15.7 million during2010 and 2009, respectively. Capital expenditures for the year consisted primarily of equipmentreplacements and technology related projects. The Company expects to invest between $15.0 million and$20.0 million in 2012 in capital expenditures. During 2011, the Company’s subsidiaries acquired several
27
small companies totaling $11.4 million compared to $34.8 million in acquisitions during 2010 and$11.0 million in 2009. The expenditures for the Company’s acquisitions were primarily funded by cash onhand and borrowings under a senior unsecured revolving credit facility. The Company continues to seeknew acquisitions.
The Company used cash of $99.4 million on financing activities for the year ended December 31, 2011. Atotal of $41.1 million was paid in cash dividends ($0.28 per share) during the year ended December 31,2011, compared to $35.5 million ($0.24 per share) during the year ended December 31, 2010 and$27.9 million ($0.1867 per share) in 2009. The Company used $30.2 million to repurchase 1.5 millionshares of its common stock on the open market at a weighted average price of $18.68 per share during 2011compared to $29.7 million to purchase 1.9 million shares at an average price of $13.95 in 2010 and$29.1 million to purchase 2.5 million shares at a weighted average price of $11.02 in 2009. There are1.1 million shares authorized remaining to be repurchased under prior Board approval.
On March 28, 2008, the Company entered into a Revolving Credit Agreement with SunTrust Bank andBank of America, N.A. for an unsecured line of credit of up to $175.0 million, which includes a$75.0 million letter of credit subfacility, and a $10.0 million swingline subfacility. As of December 31, 2011,no borrowings were outstanding under the line of credit or under the swingline subfacility. The Companymaintains approximately $31.3 million in letters of credit. These letters of credit are required by theCompany’s fronting insurance companies and/or certain states, due to the Company’s self-insured status,to secure various workers’ compensation and casualty insurance contracts coverage. The Company believesthat it has adequate liquid assets, funding sources and insurance accruals to accommodate such claims.
The Revolving Credit Agreement is guaranteed by Rollins’ domestic subsidiaries. The maturity date of theCredit Agreement is March 27, 2013. Revolving loans under the Revolving Credit Agreement bear interestat one of the following two rates, at the Company’s election:
• the Base Rate, which is the highest of SunTrust Bank’s ‘‘prime rate’’ for the day of the borrowing, afluctuating rate per annum equal to the Federal Funds Rate plus 0.50% or the Adjusted LIBORRate determined on a daily basis for an interest period of one month; or
• with respect to any Eurodollar borrowings, Adjusted LIBOR (which equals LIBOR as increased toaccount for the maximum reserve percentages established by the U.S. Federal Reserve) plus anadditional amount, which varies between .50% and .75%, based upon Rollins’ then-currentdebt-to-EBITDA ratio. As of December 31, 2011, the additional rate allocated was .50%.
The Revolving Credit Agreement contains customary terms and conditions, including, without limitation,certain financial covenants including covenants restricting the Company’s ability to incur certainindebtedness or liens, or to merge or consolidate with or sell substantially all of its assets to another entity.Further, the Revolving Credit Agreement contains financial covenants restricting the Company’s ability topermit the ratio of the Company’s consolidated debt to EBITDA to exceed certain limits.
The Company remained in compliance with applicable debt covenants at December 31, 2011 and expectsto maintain compliance throughout 2012.
Litigation
For discussion on the Company’s legal contingencies, see note 12 to the accompanying financialstatements.
28
Off Balance Sheet Arrangements, Contractual Obligations and Contingent Liabilities and Commitments
Other than the operating leases disclosed in the table that follows, the Company has no material offbalance sheet arrangements.
The impact that the Company’s contractual obligations as of December 31, 2011 are expected to have onour liquidity and cash flow in future periods is as follows:
Payments due by periodLess than 1 - 3 4 - 5 More than
Contractual obligations (in thousands) Total 1 year years years 5 years
Business combination related liabilities $ 6,744 $ 3,704 $ 3,022 $ 18 $ —Non-cancelable operating leases 83,185 31,878 38,442 11,660 1,205Unrecognized Tax Positions (1) 1,264 1,264 — — —
Total (2) $ 91,193 $ 36,846 $ 41,464 $ 11,678 $ 1,205
(1) These amounts represent expected payments with interest for unrecognized tax benefits as ofDecember 31, 2011. Uncertain tax positions of $0.7 million are not included due to the uncertainty ofthe final amount and settlement.
(2) Minimum pension funding requirements are not included as funding will not be required. TheCompany is considering making contributions to its pension plans of approximately $5.0 millionduring 2012.
Critical Accounting Policies
The Company views critical accounting policies to be those policies that are very important to the portrayalof our financial condition and results of operations, and that require management’s most difficult, complexor subjective judgments. The circumstances that make these judgments difficult or complex relate to theneed for management to make estimates about the effect of matters that are inherently uncertain. Webelieve our critical accounting policies to be as follows:
Accrual for Termite Contracts—The Company maintains an accrual for termite claims representing theestimated costs of reapplications, repairs and associated labor and chemicals, settlements, awards andother costs relative to termite control services. Factors that may impact future cost include termiticide lifeexpectancy and government regulation. It is significant that the actual number of claims has decreased inrecent years due to changes in the Company’s business practices. However, it is not possible to preciselypredict future significant claims. Accrual for termite contracts are included in other current liabilities andlong-term accrued liabilities on the Company’s consolidated statements of financial position.
Accrued Insurance—The Company self-insures, up to specified limits, certain risks related to general liability,workers’ compensation and vehicle liability. The estimated costs of existing and future claims under theself-insurance program are accrued based upon historical trends as incidents occur, whether reported orunreported (although actual settlement of the claims may not be made until future periods) and may besubsequently revised based on developments relating to such claims. The Company contracts anindependent third party actuary on a semi-annual basis to provide the Company an estimated liabilitybased upon historical claims information. The actuarial study is a major consideration, along withmanagement’s knowledge of changes in business practice and existing claims compared to currentbalances. The reserve is established based on all these factors. Management’s judgment is inherentlysubjective and a number of factors are outside management’s knowledge and control. Additionally,historical information is not always an accurate indication of future events. The Company continues to beproactive in risk management to develop and maintain ongoing programs to reduce claims. Initiatives thathave been implemented include pre-employment screening and an annual motor vehicle report required
29
on all its drivers, post-offer physicals for new employees, and pre-hire, random and post-accident drugtesting. The Company has improved the time required to report a claim by utilizing a ‘‘Red Alert’’ programthat provides serious accident assessment twenty four hours a day and seven days a week and has instituteda modified duty program that enables employees to go back to work on a limited-duty basis.
Revenue Recognition—The Company’s revenue recognition policies are designed to recognize revenues at thetime services are performed. For certain revenue types, because of the timing of billing and the receipt ofcash versus the timing of performing services, certain accounting estimates are utilized. Residential andcommercial pest control services are primarily recurring in nature on a monthly, bi-monthly or quarterlybasis, while certain types of commercial customers may receive multiple treatments within a given month.In general, pest control customers sign an initial one-year contract, and revenues are recognized at thetime services are performed. For pest control customers, the Company offers a discount for thosecustomers who prepay for a full year of services. The Company defers recognition of these advancepayments and recognizes the revenue as the services are rendered. The Company classifies the discountsrelated to the advance payments as a reduction in revenues. Termite baiting revenues are recognized basedon the delivery of the individual units of accounting. At the inception of a new baiting services contractupon quality control review of the installation, the Company recognizes revenue for the installation of themonitoring stations, initial directed liquid termiticide treatment and servicing of the monitoring services. Aportion of the contract amount is deferred for the undelivered monitoring element. This portion isrecognized as income on a straight-line basis over the remaining contract term, which results in recognitionof revenue in a pattern that approximates the timing of performing monitoring visits. The allocation of thepurchase price to the two deliverables is based on the relative selling price. There are no contingenciesrelated to the delivery of additional items or meeting other specified performance conditions. Baitingrenewal revenue is deferred and recognized over the annual contract period on a straight-line basis thatapproximates the timing of performing the required monitoring visits.
Revenue received for termite renewals is deferred and recognized on a straight-line basis over theremaining contract term; and, the cost of reinspections, reapplications and repairs and associated laborand chemicals are expensed as incurred. For outstanding claims, an estimate is made of the costs to beincurred (including legal costs) based upon current factors and historical information. The performance ofreinspections tends to be close to the contract renewal date and while reapplications and repairs involve aninsubstantial number of the contracts, these costs are incurred over the contract term. As the revenue isbeing deferred, the future cost of reinspections, reapplications and repairs and associated labor andchemicals applicable to the deferred revenue are expensed as incurred. The Company accrues for noticedclaims. The costs of providing termite services upon renewal are compared to the expected revenue to bereceived and a provision is made for any expected losses.
All revenues are reported net of sales taxes.
Contingency Accruals—The Company is a party to legal proceedings with respect to matters in the ordinarycourse of business. In accordance with FASB ASC Topic 450 ‘‘Contingencies,’’ the Company estimates andaccrues for its liability and costs associated with the litigation. Estimates and accruals are determined inconsultation with outside counsel. Because it is not possible to accurately predict the ultimate result of thelitigation, judgments concerning accruals for liabilities and costs associated with litigation are inherentlyuncertain and actual liabilities may vary from amounts estimated or accrued. However, in the opinion ofmanagement, the outcome of the litigation will not have a material adverse impact on the Company’sfinancial condition or results of operations. Contingency accruals are included in other current liabilitiesand long-term accrued liabilities on the Company’s consolidated statements of financial position.
Defined benefit pension plans—In 2002, the Company ceased all future benefit accruals under the Rollins, Inc.defined benefit plan, although the Company remains obligated to provide employees benefits earnedthrough March 2002. The Company has other smaller pension plans related to acquisitions included innote 13 to the Company’s financial statements. The Company accounts for these defined benefit plans in
30
accordance with FASB ASC Topic 715 ‘‘Compensation-Retirement Benefits,’’ and engages an outside actuaryto calculate its obligations and costs. With the assistance of the actuary, the Company evaluates thesignificant assumptions used on a periodic basis including the estimated future return on plan assets, thediscount rate, and other factors, and makes adjustments to these liabilities as necessary.
The Company chooses an expected rate of return on plan assets based on historical results for similarallocations among asset classes, the investments strategy, and the views of our investment adviser.Differences between the expected long-term return on plan assets and the actual return are amortized overfuture years. Therefore, the net deferral of past asset gains (losses) ultimately affects future pensionexpense. The Company’s assumption for the expected return on plan assets is 7% which is unchanged fromthe prior year.
The discount rate reflects the current rate at which the pension liabilities could be effectively settled at theend of the year. In estimating this rate, the Company utilizes a yield curve approach. The approach utilizesan economic model whereby the Company’s expected benefit payments over the life of the plans isforecasted and then compared to a portfolio of corporate bonds that will mature at the same time that thebenefit payments are due in any given year. The economic model then calculates the one discount rate toapply to all benefit payments over the life of the plan which will result in the same total lump sum as thepayments from the corporate bonds. The discount rate was 5.01% as of December 31, 2011 compared to5.51% in 2010 and 6.01% in 2009. A lower discount rate increases the present value of benefit obligation.
As set forth in note 13 to the Company’s financial statements, included among the asset categories for thePlan’s investments are real estate, tactical composite and alternative investments comprised of investmentsin real estate and hedge funds. These investments are categorized as level 3 investments and are valuedusing significant non-observable inputs which do not have a readily determinable fair value. In accordancewith ASU No. 2009-12 ‘‘Investments In Certain Entities That Calculate Net Asset Value per Share (Or ItsEquivalent),’’ these investments are valued based on the net asset value per share calculated by the funds inwhich the plan has invested. These valuations are subject to judgments and assumptions of the funds whichmay prove to be incorrect, resulting in risks of incorrect valuation of these investments. The Companyseeks to mitigate against these risks by evaluating the appropriateness of the funds’ judgments andassumptions by reviewing the financial data included in the funds’ financial statements for reasonableness.
As of December 31, 2011, the defined benefit plans were under-funded and the recorded change withinaccumulated other comprehensive income increased stockholders’ equity by $24.4 million before tax and$14.9 million after tax.
New Accounting Standards
Recently issued accounting standards to be adopted in 2012
In October 2009, the FASB issued Accounting Standards Update (‘‘ASU’’) No. 2009-13, Multiple-Deliverable Revenue Arrangements, or ‘‘ASU 2009-13.’’ ASU 2009-13 establishes the accounting andreporting guidance for arrangements that include multiple revenue-generating activities, and providesamendments to the criteria for separating deliverables, and measuring and allocating arrangementconsideration to one or more units of accounting. The amendments in ASU 2009-13 also establish ahierarchy for determining the selling price of a deliverable. Enhanced disclosures are also required toprovide information about a vendor’s multiple-deliverable revenue arrangements, including informationabout the nature and terms of the arrangement, significant deliverables, and the vendor’s performancewithin arrangements. The amendments also require providing information about the significant judgmentsmade and changes to those judgments and about how the application of the relative selling-price methodaffects the timing or amount of revenue recognition. The amendments in ASU 2009-13 are effectiveprospectively for revenue arrangements entered into or materially modified in fiscal years beginning on orafter June 15, 2010, or January 1, 2011 for us. The adoption of ASU 2009-13 did not have a material impacton our financial position or results of operations.
31
In September 2011, the FASB issued ASU 2011-08 which provides an entity the option to first assessqualitative factors to determine whether it is necessary to perform the current two-step test for goodwillimpairment. If an entity believes, as a result of its qualitative assessment, that it is more-likely-than-notthat the fair value of a reporting unit is less than its carrying amount, the quantitative impairment test isrequired. Otherwise, no further testing is required. The revised standard is effective for annual and interimgoodwill impairment tests performed for fiscal years beginning after December 15, 2011. However, anentity can choose to early adopt even if its annual test date is before the issuance of the final standard,provided that the entity has not yet performed its 2011 annual impairment test or issued its financialstatements. The adoption of this ASU is not expected to significantly impact our consolidated financialstatements.
In December 2011, the FASB issued an Accounting Standards Update (‘‘ASU’’) Disclosures about OffsettingAssets and Liabilities (‘‘ASU 2011-11’’) to Topic 210, Balance Sheet. The update requires new disclosuresabout balance sheet offsetting and related arrangements. For derivatives and financial assets and liabilities,the amendments require disclosure of gross asset and liability amounts, amounts offset on the balancesheet, and amounts subject to the offsetting requirements but not offset on the balance sheet. Theguidance is effective December 1, 2013 and is to be applied retrospectively. This guidance does not amendthe existing guidance on when it is appropriate to offset; as a result, we do not expect this guidance to havea material effect on our financial statements.
In June 2011, the Financial Accounting Standards Board (‘‘FASB’’) issued Accounting Standards UpdateNo. 2011-05, Presentation of Comprehensive Income (ASU 2011-05). This standard eliminated the optionto report other comprehensive income and its components in the statement of changes in equity. Underthis standard, an entity can elect to present items of net income and other comprehensive income in onecontinuous statement—referred to as the statement of comprehensive income—or in two separate, butconsecutive, statements. In December 2011, the FASB issued Accounting Standards Update No. 2011-12,Deferral of the Effective Date for Amendments to the Presentation of Reclassifications of Items Out ofAccumulated Other Comprehensive Income in Accounting Standards Update No. 2011-05 (ASU 2011-12).ASU 2011-12 defers the effective date of the requirement in ASU 2011-05 to disclose on the face of thefinancial statements the effects of reclassifications out of accumulated other comprehensive income on thecomponents of net income and other comprehensive income. All other requirements of ASU 2011-05 arenot affected by ASU 2011-12. The Company adopted ASU 2011-05 effective December 31, 2011 anddeferred certain disclosures as allowed under ASU 2011-12. ASU 2011-05 did not have a material impacton the Company’s consolidated financial position, results of operations, or cash flows. The expiration ofdeferral allowed by ASU 2011-12 is not expected to have a significant effect on our consolidated financialstatements.
Forward-Looking Statements
This Annual Report contains forward-looking statements within the meaning of the Private SecuritiesLitigation Reform Act of 1995. Such forward-looking statements include statements regarding theCompany’s belief that its levels of supplies will alleviate the potential short-term shortage in availabilityfrom its suppliers; management’s belief that environmental remediation costs estimated to be incurred arenot material to the Company’s financial condition or operating results; the outcome of litigation, asdiscussed in the Legal Proceedings section and elsewhere, and the Company’s belief that such litigationwill not have a material adverse effect on the Company’s financial condition, results of operations orliquidity; the Company’s expectation to continue its payment of cash dividends; the adequacy of theCompany’s resources and borrowings to fund operations and obligations; management’s belief that anyadditional pension plan contributions will not have a material effect on the Company’s financial position,results of operation or liquidity; the Company’s projected 2012 capital expenditures; the Company’sexpectation to maintain compliance with the covenants contained in its Revolving Credit Agreementthroughout 2012; the impact and amount of the Company’s contractual obligations; the impact of recent
32
accounting pronouncements; and interest rate risks and foreign exchange currency risk on the Company’sfinancial position, results of operations and liquidity. The actual results of the Company could differmaterially from those indicated by the forward-looking statements because of various risks, timing anduncertainties including, without limitation, the possibility of an adverse ruling against the Company inpending litigation; general economic conditions; market risk; changes in industry practices or technologies;the degree of success of the Company’s termite process reforms and pest control selling and treatmentmethods; the Company’s ability to identify potential acquisitions; climate and weather trends; competitivefactors and pricing practices; potential increases in labor costs; and changes in various government lawsand regulations, including environmental regulations. All of the foregoing risks and uncertainties arebeyond the ability of the Company to control, and in many cases the Company cannot predict the risks anduncertainties that could cause its actual results to differ materially from those indicated by the forward-looking statements.
Item 7A. Quantitative and Qualitative Disclosures about Market Risk.
Market Risk
The Company maintains an investment portfolio subject to short-term interest rate risk exposure. TheCompany is also subject to interest rate risk exposure through borrowings on its $175 million credit facility.Currently, the Company has no outstanding borrowings. However, the Company does maintainapproximately $31.3 million in Letters of Credit. The Company is also exposed to market risks arising fromchanges in foreign exchange rates. The Company believes that this foreign exchange rate risk will not havea material effect upon the Company’s results of operations or financial position going forward.
33
MANAGEMENT’S REPORT ON INTERNAL CONTROLS OVER FINANCIAL REPORTING
To the Stockholders of Rollins, Inc.:
The management of Rollins, Inc. is responsible for establishing and maintaining adequate internal controlover financial reporting for the Company. Rollins, Inc. maintains a system of internal accounting controlsdesigned to provide reasonable assurance, at a reasonable cost, that assets are safeguarded against loss orunauthorized use and that the financial records are adequate and can be relied upon to produce financialstatements in accordance with accounting principles generally accepted in the United States of America.The internal control system is augmented by written policies and procedures, an internal audit programand the selection and training of qualified personnel. This system includes policies that require adherenceto ethical business standards and compliance with all applicable laws and regulations.
Under the supervision and with the participation of our management, including our principal executiveofficer and principal financial officer, we conducted an evaluation of the effectiveness of the design andoperation of internal controls over financial reporting, as of December 31, 2011 based on criteriaestablished in Internal Control—Integrated framework issued by the Committee of SponsoringOrganizations of the Treadway Commission. Based on this evaluation, management’s assessment is thatRollins, Inc. maintained effective internal control over financial reporting as of December 31, 2011.
The independent registered public accounting firm, Grant Thornton LLP has audited the consolidatedfinancial statements as of and for the year ended December 31, 2011, and has also issued their report onthe effectiveness of the Company’s internal control over financial reporting, included in this report onpage 35.
/s/ GARY W. ROLLINS /s/ HARRY J. CYNKUS
Gary W. Rollins Harry J. CynkusChief Executive Officer, President and Senior Vice President, Chief Financial OfficerChief Operating Officer and Treasurer
Atlanta, GeorgiaFebruary 28, 2012
34
REPORT OF INDEPENDENT REGISTERED PUBLIC ACCOUNTING FIRM ON INTERNALCONTROL OVER FINANCIAL REPORTING
Board of Directors and ShareholdersRollins, Inc.
We have audited Rollins, Inc. (a Delaware Corporation) and subsidiaries’ (the ‘‘Company’’) internalcontrol over financial reporting as of December 31, 2011, based on criteria established in InternalControl—Integrated Framework issued by the Committee of Sponsoring Organizations of the TreadwayCommission (COSO). The Company’s management is responsible for maintaining effective internalcontrol over financial reporting and for its assessment of the effectiveness of internal control over financialreporting, included in the accompanying Management’s Report on Internal Controls over FinancialReporting. Our responsibility is to express an opinion on the Company’s internal control over financialreporting based on our audit.
We conducted our audit in accordance with the standards of the Public Company Accounting OversightBoard (United States). Those standards require that we plan and perform the audit to obtain reasonableassurance about whether effective internal control over financial reporting was maintained in all materialrespects. Our audit included obtaining an understanding of internal control over financial reporting,assessing the risk that a material weakness exists, testing and evaluating the design and operatingeffectiveness of internal control based on the assessed risk, and performing such other procedures as weconsidered necessary in the circumstances. We believe that our audit provides a reasonable basis for ouropinion.
A company’s internal control over financial reporting is a process designed to provide reasonableassurance regarding the reliability of financial reporting and the preparation of financial statements forexternal purposes in accordance with generally accepted accounting principles. A company’s internalcontrol over financial reporting includes those policies and procedures that (1) pertain to the maintenanceof records that, in reasonable detail, accurately and fairly reflect the transactions and dispositions of theassets of the company; (2) provide reasonable assurance that transactions are recorded as necessary topermit preparation of financial statements in accordance with generally accepted accounting principles,and that receipts and expenditures of the company are being made only in accordance with authorizationsof management and directors of the company; and (3) provide reasonable assurance regarding preventionor timely detection of unauthorized acquisition, use, or disposition of the company’s assets that could havea material effect on the financial statements.
Because of its inherent limitations, internal control over financial reporting may not prevent or detectmisstatements. Also, projections of any evaluation of effectiveness to future periods are subject to the riskthat controls may become inadequate because of changes in conditions, or that the degree of compliancewith the policies or procedures may deteriorate.
In our opinion, Rollins, Inc. and subsidiaries maintained, in all material respects, effective internal controlover financial reporting as of December 31, 2011, based on criteria established in Internal Control—Integrated Framework issued by COSO.
We also have audited, in accordance with the standards of the Public Company Accounting OversightBoard (United States), the consolidated statements of financial position of Rollins, Inc. and subsidiaries asof December 31, 2011 and 2010, and the related consolidated statements of income, comprehensiveearnings, stockholder’s equity and cash flows for each of the three years in the period ended December 31,2011 and our report dated February 28, 2012 expressed an unqualified opinion on those financialstatements.
/s/ GRANT THORNTON LLP
Atlanta, GeorgiaFebruary 28, 2012
35
REPORT OF INDEPENDENT REGISTERED PUBLIC ACCOUNTING FIRM ONCONSOLIDATED FINANCIAL STATEMENTS AND SCHEDULE
Board of Directors and Shareholders Rollins, Inc.
We have audited the accompanying consolidated statements of financial position of Rollins, Inc. (aDelaware corporation) and subsidiaries (the ‘‘Company’’) as of December 31, 2011 and 2010, and therelated consolidated statements of income, comprehensive earnings, stockholders’ equity, and cash flowsfor each of the three years in the period ended December 31, 2011. Our audits of the basic consolidatedfinancial statements included the financial statement schedule listed in the index appearing under Item 15.These financial statements and the financial statement schedule are the responsibility of the Company’smanagement. Our responsibility is to express an opinion on these financial statements and financialstatement schedule based on our audits.
We conducted our audits in accordance with the standards of the Public Company Accounting OversightBoard (United States). Those standards require that we plan and perform the audit to obtain reasonableassurance about whether the financial statements are free of material misstatement. An audit includesexamining, on a test basis, evidence supporting the amounts and disclosures in the financial statements. Anaudit also includes assessing the accounting principles used and significant estimates made bymanagement, as well as evaluating the overall financial statement presentation. We believe that our auditsprovide a reasonable basis for our opinion.
In our opinion, the consolidated financial statements referred to above present fairly, in all materialrespects, the financial position of Rollins, Inc. and subsidiaries as of December 31, 2011 and 2010, and theresults of their operations and their cash flows for each of the three years in the period endedDecember 31, 2011 in conformity with accounting principles generally accepted in the United States ofAmerica. Also in our opinion, the related financial statement schedule, when considered in relation to thebasic consolidated financial statements taken as a whole, presents fairly, in all material respects, theinformation set forth therein.
We also have audited, in accordance with the standards of the Public Company Accounting OversightBoard (United States), the Company’s internal control over financial reporting as of December 31, 2011,based on criteria established in Internal Control—Integrated Framework issued by the Committee ofSponsoring Organizations of the Treadway Commission (COSO) and our report dated February 28, 2012expressed an unqualified opinion.
/s/ GRANT THORNTON LLP
Atlanta, GeorgiaFebruary 28, 2012
36
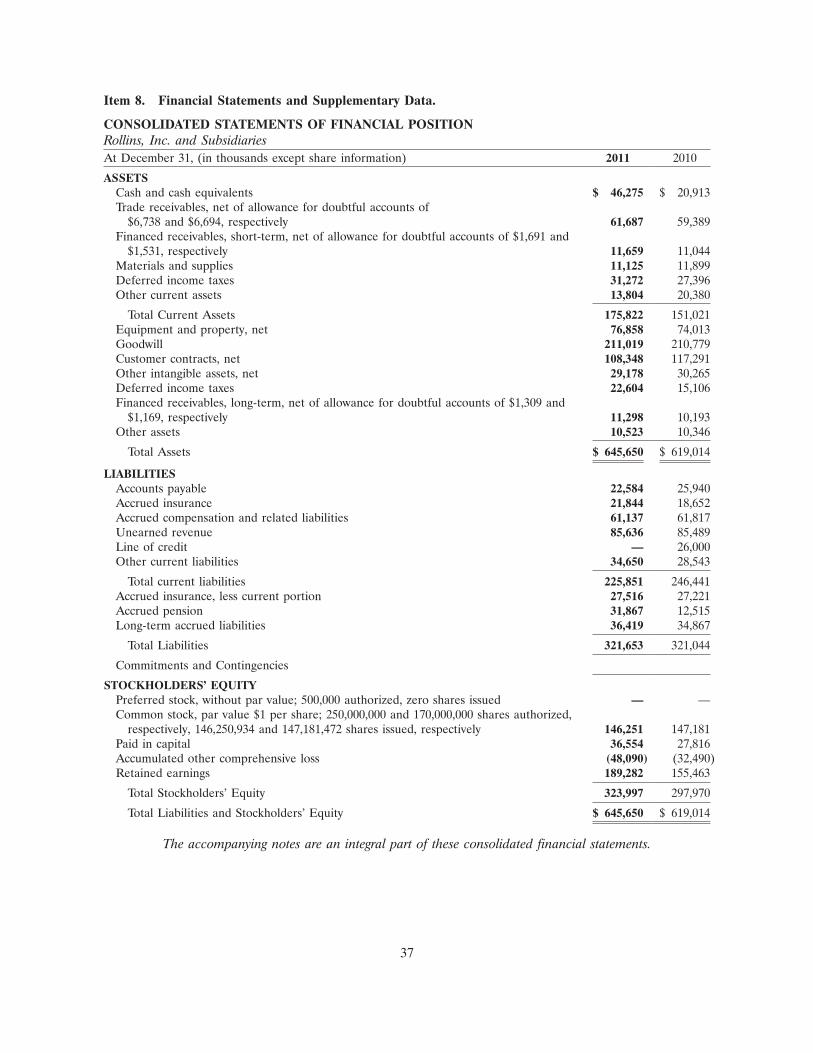
Item 8. Financial Statements and Supplementary Data.
CONSOLIDATED STATEMENTS OF FINANCIAL POSITIONRollins, Inc. and SubsidiariesAt December 31, (in thousands except share information) 2011 2010
ASSETSCash and cash equivalents $ 46,275 $ 20,913Trade receivables, net of allowance for doubtful accounts of
$6,738 and $6,694, respectively 61,687 59,389Financed receivables, short-term, net of allowance for doubtful accounts of $1,691 and
$1,531, respectively 11,659 11,044Materials and supplies 11,125 11,899Deferred income taxes 31,272 27,396Other current assets 13,804 20,380
Total Current Assets 175,822 151,021Equipment and property, net 76,858 74,013Goodwill 211,019 210,779Customer contracts, net 108,348 117,291Other intangible assets, net 29,178 30,265Deferred income taxes 22,604 15,106Financed receivables, long-term, net of allowance for doubtful accounts of $1,309 and
$1,169, respectively 11,298 10,193Other assets 10,523 10,346
Total Assets $ 645,650 $ 619,014
LIABILITIESAccounts payable 22,584 25,940Accrued insurance 21,844 18,652Accrued compensation and related liabilities 61,137 61,817Unearned revenue 85,636 85,489Line of credit — 26,000Other current liabilities 34,650 28,543
Total current liabilities 225,851 246,441Accrued insurance, less current portion 27,516 27,221Accrued pension 31,867 12,515Long-term accrued liabilities 36,419 34,867
Total Liabilities 321,653 321,044
Commitments and Contingencies
STOCKHOLDERS’ EQUITYPreferred stock, without par value; 500,000 authorized, zero shares issued — —Common stock, par value $1 per share; 250,000,000 and 170,000,000 shares authorized,
respectively, 146,250,934 and 147,181,472 shares issued, respectively 146,251 147,181Paid in capital 36,554 27,816Accumulated other comprehensive loss (48,090) (32,490)Retained earnings 189,282 155,463
Total Stockholders’ Equity 323,997 297,970
Total Liabilities and Stockholders’ Equity $ 645,650 $ 619,014
The accompanying notes are an integral part of these consolidated financial statements.
37
CONSOLIDATED STATEMENTS OF INCOMERollins, Inc. and SubsidiariesYears ended December 31, (in thousands except per share data) 2011 2010 2009
REVENUESCustomer services $ 1,205,064 $ 1,136,890 $ 1,073,958
COSTS AND EXPENSESCost of services provided 616,842 583,089 551,002Depreciation and amortization 37,503 36,408 37,169Sales, general and administrative 388,710 373,288 355,590Loss on sales/impairment of assets, net 405 123 2,942Interest expense 508 437 964
1,043,968 993,345 947,667
INCOME BEFORE INCOME TAXES 161,096 143,545 126,291
PROVISION FOR INCOME TAXESCurrent 59,601 51,468 41,873Deferred 784 2,075 434
60,385 53,543 42,307
NET INCOME $ 100,711 $ 90,002 $ 83,984
INCOME PER SHARE – BASIC $ 0.69 $ 0.61 $ 0.56
INCOME PER SHARE – DILUTED $ 0.69 $ 0.61 $ 0.56
Weighted average shares outstanding – basic 146,882 148,030 149,179Weighted average shares outstanding – diluted 146,946 148,231 149,624DIVIDENDS PAID PER SHARE $ 0.28 $ 0.24 $ 0.19
The accompanying notes are an integral part of these consolidated financial statements
38
CONSOLIDATED STATEMENTS OF COMPREHENSIVE EARNINGSRollins, Inc. and SubsidiariesYears ended December 31, (in thousands) 2011 2010 2009
NET INCOME $ 100,711 $ 90,002 $ 83,984
Other comprehensive earnings (loss), net of taxForeign currency translation adjustments (708) 826 2,645Pension and other postretirement benefit plans (14,892) (1,189) (14)
Other comprehensive (loss) earnings (15,600) (363) 2,631
Comprehensive earnings $ 85,111 $ 89,639 $ 86,615
The accompanying notes are an integral part of these consolidated financial statements
39
CONSOLIDATED STATEMENTS OF STOCKHOLDERS’ EQUITYRollins, Inc. and Subsidiaries
AccumulatedOtherCommon Stock Paid- Comprehensive Retained
(In thousands) Shares Amount In-Capital Income (Loss) Earnings Total
Balance at December 31, 2008 150,061 $ 150,061 $ 18,087 $(34,758) $ 95,043 $ 228,433
Net Income 83,984 83,984Other Comprehensive Income, Net of Tax
Pension Liability Adjustment (14) (14)Foreign Currency Translation Adjustments 2,645 2,645
Cash Dividends (27,853) (27,853)Common Stock Purchased (1) (2,516) (2,516) (25,221) (27,737)Stock Compensation 695 695 5,337 (232) 5,800Employee Stock Buybacks and Common Stock Options
Exercised 117 117 (955) (40) (878)Excess Tax Benefit on Restricted Stock, Dividend
Compensation and Non-Qualified Stock Options 186 186
Balance at December 31, 2009 148,357 $ 148,357 $ 22,655 $(32,127) $ 125,681 $ 264,566
Net Income 90,002 90,002Other Comprehensive Income, Net of Tax
Pension Liability Adjustment (1,189) (1,189)Foreign Currency Translation Adjustments 826 — 826
Cash Dividends (35,521) (35,521)Common Stock Purchased (1) (1,889) (1,889) (24,463) (26,352)Stock Compensation 594 594 7,153 (209) 7,538Employee Stock Buybacks and Common Stock Options
Exercised 119 119 (3,177) (27) (3,085)Excess Tax Benefit on Restricted Stock, Dividend
Compensation and Non-Qualified Stock Options 1,185 1,185
Balance at December 31, 2010 147,181 $ 147,181 $ 27,816 $(32,490) $ 155,463 $ 297,970
Net Income 100,711 100,711Other Comprehensive Income, Net of Tax
Pension Liability Adjustment (14,892) (14,892)Foreign Currency Translation Adjustments (708) — (708)
Cash Dividends (41,110) (41,110)Common Stock Purchased (1) (1,458) (1,458) (25,782) (27,240)Stock Compensation 595 595 6,960 — 7,555Employee Stock Buybacks and Common Stock Options
Exercised (67) (67) (2,838) — (2,905)Excess Tax Benefit on Restricted Stock, Dividend
Compensation and Non-Qualified Stock Options 4,616 4,616
Balance at December 31, 2011 146,251 $ 146,251 $ 36,554 $(48,090) $ 189,282 $ 323,997
(1) Charges to Retained Earnings are from purchases of the Company’s Common Stock and its three-for-two stock split effective12/10/2010.
The accompanying notes are an integral part of these consolidated financial statements.
40
CONSOLIDATED STATEMENTS OF CASH FLOWSRollins, Inc. and SubsidiariesYears ended December 31, (in thousands) 2011 2010 2009
OPERATING ACTIVITIESNet Income $ 100,711 $ 90,002 $ 83,984
Adjustments to reconcile net income to net cash provided by operatingactivities:
Depreciation and amortization 37,503 36,408 37,169Provision for deferred income taxes 784 2,075 434Stock based compensation expense 7,555 7,538 5,800Loss on sales/impairments of assets, net 405 123 2,942Excess tax benefits from share-based payments (2,367) (1,185) (186)Provision for bad debts 8,879 8,641 9,638Other, net (762) (844) 126
Changes in assets and liabilities:Trade accounts receivables and other accounts receivables (10,663) (13,977) (10,427)Financed receivables (1,855) (1,097) 534Materials and supplies 837 (1,391) 1,040Other current assets 5,457 (8,197) (2,164)Other non-current assets 1,894 (1,473) (1,407)Accounts payable and accrued expenses 5,695 11,273 (9,898)Unearned revenue (59) (2,516) (2,939)Accrued insurance 3,487 4,398 2,589Accrued pension (4,900) (5,176) (5,000)Long-term accrued liabilities 2,046 (549) (1,389)
Net cash provided by operating activities 154,647 124,053 110,846
INVESTING ACTIVITIESCash used for acquisitions of companies, net of cash acquired (11,410) (34,764) (10,966)Purchase of equipment and property (18,652) (13,036) (15,740)Cash from sales of franchises 149 148 56Proceeds from sales of assets 759 7 88
Net cash used in investing activities (29,154) (47,645) (26,562)
FINANCING ACTIVITIESPayments on line of credit borrowings (26,000) (4,000) (35,000)Cash paid for common stock purchased (30,215) (29,692) (29,108)Dividends paid (41,110) (35,521) (27,853)Book overdrafts in bank accounts (4,500) 2,500 2,000Proceeds received upon exercise of stock options 69 255 493Principal payments on capital lease obligations (38) (224) (471)Excess tax benefits from share-based payments 2,367 1,185 186
Net cash used in financing activities (99,427) (65,497) (89,753)
Effect of exchange rate changes on cash (704) 498 1,257
Net increase/(decrease) in cash and cash equivalents 25,362 11,409 (4,212)Cash and cash equivalents at beginning of year 20,913 9,504 13,716
Cash and cash equivalents at end of year $ 46,275 $ 20,913 $ 9,504
Supplemental disclosure of cash flow informationCash paid for interest $ 123 $ 248 $ 1,031Cash paid for income taxes, net $ 51,983 $ 60,101 $ 46,431
The accompanying notes are an integral part of these consolidated financial statements
41
Supplemental Disclosures of Non-Cash Items
Pension—Non-cash (increases) decreases in the minimum pension liability which were (charged) creditedto other comprehensive income/(loss) were $(24.5) million, $(1.9) million, and $(23) thousand in 2011,2010, and 2009, respectively.
Business Combinations—There were no non-cash acquisition of assets in business combinations for the yearended December 31, 2011 and $8.0 million and $2.6 million for 2010 and 2009, respectively.
NOTES TO CONSOLIDATED FINANCIAL STATEMENTSYears ended December 31, 2011, 2010, and 2009, Rollins, Inc. and Subsidiaries
1. SUMMARY OF SIGNIFICANT ACCOUNTING POLICIES
Business Description—Rollins, Inc. (the ‘‘Company’’) was originally incorporated in 1948 under the laws ofthe state of Delaware as Rollins Broadcasting, Inc.
The Company is an international service company with headquarters located in Atlanta, Georgia,providing pest and termite control services through its wholly-owned subsidiaries to both residential andcommercial customers in North America with domestic franchises and international franchises in CentralAmerica, the Caribbean, the Middle East, Asia, the Mediterranean, Europe and Africa.
Orkin, LLC (‘‘Orkin’’), a wholly-owned subsidiary of the Company founded in 1901, is one of the world’slargest pest and termite control companies. It provides customized services from over 400 locations. Orkinserves customers in the United States, Canada, Central America, the Caribbean, the Middle East, Asia, theMediterranean, Europe and Africa providing essential pest control services and protection against termitedamage, rodents and insects to homes and businesses, including hotels, food service establishments, foodmanufacturers, retailers and transportation companies. Orkin operates under the Orkin�, and OrkinCanada� trademarks and the AcuridSM service mark. The Orkin� brand name makes Orkin the mostrecognized pest and termite company throughout the United States.
Orkin Canada, a wholly-owned subsidiary of Orkin founded in 1952, was acquired by Orkin in 1999. OrkinCanada is Canada’s largest pest control provider and a leader in the development of fast, effective andenvironmentally responsible pest control solutions.
Western Pest Services (‘‘Western’’), a wholly-owned subsidiary of the Company founded in 1928, wasacquired by Rollins, Inc. in 2004. Western is primarily a commercial pest control service company and itsbusiness complements most of the services Orkin offers focusing on the northeastern United States.
The Industrial Fumigant Company (‘‘IFC’’), a wholly-owned subsidiary of the Company founded in 1937,was acquired by Rollins, Inc. in 2005. IFC is a leading provider of pest management and sanitation servicesand products to the food and commodity industries.
HomeTeam Pest Defense (‘‘HomeTeam’’), a wholly-owned subsidiary of the Company established in 1996,was acquired by Rollins, Inc. in April 2008. At the time of the acquisition, HomeTeam, with its uniqueTaexx in the wall system, was recognized as a premier pest control business and ranked as the 4th largestcompany in the industry. HomeTeam services home builders nationally.
The Company has several smaller wholly-owned subsidiaries that in total make up less than 5% of totalrevenues.
The Company has only one reportable segment, its pest and termite control business. Revenue, operatingprofit and identifiable assets for this segment, includes the United States, Canada, Central America, theCaribbean, the Middle East, Asia, the Mediterranean, Europe and Africa. The Company’s results ofoperations and its financial condition are not reliant upon any single customer, few customers or foreignoperations.
42
Principles of Consolidation—The Company’s Consolidated Financial Statements include the accounts ofRollins, Inc. and our wholly-owned subsidiaries and have been prepared in accordance with accountingprinciples generally accepted in the U.S. (‘‘GAAP’’). The Company does not consolidate the financialstatements of any company in which it has an ownership interest of 50% or less. The Company is not theprimary beneficiary of, nor does it have a controlling financial interest in, any variable interest entity.Accordingly, the Company has not consolidated any variable interest entity. The Company reclassifiedcertain prior period amounts, none of which were material, to conform to the current period presentation.All material intercompany accounts and transactions have been eliminated.
Subsequent Events—The Company evaluates its financial statements through the date the financialstatements are issued. As of the filing date, February 28, 2012, there were no subsequent events that wouldaffect its financial statements.
Estimates Used in the Preparation of Consolidated Financial Statements—The preparation of the consolidatedfinancial statements in conformity with accounting principles generally accepted in the United States ofAmerica requires management to make estimates and assumptions that affect the amounts reported in theaccompanying notes and financial statements. Actual results could differ from those estimates.
Revenue Recognition—The Company’s revenue recognition policies are designed to recognize revenues at thetime services are performed. For certain revenue types, because of the timing of billing and the receipt ofcash versus the timing of performing services, certain accounting estimates are utilized. Residential andcommercial pest control services are primarily recurring in nature on a monthly, bi-monthly or quarterlybasis, while certain types of commercial customers may receive multiple treatments within a given month.In general, pest control customers sign an initial one-year contract, and revenues are recognized at thetime services are performed. For pest control customers, the Company offers a discount for thosecustomers who prepay for a full year of services. The Company defers recognition of these advancepayments and recognizes the revenue as the services are rendered. The Company classifies the discountsrelated to the advance payments as a reduction in revenues. Termite baiting revenues are recognized basedon the delivery of the individual units of accounting. At the inception of a new baiting services contractupon quality control review of the installation, the Company recognizes revenue for the installation of themonitoring stations, initial directed liquid termiticide treatment and servicing of the monitoring services. Aportion of the contract amount is deferred for the undelivered monitoring element. This portion isrecognized as income on a straight-line basis over the remaining contract term, which results in recognitionof revenue in a pattern that approximates the timing of performing monitoring visits. The allocation of thepurchase price to the two deliverables is based on the relative selling price. There are no contingenciesrelated to the delivery of additional items or meeting other specified performance conditions. Baitingrenewal revenue is deferred and recognized over the annual contract period on a straight-line basis thatapproximates the timing of performing the required monitoring visits.
Revenue received for termite renewals is deferred and recognized on a straight-line basis over theremaining contract term; and, the cost of reinspections, reapplications and repairs and associated laborand chemicals are expensed as incurred. For outstanding claims, an estimate is made of the costs to beincurred (including legal costs) based upon current factors and historical information. The performance ofreinspections tends to be close to the contract renewal date and while reapplications and repairs involve aninsubstantial number of the contracts, these costs are incurred over the contract term. As the revenue isbeing deferred, the future cost of reinspections, reapplications and repairs and associated labor andchemicals applicable to the deferred revenue are expensed as incurred. The Company accrues for noticedclaims. The costs of providing termite services upon renewal are compared to the expected revenue to bereceived and a provision is made for any expected losses.
All revenues are reported net of sales taxes.
43
The Company’s foreign operations accounted for approximately 8% for the years ended December 31,2011 and 2010 and 7% of total revenues for the year ended December 31, 2009.
Interest income on installment receivables is accrued monthly based on actual loan balances and statedinterest rates. Recognition of initial franchise fee revenues occurs when all material services or conditionsrelating to a new agreement have been substantially performed or satisfied by the Company. Initialfranchise fees are treated as unearned revenue in the Statement of Financial Position until such time.Royalties from Orkin franchises are accrued and recognized as revenues as earned on a monthly basis.Gains on sales of pest control customer accounts to franchises are recognized at the time of sale and whencollection is reasonably assured.
Allowance for Doubtful Accounts—The Company maintains an allowance for doubtful accounts based on theexpected collectability of accounts receivable. Management uses historical collection results as well asaccounts receivable aging in order to determine the expected collectability of accounts receivable.Substantially all of the Company’s receivables are due from pest control and termite services in the UnitedStates and selected international locations. Our allowance for doubtful accounts is determined using acombination of factors to ensure that our receivables are not overstated due to uncollectability. Ourestablished credit evaluation procedures seek to minimize the amount of business we conduct with higherrisk customers. Provisions for doubtful accounts are recorded in selling, general and administrativeexpenses. Accounts are written-off against the allowance for doubtful accounts when the Companydetermines that amounts are uncollectible and recoveries of amounts previously written off are recordedwhen collected. Significant recoveries will generally reduce the required provision in the period ofrecovery. Therefore, the provision for doubtful accounts can fluctuate significantly from period to period.There were no large recoveries in 2011, 2010 and 2009. We record specific provisions when we becomeaware of a customer’s inability to meet its financial obligations to us, such as in the case of bankruptcyfilings or deterioration in the customer’s operating results or financial position. If circumstances related tocustomers change, our estimates of the realizability of receivables would be further adjusted, either upwardor downward.
Advertising—Advertising costs are charged to sales, general and administrative expense during the year inwhich they are incurred.
Years ended December 31,(in thousands) 2011 2010 2009
Advertising $ 46,081 $ 43,119 $ 43,693
Cash and Cash Equivalents—The Company considers all investments with an original maturity of threemonths or less to be cash equivalents. Short-term investments, included in cash and cash equivalents, arestated at cost, which approximates fair market value. At times, cash and cash equivalents may exceedfederally insured amounts.
At December 31,(in thousands) 2011 2010
Cash held in foreign bank accounts $ 24,089 $ 15,219
Marketable Securities—From time to time, the Company maintains investments held by several large,well-capitalized financial institutions. The Company’s investment policy does not allow investment in anysecurities rated less than ‘‘investment grade’’ by national rating services.
Management determines the appropriate classification of debt securities at the time of purchase andre-evaluates such designations as of each balance sheet date. Debt securities are classified asavailable-for-sale because the Company does not have the intent to hold the securities to maturity.
44
Available-for-sale securities are stated at their fair values, with the unrealized gains and losses, net of tax,reported as a separate component of stockholders’ equity. Realized gains and losses and declines in valuejudged to be other than temporary on available-for-sale securities are included as a component of interestincome.
The Company had no marketable securities other than those held in the defined pension benefit plan andthe nonqualified deferred compensation plan at December 31, 2011 and 2010. See note 13 for furtherdetails.
Materials and Supplies—Materials and supplies are recorded at the lower of cost (first-in, first-out basis) ormarket.
Income Taxes—The Company provides for income taxes based on FASB ASC topic 740 ‘‘Income Taxes,’’which requires recognition of deferred tax liabilities and assets for the expected future tax consequences ofevents that have been included in the consolidated financial statements or tax returns. The Companyprovides an allowance for deferred tax assets when it is determined that it is more likely than not that thedeferred tax assets will not be utilized. The Company establishes additional provisions for income taxeswhen, despite the belief that tax positions are fully supportable, there remain some positions that do notmeet the minimum probability threshold. The Company’s policy is to record interest and penalties relatedto income tax matters in income tax expense.
Equipment and Property—Equipment and Property are stated at cost, net of accumulated depreciation, whichincludes the amortization of assets recorded under capital leases and are provided principally on astraight-line basis over the estimated useful lives of the related assets. Annual provisions for depreciationare computed using the following asset lives: buildings, ten to forty years; and furniture, fixtures, andoperating equipment, two to ten years. Expenditures for additions, major renewals and betterments arecapitalized and expenditures for maintenance and repairs are expensed as incurred. The cost of assetsretired or otherwise disposed of and the related accumulated depreciation and amortization are eliminatedfrom the accounts in the year of disposal with the resulting gain or loss credited or charged to income. Theannual provisions for depreciation, below, have been reflected in the Consolidated Statements of Incomein the line item entitled Depreciation and Amortization:
Years ended December 31,(in thousands) 2011 2010 2009
Depreciation $ 15,112 $ 15,975 $ 15,874
Goodwill and Other Intangible Assets—In accordance with FASB ASC Topic 350, ‘‘Intangibles—Goodwill andother,’’ the Company classifies intangible assets into three categories: (1) intangible assets with definitelives subject to amortization; (2) intangible assets with indefinite lives not subject to amortization; and(3) goodwill. The Company does not amortize intangible assets with indefinite lives and goodwill. Goodwilland other intangible assets with indefinite useful lives are tested for impairment annually or morefrequently if events or circumstances indicate the assets might be impaired. Such conditions may include aneconomic downturn or a change in the assessment of future operations. The Company performsimpairment tests of goodwill at the Company level. Such impairment tests for goodwill include comparingthe fair value of the appropriate reporting unit (the Company) with its carrying value. The Companyperforms impairment tests for indefinite-lived intangible assets by comparing the fair value of eachindefinite-lived intangible asset unit to its carrying value. The Company recognizes an impairment charge ifthe asset’s carrying value exceeds its estimated fair value. The Company completed its most recent annualimpairment analyses as of September 30, 2011. Based upon the results of these analyses, the Company hasconcluded that no impairment of its goodwill or other intangible assets was indicated.
45
Impairment of Long-Lived Assets—In accordance with FASB ASC Topic 360, ‘‘Property, Plant and Equipment,’’the Company’s long-lived assets, such as property and equipment and intangible assets with definite livesare reviewed for impairment whenever events or changes in circumstances indicate that the carryingamount of these assets may not be recoverable. Recoverability of assets to be held and used is measured bya comparison of the carrying amount of an asset to estimated undiscounted future cash flows expected tobe generated by the asset. If the carrying amount of an asset exceeds its estimated undiscounted futurecash flows, an impairment charge is recognized in the amount by which the carrying amount of the assetexceeds the fair value of the asset. We periodically evaluate the appropriateness of remaining depreciablelives assigned to long-lived assets, including assets that may be subject to a management plan fordisposition.At December 31, 2009, the Company determined that a significant portion of its routing and schedulinginitiative had no useful value and recognized an impairment of the asset of $2.9 million.
Insurance—The Company self-insures, up to specified limits, certain risks related to general liability,workers’ compensation and vehicle liability. The estimated costs of existing and future claims under theself-insurance program are accrued based upon historical trends as incidents occur, whether reported orunreported (although actual settlement of the claims may not be made until future periods) and may besubsequently revised based on developments relating to such claims. The Company contracts anindependent third party actuary on a semi-annual basis to provide the Company an estimated liabilitybased upon historical claims information. The actuarial study is a major consideration, along withmanagement’s knowledge of changes in business practice and existing claims compared to currentbalances. The reserve is established based on all these factors. Management’s judgment is inherentlysubjective and a number of factors are outside management’s knowledge and control. Additionally,historical information is not always an accurate indication of future events.
Accrual for Termite Contracts—The Company maintains an accrual for termite claims representing theestimated costs of reapplications, repairs and associated labor and chemicals, settlements, awards andother costs relative to termite control services. Factors that may impact future cost include termiticide lifeexpectancy and government regulation. It is significant that the actual number of claims has decreased inrecent years due to changes in the Company’s business practices. However, it is not possible to preciselypredict future significant claims. An accrual for termite contracts are included in other current liabilitiesand long-term accrued liabilities on the Company’s consolidated statements of financial position.
Contingency Accruals—The Company is a party to legal proceedings with respect to matters in the ordinarycourse of business. In accordance with FASB ASC Topic 450 ‘‘Contingencies,’’ the Company estimates andaccrues for its liability and costs associated with the litigation. Estimates and accruals are determined inconsultation with outside counsel. Because it is not possible to accurately predict the ultimate result of thelitigation, judgments concerning accruals for liabilities and costs associated with litigation are inherentlyuncertain and actual liability may vary from amounts estimated or accrued. However, in the opinion ofmanagement, the outcome of the litigation will not have a material adverse impact on the Company’sfinancial condition or results of operations. Contingency accruals are included in other current liabilitiesand long-term accrued liabilities on the Company’s consolidated statements of financial position.
Earnings Per Share—FASB ASC Topic 260-10 ‘‘Earnings Per Share—Overall,’’ requires a basic earnings pershare and diluted earnings per share presentation. Further, all outstanding unvested share-based paymentawards that contain non-forfeitable rights to dividends or dividend equivalents, whether paid or unpaid,are considered participating securities and an entity is required to include participating securities in itscalculation of basic earnings per share.The Company has periodically issued share-based payment awards that contain non-forfeitable rights todividends and therefore are considered participating securities. See note 13 for further information onrestricted stock granted to employees.The basic and diluted calculations differ as a result of the dilutive effect of stock options included indiluted earnings per share, but excluded from basic earnings per share. Basic and diluted earnings pershare are computed by dividing net income by the weighted average number of shares outstanding duringthe respective periods. All share and per share data appearing in the consolidated financial statements andrelated notes have been retroactively adjusted for the three-for-two stock split on December 10, 2010.
46
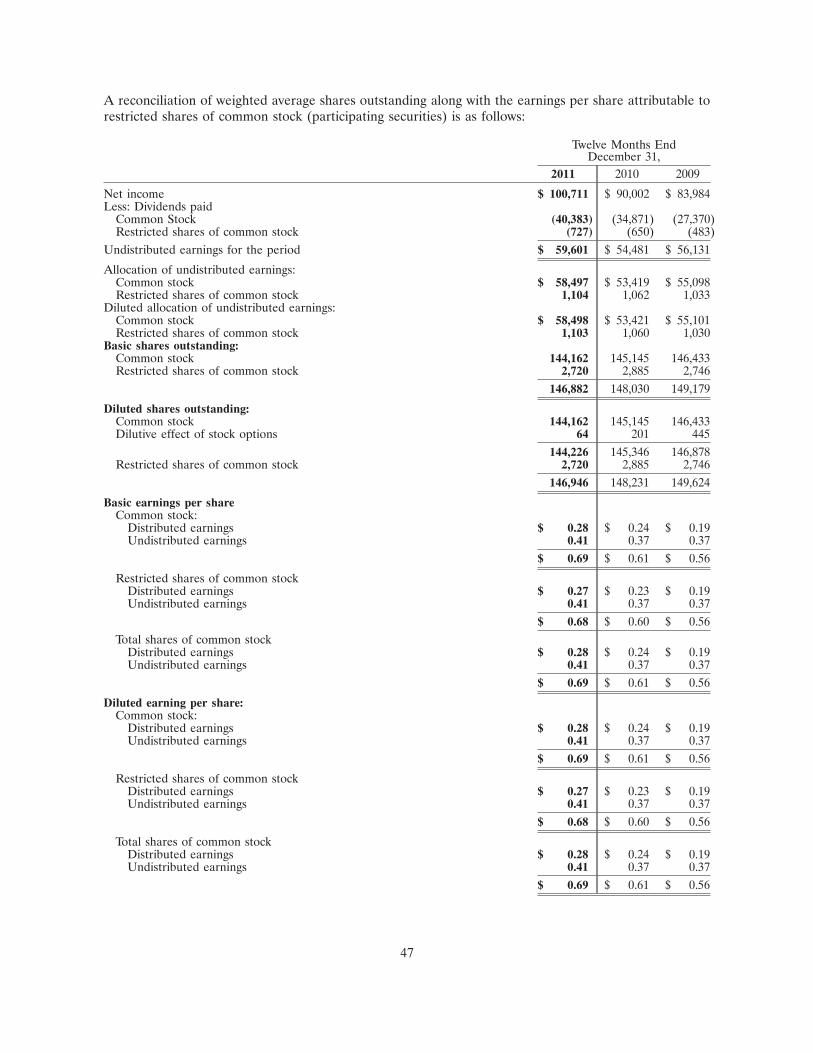
A reconciliation of weighted average shares outstanding along with the earnings per share attributable torestricted shares of common stock (participating securities) is as follows:
Twelve Months EndDecember 31,
2011 2010 2009
Net income $ 100,711 $ 90,002 $ 83,984Less: Dividends paid
Common Stock (40,383) (34,871) (27,370)Restricted shares of common stock (727) (650) (483)
Undistributed earnings for the period $ 59,601 $ 54,481 $ 56,131
Allocation of undistributed earnings:Common stock $ 58,497 $ 53,419 $ 55,098Restricted shares of common stock 1,104 1,062 1,033
Diluted allocation of undistributed earnings:Common stock $ 58,498 $ 53,421 $ 55,101Restricted shares of common stock 1,103 1,060 1,030
Basic shares outstanding:Common stock 144,162 145,145 146,433Restricted shares of common stock 2,720 2,885 2,746
146,882 148,030 149,179
Diluted shares outstanding:Common stock 144,162 145,145 146,433Dilutive effect of stock options 64 201 445
144,226 145,346 146,878Restricted shares of common stock 2,720 2,885 2,746
146,946 148,231 149,624
Basic earnings per shareCommon stock:
Distributed earnings $ 0.28 $ 0.24 $ 0.19Undistributed earnings 0.41 0.37 0.37
$ 0.69 $ 0.61 $ 0.56
Restricted shares of common stockDistributed earnings $ 0.27 $ 0.23 $ 0.19Undistributed earnings 0.41 0.37 0.37
$ 0.68 $ 0.60 $ 0.56Total shares of common stock
Distributed earnings $ 0.28 $ 0.24 $ 0.19Undistributed earnings 0.41 0.37 0.37
$ 0.69 $ 0.61 $ 0.56
Diluted earning per share:Common stock:
Distributed earnings $ 0.28 $ 0.24 $ 0.19Undistributed earnings 0.41 0.37 0.37
$ 0.69 $ 0.61 $ 0.56
Restricted shares of common stockDistributed earnings $ 0.27 $ 0.23 $ 0.19Undistributed earnings 0.41 0.37 0.37
$ 0.68 $ 0.60 $ 0.56
Total shares of common stockDistributed earnings $ 0.28 $ 0.24 $ 0.19Undistributed earnings 0.41 0.37 0.37
$ 0.69 $ 0.61 $ 0.56
47
Translation of Foreign Currencies—Assets and liabilities reported in functional currencies other than U.S.dollars are translated into U.S. dollars at the year-end rate of exchange. Revenues and expenses aretranslated at the weighted-average exchange rates for the year. The resulting translation adjustments arecharged or credited to other comprehensive income. Gains or losses from foreign currency transactions,such as those resulting from the settlement of receivables or payables, denominated in foreign currency areincluded in the earnings of the current period.
Stock-Based Compensation—The Company accounts for its stock-based compensation in accordance withFASB ASC Topic 713 ‘‘Compensation—Stock Compensation.’’ Stock options and time lapse restrictedshares (TLRSs) have been issued to officers and other management employees under the Company’sEmployee Stock Incentive Plan. The Company’s stock options generally vest over a five-year period andexpire ten years from the issuance date.
TLRSs provide for the issuance of a share of the Company’s Common Stock at no cost to the holder andgenerally vest after a certain stipulated number of years from the grant date, depending on the terms of theissue. Outstanding TLRSs vest in 20 percent increments starting with the second anniversary of the grant,over six years from the date of grant. During these years, grantees receive all dividends declared and retainvoting rights for the granted shares. The agreements under which the restricted stock is issued provide thatshares awarded may not be sold or otherwise transferred until restrictions established under the plans havelapsed. These awards are amortized, net of forfeitures, on a straight-line basis over six years.
The Company has not granted stock options since 2003.
Comprehensive Income (Loss)—Other Comprehensive Income (Loss) results from foreign currencytranslations and minimum pension liability adjustments.
Franchising Program—Rollins’ wholly-owned subsidiary, Orkin, had 58 and 56 domestic franchises as ofDecember 31, 2011 and 2010, respectively. Transactions with domestic franchises involve sales of customercontracts to establish new franchises, initial franchise fees and royalties. The customer contracts and initialfranchise fees are typically sold for a combination of cash and notes due over periods ranging up to fiveyears. Notes receivable from franchises were $4.7 million at December 31, 2011 and $3.7 million atDecember 31, 2010. These amounts are included as trade receivables in the accompanying ConsolidatedStatements of Financial Position.
The Company recognizes gains from the sale of customer contracts at the time they are sold to franchisesand collection on the notes is reasonably assured. The Company recognized net gains of $0.8 million and$1.1 million and for the years ended December 31, 2011 and 2010, respectively and a net loss of$0.1 million for the sale of customer contracts for the year ended December 31, 2009 due to customeradjustments. These amounts are included as revenues in the accompanying Consolidated Statements ofIncome.
All domestic franchises have a guaranteed repurchase clause that the franchise may be repurchased byOrkin at a later date once it has been established; therefore, initial domestic franchise fees are deferred inaccordance with FASB ASC Topic 952-605 ‘‘Franchisor Revenue Recognition,’’ for the duration of the initialcontract period and are included as unearned revenue in the Consolidated Statements of FinancialPosition. Deferred franchise fees were $2.9 million, $2.5 million and $2.3 million at December 31, 2011,2010 and 2009, respectively.
Royalties from franchises are accrued and recognized in accordance with FASB ASC Topic 952-605‘‘Franchisor Revenue Recognition,’’ as revenues are earned on a monthly basis. Revenue from franchises was$3.4 million for each of the years ended December 31, 2011 and 2010 and $3.0 million for the year endedDecember 31, 2009.
48
As of December 31, 2011 and 2010, Orkin had 18 and 16 international franchises, respectively. Orkin’sinternational franchise program began with its first international franchise in 2000 and since has expandedto Central America, the Caribbean, the Middle East, Asia, the Mediterranean, Europe and Africa.
The Company’s maximum exposure to loss (notes receivable from franchises less deferred franchise fees)relating to the franchises has not exceeded $2.0 million for the years ended December 31, 2009 through2011.
Three-for-Two Stock Split—The Board of Directors, at its quarterly meeting on October 26, 2010, authorized athree-for-two stock split by the issuance on December 10, 2010 of one additional common share for eachtwo common shares held of record at November 10, 2010. Accordingly, the par value for additional sharesissued was adjusted to common stock, and fractional shares resulting from the stock split were settled incash. All share and per share data appearing in the consolidated financial statements and related noteshave been retroactively adjusted for these stock splits.
New Accounting Standards
Recently issued accounting standards to be adopted in 2012
In October 2009, the FASB issued Accounting Standards Update (‘‘ASU’’) No. 2009-13, Multiple-Deliverable Revenue Arrangements, or ‘‘ASU 2009-13.’’ ASU 2009-13 establishes the accounting andreporting guidance for arrangements that include multiple revenue-generating activities, and providesamendments to the criteria for separating deliverables, and measuring and allocating arrangementconsideration to one or more units of accounting. The amendments in ASU 2009-13 also establish ahierarchy for determining the selling price of a deliverable. Enhanced disclosures are also required toprovide information about a vendor’s multiple-deliverable revenue arrangements, including informationabout the nature and terms of the arrangement, significant deliverables, and the vendor’s performancewithin arrangements. The amendments also require providing information about the significant judgmentsmade and changes to those judgments and about how the application of the relative selling-price methodaffects the timing or amount of revenue recognition. The amendments in ASU 2009-13 are effectiveprospectively for revenue arrangements entered into or materially modified in fiscal years beginning on orafter June 15, 2010, or January 1, 2011 for us. The adoption of ASU 2009-13 did not have a material impacton our financial position or results of operations.
In September 2011, the FASB issued ASU 2011-08 which provides an entity the option to first assessqualitative factors to determine whether it is necessary to perform the current two-step test for goodwillimpairment. If an entity believes, as a result of its qualitative assessment, that it is more-likely-than-notthat the fair value of a reporting unit is less than its carrying amount, the quantitative impairment test isrequired. Otherwise, no further testing is required. The revised standard is effective for annual and interimgoodwill impairment tests performed for fiscal years beginning after December 15, 2011. However, anentity can choose to early adopt even if its annual test date is before the issuance of the final standard,provided that the entity has not yet performed its 2011 annual impairment test or issued its financialstatements. The adoption of this ASU is not expected to significantly impact our consolidated financialstatements.
In December 2011, the FASB issued an Accounting Standards Update (‘‘ASU’’) Disclosures about OffsettingAssets and Liabilities (‘‘ASU 2011-11’’) to Topic 210, Balance Sheet. The update requires new disclosuresabout balance sheet offsetting and related arrangements. For derivatives and financial assets and liabilities,the amendments require disclosure of gross asset and liability amounts, amounts offset on the balancesheet, and amounts subject to the offsetting requirements but not offset on the balance sheet. Theguidance is effective December 1, 2013 and is to be applied retrospectively. This guidance does not amendthe existing guidance on when it is appropriate to offset; as a result, we do not expect this guidance to havea material impact on our financial statements.
49
In June 2011, the Financial Accounting Standards Board (‘‘FASB’’) issued Accounting Standards UpdateNo. 2011-05, Presentation of Comprehensive Income (ASU 2011-05). This standard eliminated the optionto report other comprehensive income and its components in the statement of changes in equity. Underthis standard, an entity can elect to present items of net income and other comprehensive income in onecontinuous statement—referred to as the statement of comprehensive income—or in two separate, butconsecutive, statements. In December 2011, the FASB issued Accounting Standards Update No. 2011-12,Deferral of the Effective Date for Amendments to the Presentation of Reclassifications of Items Out ofAccumulated Other Comprehensive Income in Accounting Standards Update No. 2011-05 (ASU 2011-12).ASU 2011-12 defers the effective date of the requirement in ASU 2011-05 to disclose on the face of thefinancial statements the effects of reclassifications out of accumulated other comprehensive income on thecomponents of net income and other comprehensive income. All other requirements of ASU 2011-05 arenot affected by ASU 2011-12. The Company adopted ASU 2011-05 effective December 31, 2011 anddeferred certain disclosures as allowed under ASU 2011-12. ASU 2011-05 did not have a material impacton the Company’s consolidated financial position, results of operations, or cash flows. The expiration ofdeferral allowed by ASU 2011-12 is not expected to have a significant impact on our consolidated financialstatements.
2. ACQUISITIONS
Acquisition of Waltham Services:
The Company acquired Waltham Services, Inc. on July 31, 2010. Waltham Services, Inc. was established in1893 in Waltham, Massachusetts. Waltham Services, with annual revenues exceeding $17 million, is aleading provider of advanced pest management serving New England and New York. Waltham’s primaryservice is commercial and residential pest control. Prior to the acquisition, Waltham was ranked as the33rd largest company in the industry.
Including the Waltham Services acquisition, the Company has made several acquisitions that are notmaterial individually or in total to the Company’s consolidated financial statements during the years endedDecember 31, 2011, 2010 and 2009.
3. DEBT
On March 28, 2008, the Company entered into a Revolving Credit Agreement with SunTrust Bank andBank of America, N.A. for an unsecured line of credit of up to $175.0 million, which includes a$75.0 million letter of credit subfacility, and a $10.0 million swingline subfacility. As of December 31, 2011,no borrowings were outstanding under the line of credit or under the swingline subfacility. The Companymaintains approximately $31.3 million in letters of credit. These letters of credit are required by theCompany’s fronting insurance companies and/or certain states, due to the Company’s self-insured status,to secure various workers’ compensation and casualty insurance contracts coverage. The Company believesthat it has adequate liquid assets, funding sources and insurance accruals to accommodate such claims.
The Revolving Credit Agreement is guaranteed by Rollins’ domestic subsidiaries. The maturity date of theCredit Agreement is March 27, 2013. Revolving loans under the Revolving Credit Agreement bear interestat one of the following two rates, at the Company’s election:
• the Base Rate, which is the highest of SunTrust Bank’s ‘‘prime rate’’ for the day of the borrowing, afluctuating rate per annum equal to the Federal Funds Rate plus 0.50% or the Adjusted LIBORRate determined on a daily basis for an interest period of one month; or
• with respect to any Eurodollar borrowings, Adjusted LIBOR (which equals LIBOR as increased toaccount for the maximum reserve percentages established by the U.S. Federal Reserve) plus anadditional amount, which varies between .50% and .75%, based upon Rollins’ then-currentdebt-to-EBITDA ratio. As of December 31, 2011, the additional rate allocated was .50%.
50
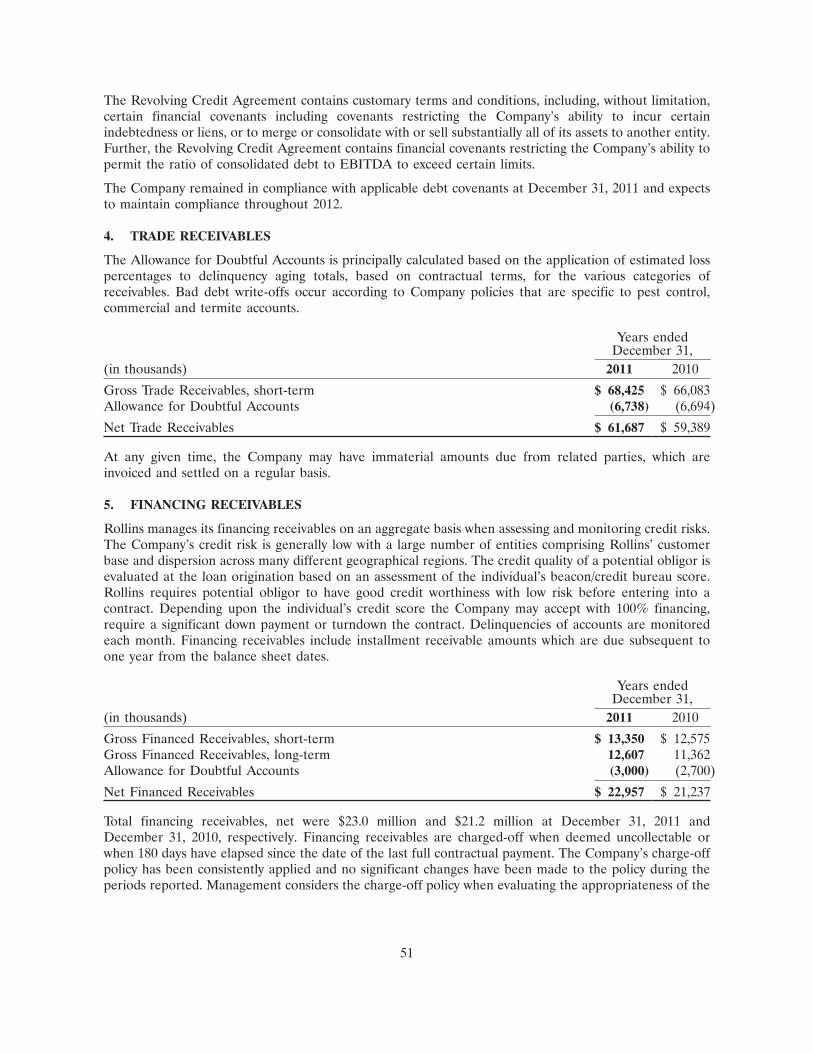
The Revolving Credit Agreement contains customary terms and conditions, including, without limitation,certain financial covenants including covenants restricting the Company’s ability to incur certainindebtedness or liens, or to merge or consolidate with or sell substantially all of its assets to another entity.Further, the Revolving Credit Agreement contains financial covenants restricting the Company’s ability topermit the ratio of consolidated debt to EBITDA to exceed certain limits.
The Company remained in compliance with applicable debt covenants at December 31, 2011 and expectsto maintain compliance throughout 2012.
4. TRADE RECEIVABLES
The Allowance for Doubtful Accounts is principally calculated based on the application of estimated losspercentages to delinquency aging totals, based on contractual terms, for the various categories ofreceivables. Bad debt write-offs occur according to Company policies that are specific to pest control,commercial and termite accounts.
Years endedDecember 31,
(in thousands) 2011 2010
Gross Trade Receivables, short-term $ 68,425 $ 66,083Allowance for Doubtful Accounts (6,738) (6,694)
Net Trade Receivables $ 61,687 $ 59,389
At any given time, the Company may have immaterial amounts due from related parties, which areinvoiced and settled on a regular basis.
5. FINANCING RECEIVABLES
Rollins manages its financing receivables on an aggregate basis when assessing and monitoring credit risks.The Company’s credit risk is generally low with a large number of entities comprising Rollins’ customerbase and dispersion across many different geographical regions. The credit quality of a potential obligor isevaluated at the loan origination based on an assessment of the individual’s beacon/credit bureau score.Rollins requires potential obligor to have good credit worthiness with low risk before entering into acontract. Depending upon the individual’s credit score the Company may accept with 100% financing,require a significant down payment or turndown the contract. Delinquencies of accounts are monitoredeach month. Financing receivables include installment receivable amounts which are due subsequent toone year from the balance sheet dates.
Years endedDecember 31,
(in thousands) 2011 2010
Gross Financed Receivables, short-term $ 13,350 $ 12,575Gross Financed Receivables, long-term 12,607 11,362Allowance for Doubtful Accounts (3,000) (2,700)
Net Financed Receivables $ 22,957 $ 21,237
Total financing receivables, net were $23.0 million and $21.2 million at December 31, 2011 andDecember 31, 2010, respectively. Financing receivables are charged-off when deemed uncollectable orwhen 180 days have elapsed since the date of the last full contractual payment. The Company’s charge-offpolicy has been consistently applied and no significant changes have been made to the policy during theperiods reported. Management considers the charge-off policy when evaluating the appropriateness of the
51
allowance for doubtful accounts. Charge-offs as a percentage of average financing receivables were 3.0%and 4.0% for the twelve months ended December 31, 2011 and December 31, 2010, respectively. Due tothe low percentage of charge-off receivables and the high credit worthiness of the potential obligor, theentire Rollins, Inc. financing receivables portfolio has a low credit risk.
The Company offers 90 days same-as-cash financing to some customers based on their credit worthiness.Interest is not recognized until the 91st day at which time it is recognized retrospectively back to the firstday if the contract has not been paid in full. In certain circumstances, such as when delinquency is deemedto be of an administrative nature, accounts may still accrue interest when they reach 180 days past due. Asof December 31, 2011, there were no accounts on a non-accrual status, and no financing receivablesgreater than 180 days past due.
Included in financing receivables are notes receivable from franchise owners. These notes are low risk asthe repurchase of these franchises is guaranteed by the Company’s wholly-owned subsidiary, Orkin, Inc.,and the repurchase price of the franchise is currently estimated and have historically been well above thereceivable due from the franchise owner.
The carrying amount of notes receivable approximates fair value as the interest rates approximate marketrates for these types of contracts. Long-Term Installment receivables, net were $11.3 million and$10.2 million at December 31, 2011 and 2010, respectively.
Rollins establishes an allowance for doubtful accounts to insure financing receivables are not overstateddue to uncollectability. The allowance balance is comprised of a general reserve, which is determinedbased on a percentage of the financing receivables balance, and a specific reserve, which is established forcertain accounts with identified exposures, such as customer default, bankruptcy or other events, that makeit unlikely that Rollins will recover its investment. The general reserve percentages are based on severalfactors, which include consideration of historical credit losses and portfolio delinquencies, trends in overallweighted-average risk rating of the portfolio and information derived from competitive benchmarking.
The allowance for doubtful accounts related to financing receivables was as follows:
Twelve months Twelve monthsended ended
(in thousands) December 31, 2011 December 31, 2010
Balance, beginning of period $ 2,700 $ 2,600Additions to allowance 977 995Deductions, net of recoveries (677) (895)
Balance, end of period $ 3,000 $ 2,700
The following is a summary of the past due financing receivables as of:
December 31, December 31,(in thousands) 2011 2010
30 - 59 days past due $ 590 $ 83360 - 89 days past due 183 38290 days or more past due 450 370
Total $ 1,223 $ 1,585
52
Percentage of period-end gross financing receivables
December 31, December 31,2011 2010
Current 95.3% 93.4%30-59 days past due 2.3% 3.5%60-89 days past due 0.7% 1.5%90 days or more past due 1.7% 1.6%
Total 100% 100%
6. EQUIPMENT AND PROPERTY
Equipment and property are presented at cost less accumulated depreciation and are detailed as follows:
December 31,(in thousands) 2011 2010
Buildings $ 43,842 $ 42,995Operating Equipment 70,932 67,739Furniture and Fixtures 11,809 11,375Computer Equipment and Systems 52,275 49,759
178,858 171,868Less—Accumulated Depreciation 125,667 121,540
53,191 50,328Land 23,667 23,685
Net equipment and property $ 76,858 $ 74,013
Included in equipment and property, net at December 31, 2011 and 2010, are fixed assets held in foreigncountries of $2.6 million, and $2.0 million, respectively.
Total depreciation expense was approximately $15.1 million in 2011, $16.0 million in 2010 and $15.9 millionin 2009.
7. FAIR VALUE MEASUREMENT
The Company’s financial instruments consist of cash and cash equivalents, short-term investments, tradeand notes receivables, accounts payable and other short-term liabilities. The carrying amounts of thesefinancial instruments approximate their fair values. The Company has financial instruments related to itsdefined pension plan and deferred compensation plan detailed in note 13.
The following table presents our nonqualified deferred compensation plan assets using the fair valuehierarchy as of December 31, 2011. The fair value hierarchy has three levels based on the reliability of theinputs used to determine fair value. Level 1 refers to fair values determined based on quoted prices inactive markets for identical assets. Level 2 refers to fair values estimated using significant other observableinputs, and Level 3 includes fair values estimated using significant non-observable inputs.
Total Level 1 Level 2 Level 3
Cash and cash equivalents $ 37 $ 37 $ — $ —Available for sale securities 287 287 — —
Total $ 324 $ 324 $ — $ —
53
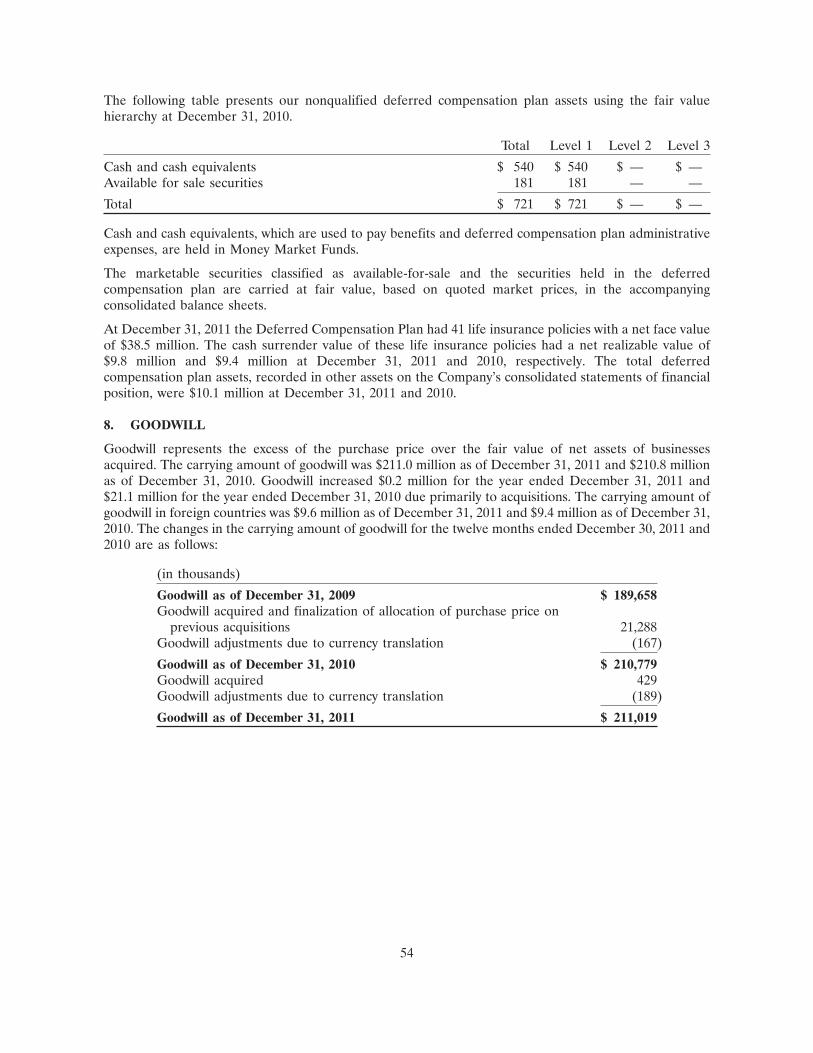
The following table presents our nonqualified deferred compensation plan assets using the fair valuehierarchy at December 31, 2010.
Total Level 1 Level 2 Level 3
Cash and cash equivalents $ 540 $ 540 $ — $ —Available for sale securities 181 181 — —
Total $ 721 $ 721 $ — $ —
Cash and cash equivalents, which are used to pay benefits and deferred compensation plan administrativeexpenses, are held in Money Market Funds.
The marketable securities classified as available-for-sale and the securities held in the deferredcompensation plan are carried at fair value, based on quoted market prices, in the accompanyingconsolidated balance sheets.
At December 31, 2011 the Deferred Compensation Plan had 41 life insurance policies with a net face valueof $38.5 million. The cash surrender value of these life insurance policies had a net realizable value of$9.8 million and $9.4 million at December 31, 2011 and 2010, respectively. The total deferredcompensation plan assets, recorded in other assets on the Company’s consolidated statements of financialposition, were $10.1 million at December 31, 2011 and 2010.
8. GOODWILL
Goodwill represents the excess of the purchase price over the fair value of net assets of businessesacquired. The carrying amount of goodwill was $211.0 million as of December 31, 2011 and $210.8 millionas of December 31, 2010. Goodwill increased $0.2 million for the year ended December 31, 2011 and$21.1 million for the year ended December 31, 2010 due primarily to acquisitions. The carrying amount ofgoodwill in foreign countries was $9.6 million as of December 31, 2011 and $9.4 million as of December 31,2010. The changes in the carrying amount of goodwill for the twelve months ended December 30, 2011 and2010 are as follows:
(in thousands)
Goodwill as of December 31, 2009 $ 189,658Goodwill acquired and finalization of allocation of purchase price on
previous acquisitions 21,288Goodwill adjustments due to currency translation (167)
Goodwill as of December 31, 2010 $ 210,779Goodwill acquired 429Goodwill adjustments due to currency translation (189)
Goodwill as of December 31, 2011 $ 211,019
54
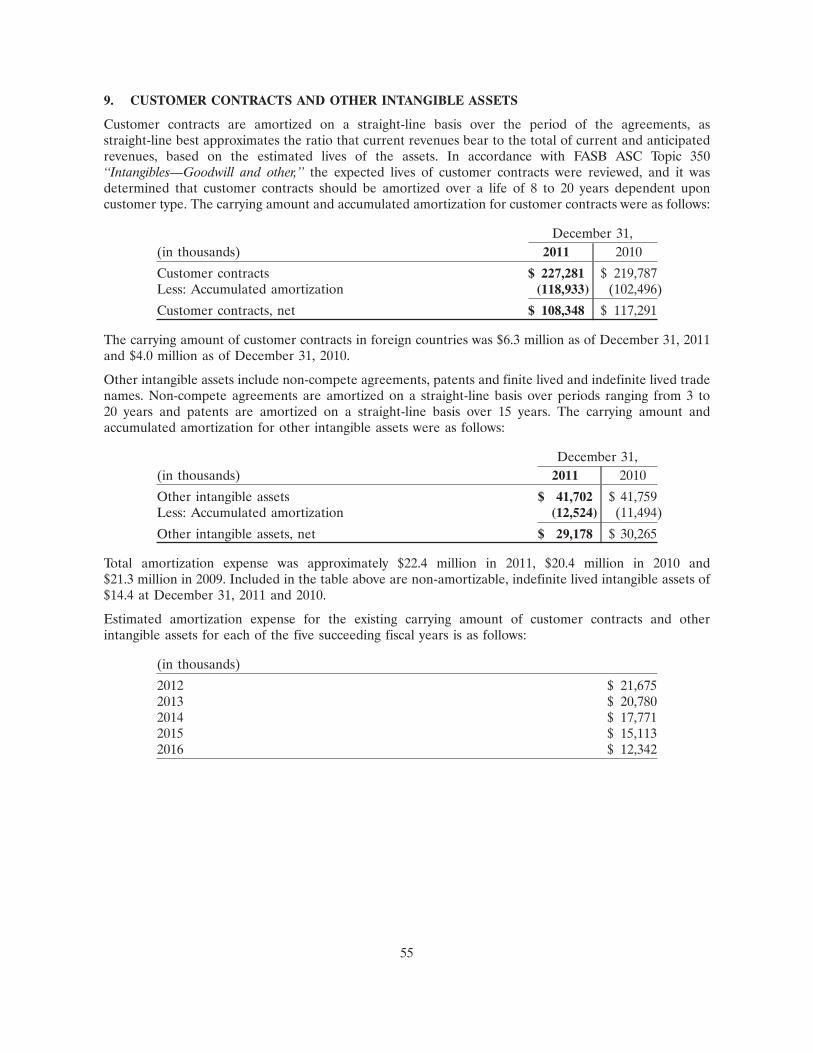
9. CUSTOMER CONTRACTS AND OTHER INTANGIBLE ASSETS
Customer contracts are amortized on a straight-line basis over the period of the agreements, asstraight-line best approximates the ratio that current revenues bear to the total of current and anticipatedrevenues, based on the estimated lives of the assets. In accordance with FASB ASC Topic 350‘‘Intangibles—Goodwill and other,’’ the expected lives of customer contracts were reviewed, and it wasdetermined that customer contracts should be amortized over a life of 8 to 20 years dependent uponcustomer type. The carrying amount and accumulated amortization for customer contracts were as follows:
December 31,(in thousands) 2011 2010
Customer contracts $ 227,281 $ 219,787Less: Accumulated amortization (118,933) (102,496)
Customer contracts, net $ 108,348 $ 117,291
The carrying amount of customer contracts in foreign countries was $6.3 million as of December 31, 2011and $4.0 million as of December 31, 2010.
Other intangible assets include non-compete agreements, patents and finite lived and indefinite lived tradenames. Non-compete agreements are amortized on a straight-line basis over periods ranging from 3 to20 years and patents are amortized on a straight-line basis over 15 years. The carrying amount andaccumulated amortization for other intangible assets were as follows:
December 31,(in thousands) 2011 2010
Other intangible assets $ 41,702 $ 41,759Less: Accumulated amortization (12,524) (11,494)
Other intangible assets, net $ 29,178 $ 30,265
Total amortization expense was approximately $22.4 million in 2011, $20.4 million in 2010 and$21.3 million in 2009. Included in the table above are non-amortizable, indefinite lived intangible assets of$14.4 at December 31, 2011 and 2010.
Estimated amortization expense for the existing carrying amount of customer contracts and otherintangible assets for each of the five succeeding fiscal years is as follows:
(in thousands)
2012 $ 21,6752013 $ 20,7802014 $ 17,7712015 $ 15,1132016 $ 12,342
55
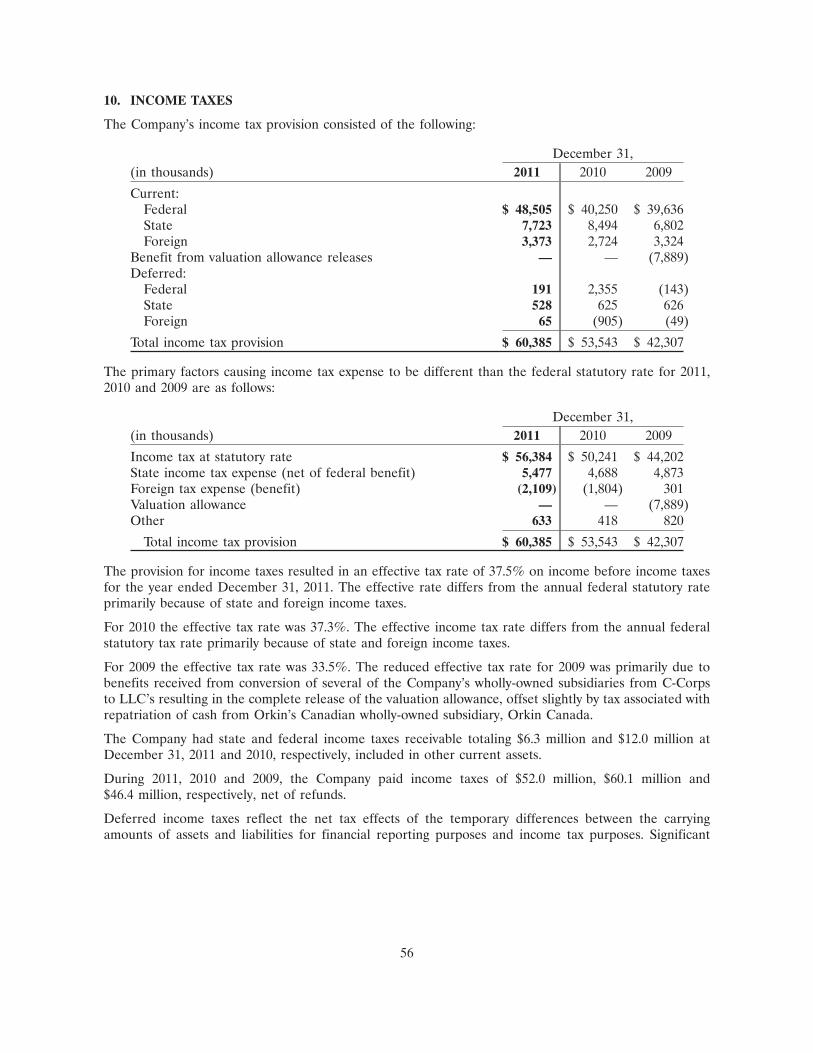
10. INCOME TAXES
The Company’s income tax provision consisted of the following:
December 31,(in thousands) 2011 2010 2009
Current:Federal $ 48,505 $ 40,250 $ 39,636State 7,723 8,494 6,802Foreign 3,373 2,724 3,324
Benefit from valuation allowance releases — — (7,889)Deferred:
Federal 191 2,355 (143)State 528 625 626Foreign 65 (905) (49)
Total income tax provision $ 60,385 $ 53,543 $ 42,307
The primary factors causing income tax expense to be different than the federal statutory rate for 2011,2010 and 2009 are as follows:
December 31,(in thousands) 2011 2010 2009
Income tax at statutory rate $ 56,384 $ 50,241 $ 44,202State income tax expense (net of federal benefit) 5,477 4,688 4,873Foreign tax expense (benefit) (2,109) (1,804) 301Valuation allowance — — (7,889)Other 633 418 820
Total income tax provision $ 60,385 $ 53,543 $ 42,307
The provision for income taxes resulted in an effective tax rate of 37.5% on income before income taxesfor the year ended December 31, 2011. The effective rate differs from the annual federal statutory rateprimarily because of state and foreign income taxes.
For 2010 the effective tax rate was 37.3%. The effective income tax rate differs from the annual federalstatutory tax rate primarily because of state and foreign income taxes.
For 2009 the effective tax rate was 33.5%. The reduced effective tax rate for 2009 was primarily due tobenefits received from conversion of several of the Company’s wholly-owned subsidiaries from C-Corpsto LLC’s resulting in the complete release of the valuation allowance, offset slightly by tax associated withrepatriation of cash from Orkin’s Canadian wholly-owned subsidiary, Orkin Canada.
The Company had state and federal income taxes receivable totaling $6.3 million and $12.0 million atDecember 31, 2011 and 2010, respectively, included in other current assets.
During 2011, 2010 and 2009, the Company paid income taxes of $52.0 million, $60.1 million and$46.4 million, respectively, net of refunds.
Deferred income taxes reflect the net tax effects of the temporary differences between the carryingamounts of assets and liabilities for financial reporting purposes and income tax purposes. Significant
56
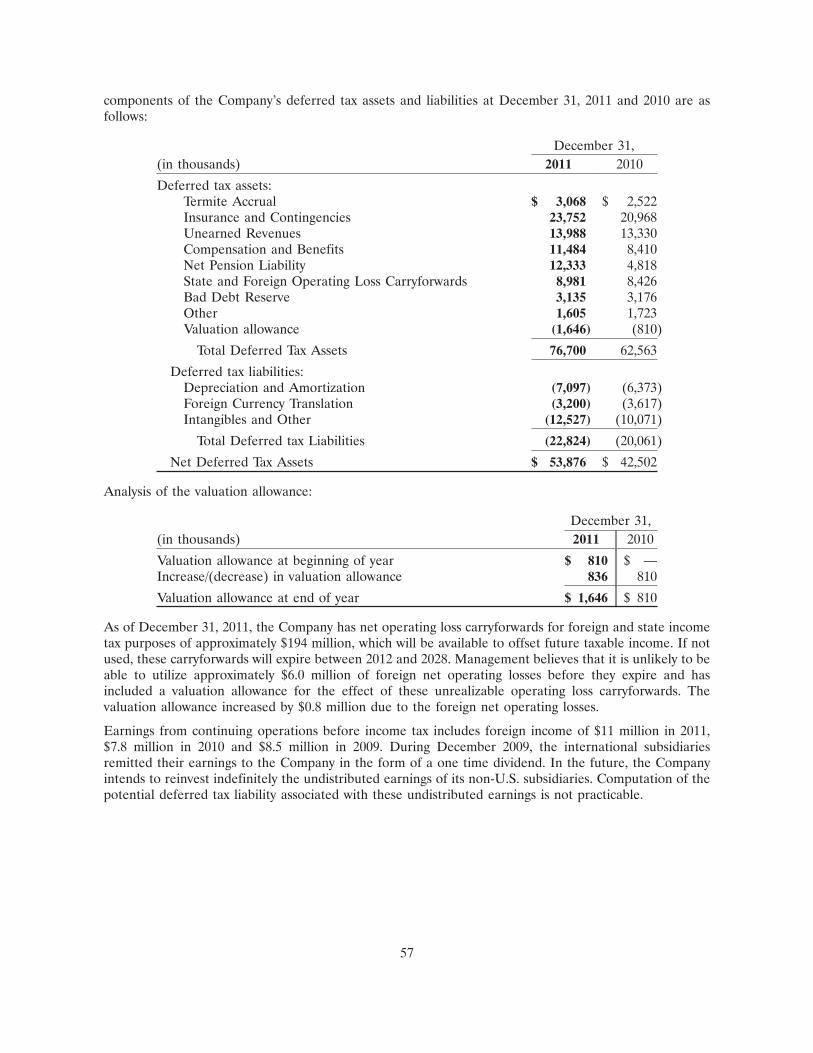
components of the Company’s deferred tax assets and liabilities at December 31, 2011 and 2010 are asfollows:
December 31,(in thousands) 2011 2010
Deferred tax assets:Termite Accrual $ 3,068 $ 2,522Insurance and Contingencies 23,752 20,968Unearned Revenues 13,988 13,330Compensation and Benefits 11,484 8,410Net Pension Liability 12,333 4,818State and Foreign Operating Loss Carryforwards 8,981 8,426Bad Debt Reserve 3,135 3,176Other 1,605 1,723Valuation allowance (1,646) (810)
Total Deferred Tax Assets 76,700 62,563
Deferred tax liabilities:Depreciation and Amortization (7,097) (6,373)Foreign Currency Translation (3,200) (3,617)Intangibles and Other (12,527) (10,071)
Total Deferred tax Liabilities (22,824) (20,061)
Net Deferred Tax Assets $ 53,876 $ 42,502
Analysis of the valuation allowance:
December 31,(in thousands) 2011 2010
Valuation allowance at beginning of year $ 810 $ —Increase/(decrease) in valuation allowance 836 810
Valuation allowance at end of year $ 1,646 $ 810
As of December 31, 2011, the Company has net operating loss carryforwards for foreign and state incometax purposes of approximately $194 million, which will be available to offset future taxable income. If notused, these carryforwards will expire between 2012 and 2028. Management believes that it is unlikely to beable to utilize approximately $6.0 million of foreign net operating losses before they expire and hasincluded a valuation allowance for the effect of these unrealizable operating loss carryforwards. Thevaluation allowance increased by $0.8 million due to the foreign net operating losses.
Earnings from continuing operations before income tax includes foreign income of $11 million in 2011,$7.8 million in 2010 and $8.5 million in 2009. During December 2009, the international subsidiariesremitted their earnings to the Company in the form of a one time dividend. In the future, the Companyintends to reinvest indefinitely the undistributed earnings of its non-U.S. subsidiaries. Computation of thepotential deferred tax liability associated with these undistributed earnings is not practicable.
57
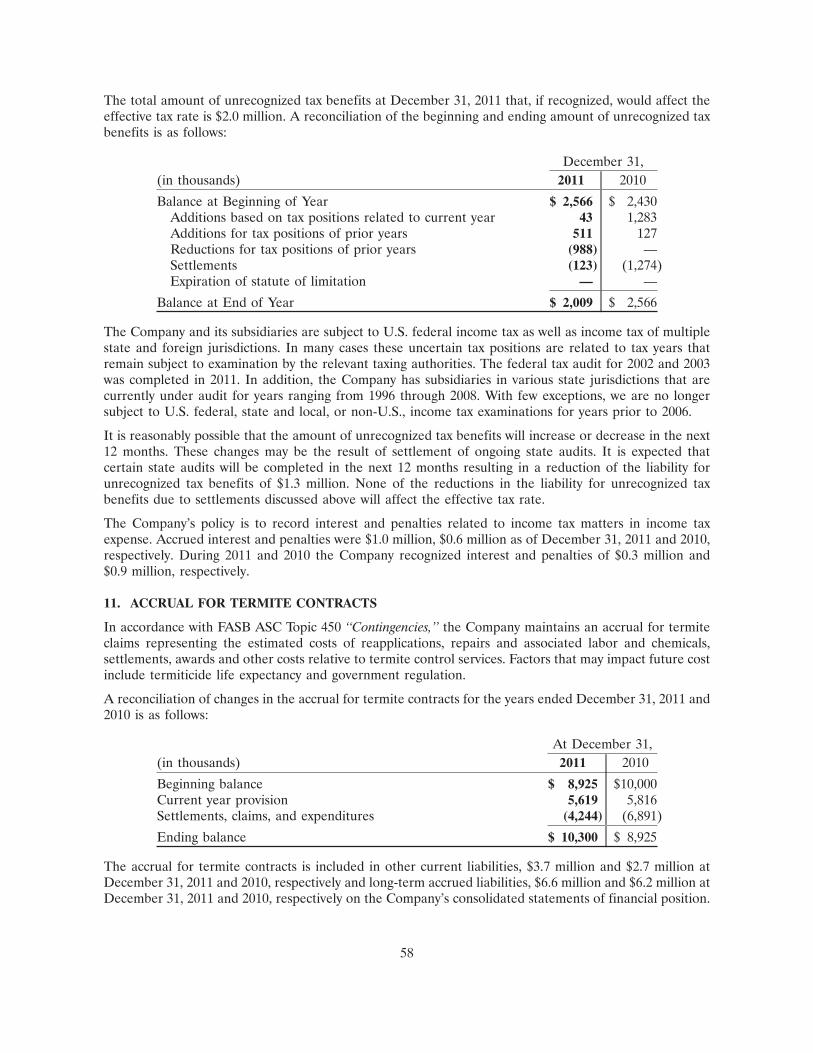
The total amount of unrecognized tax benefits at December 31, 2011 that, if recognized, would affect theeffective tax rate is $2.0 million. A reconciliation of the beginning and ending amount of unrecognized taxbenefits is as follows:
December 31,(in thousands) 2011 2010
Balance at Beginning of Year $ 2,566 $ 2,430Additions based on tax positions related to current year 43 1,283Additions for tax positions of prior years 511 127Reductions for tax positions of prior years (988) —Settlements (123) (1,274)Expiration of statute of limitation — —
Balance at End of Year $ 2,009 $ 2,566
The Company and its subsidiaries are subject to U.S. federal income tax as well as income tax of multiplestate and foreign jurisdictions. In many cases these uncertain tax positions are related to tax years thatremain subject to examination by the relevant taxing authorities. The federal tax audit for 2002 and 2003was completed in 2011. In addition, the Company has subsidiaries in various state jurisdictions that arecurrently under audit for years ranging from 1996 through 2008. With few exceptions, we are no longersubject to U.S. federal, state and local, or non-U.S., income tax examinations for years prior to 2006.
It is reasonably possible that the amount of unrecognized tax benefits will increase or decrease in the next12 months. These changes may be the result of settlement of ongoing state audits. It is expected thatcertain state audits will be completed in the next 12 months resulting in a reduction of the liability forunrecognized tax benefits of $1.3 million. None of the reductions in the liability for unrecognized taxbenefits due to settlements discussed above will affect the effective tax rate.
The Company’s policy is to record interest and penalties related to income tax matters in income taxexpense. Accrued interest and penalties were $1.0 million, $0.6 million as of December 31, 2011 and 2010,respectively. During 2011 and 2010 the Company recognized interest and penalties of $0.3 million and$0.9 million, respectively.
11. ACCRUAL FOR TERMITE CONTRACTS
In accordance with FASB ASC Topic 450 ‘‘Contingencies,’’ the Company maintains an accrual for termiteclaims representing the estimated costs of reapplications, repairs and associated labor and chemicals,settlements, awards and other costs relative to termite control services. Factors that may impact future costinclude termiticide life expectancy and government regulation.
A reconciliation of changes in the accrual for termite contracts for the years ended December 31, 2011 and2010 is as follows:
At December 31,(in thousands) 2011 2010
Beginning balance $ 8,925 $10,000Current year provision 5,619 5,816Settlements, claims, and expenditures (4,244) (6,891)
Ending balance $ 10,300 $ 8,925
The accrual for termite contracts is included in other current liabilities, $3.7 million and $2.7 million atDecember 31, 2011 and 2010, respectively and long-term accrued liabilities, $6.6 million and $6.2 million atDecember 31, 2011 and 2010, respectively on the Company’s consolidated statements of financial position.
58
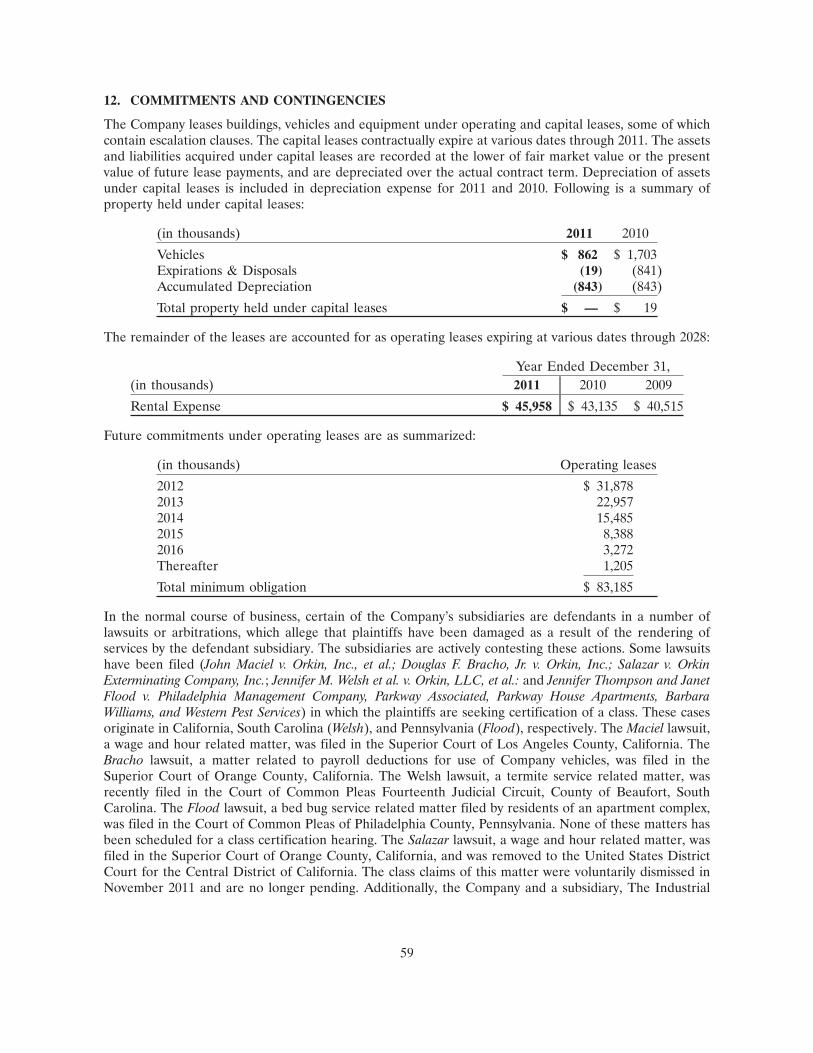
12. COMMITMENTS AND CONTINGENCIES
The Company leases buildings, vehicles and equipment under operating and capital leases, some of whichcontain escalation clauses. The capital leases contractually expire at various dates through 2011. The assetsand liabilities acquired under capital leases are recorded at the lower of fair market value or the presentvalue of future lease payments, and are depreciated over the actual contract term. Depreciation of assetsunder capital leases is included in depreciation expense for 2011 and 2010. Following is a summary ofproperty held under capital leases:
(in thousands) 2011 2010
Vehicles $ 862 $ 1,703Expirations & Disposals (19) (841)Accumulated Depreciation (843) (843)
Total property held under capital leases $ — $ 19
The remainder of the leases are accounted for as operating leases expiring at various dates through 2028:
Year Ended December 31,(in thousands) 2011 2010 2009
Rental Expense $ 45,958 $ 43,135 $ 40,515
Future commitments under operating leases are as summarized:
(in thousands) Operating leases
2012 $ 31,8782013 22,9572014 15,4852015 8,3882016 3,272Thereafter 1,205
Total minimum obligation $ 83,185
In the normal course of business, certain of the Company’s subsidiaries are defendants in a number oflawsuits or arbitrations, which allege that plaintiffs have been damaged as a result of the rendering ofservices by the defendant subsidiary. The subsidiaries are actively contesting these actions. Some lawsuitshave been filed (John Maciel v. Orkin, Inc., et al.; Douglas F. Bracho, Jr. v. Orkin, Inc.; Salazar v. OrkinExterminating Company, Inc.; Jennifer M. Welsh et al. v. Orkin, LLC, et al.: and Jennifer Thompson and JanetFlood v. Philadelphia Management Company, Parkway Associated, Parkway House Apartments, BarbaraWilliams, and Western Pest Services) in which the plaintiffs are seeking certification of a class. These casesoriginate in California, South Carolina (Welsh), and Pennsylvania (Flood), respectively. The Maciel lawsuit,a wage and hour related matter, was filed in the Superior Court of Los Angeles County, California. TheBracho lawsuit, a matter related to payroll deductions for use of Company vehicles, was filed in theSuperior Court of Orange County, California. The Welsh lawsuit, a termite service related matter, wasrecently filed in the Court of Common Pleas Fourteenth Judicial Circuit, County of Beaufort, SouthCarolina. The Flood lawsuit, a bed bug service related matter filed by residents of an apartment complex,was filed in the Court of Common Pleas of Philadelphia County, Pennsylvania. None of these matters hasbeen scheduled for a class certification hearing. The Salazar lawsuit, a wage and hour related matter, wasfiled in the Superior Court of Orange County, California, and was removed to the United States DistrictCourt for the Central District of California. The class claims of this matter were voluntarily dismissed inNovember 2011 and are no longer pending. Additionally, the Company and a subsidiary, The Industrial
59
Fumigant Company, LLC, are named defendants in Severn Peanut Co. and Meherrin Agriculture &Chemical Co. v. Industrial Fumigant Co., et al. The Severn lawsuit, a matter related to a fumigation service,has been filed in the Northern Division of the United States District Court for the Eastern District ofNorth Carolina. The plaintiffs are seeking damages for breach of contract and negligence. The Companybelieves these matters are without merit and intends to vigorously contest certification and defend itselfthrough trial or arbitration, if necessary. The Company does not believe that any pending claim,proceeding or litigation, either alone or in the aggregate, will have a material adverse effect on theCompany’s financial position, results of operations or liquidity; however, it is possible that an unfavorableoutcome of some or all of the matters, however unlikely, could result in a charge that might be material tothe results of an individual quarter or year.
Orkin, LLC is involved in certain environmental matters primarily arising in the normal course of business.In the opinion of management, the Company’s liability under any of these matters would not and did notmaterially affect its financial condition, results of operations or liquidity. Environmental remediation isreported on a non-discounted basis.
13. EMPLOYEE BENEFIT AND STOCK COMPENSATION PLANS
Employee Benefit Plans
Defined Benefit Pension Plans
Rollins, Inc. Retirement Income Plan
The Company maintains several noncontributory tax-qualified defined benefit pension plans (the ‘‘Plans’’)covering employees meeting certain age and service requirements. The Plans provides benefits based onthe average compensation for the highest five years during the last ten years of credited service (asdefined) in which compensation was received, and the average anticipated Social Security coveredearnings. The Company funds the Plans with at least the minimum amount required by ERISA. TheCompany made contributions of $4.9 million to the Plans during the year ended December 31, 2011 with$5.2 million in contributions made for 2010 and $5.0 million for 2009.
In June 2005, the Company froze the Rollins, Inc. defined benefit pension plan. The Company currentlyuses December 31 as the measurement date for its defined benefit post-retirement plans. The funded
60
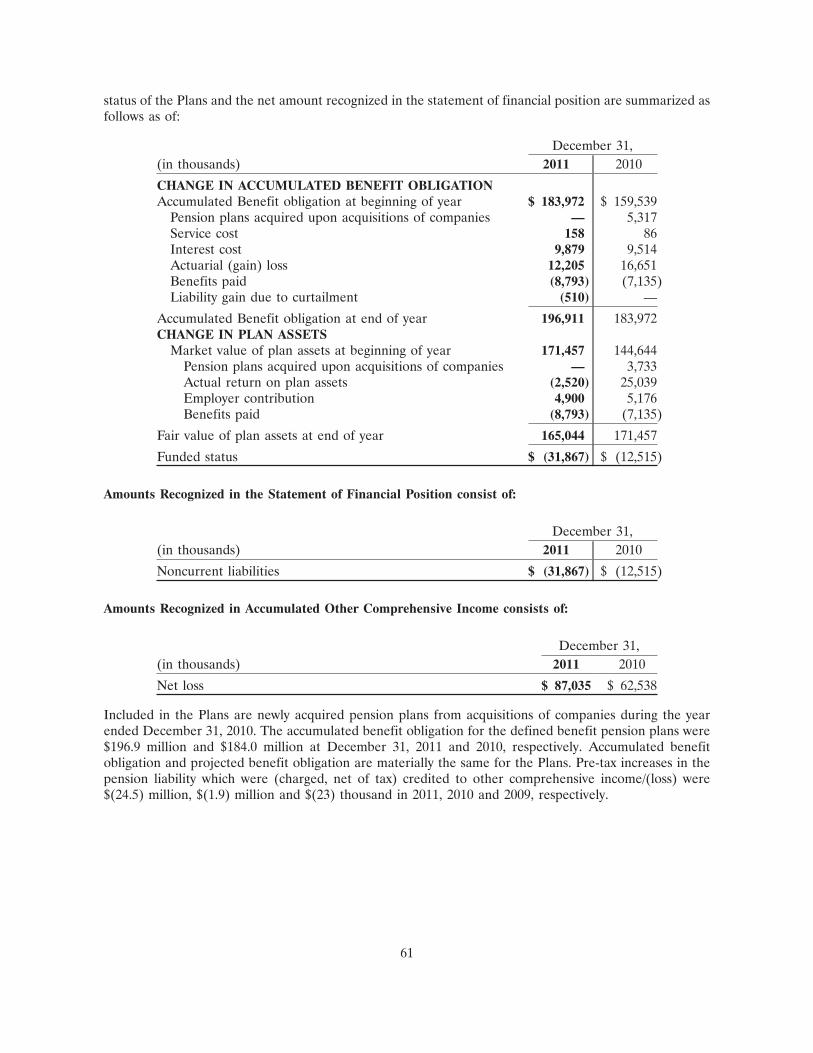
status of the Plans and the net amount recognized in the statement of financial position are summarized asfollows as of:
December 31,(in thousands) 2011 2010
CHANGE IN ACCUMULATED BENEFIT OBLIGATIONAccumulated Benefit obligation at beginning of year $ 183,972 $ 159,539
Pension plans acquired upon acquisitions of companies — 5,317Service cost 158 86Interest cost 9,879 9,514Actuarial (gain) loss 12,205 16,651Benefits paid (8,793) (7,135)Liability gain due to curtailment (510) —
Accumulated Benefit obligation at end of year 196,911 183,972CHANGE IN PLAN ASSETS
Market value of plan assets at beginning of year 171,457 144,644Pension plans acquired upon acquisitions of companies — 3,733Actual return on plan assets (2,520) 25,039Employer contribution 4,900 5,176Benefits paid (8,793) (7,135)
Fair value of plan assets at end of year 165,044 171,457
Funded status $ (31,867) $ (12,515)
Amounts Recognized in the Statement of Financial Position consist of:
December 31,(in thousands) 2011 2010
Noncurrent liabilities $ (31,867) $ (12,515)
Amounts Recognized in Accumulated Other Comprehensive Income consists of:
December 31,(in thousands) 2011 2010
Net loss $ 87,035 $ 62,538
Included in the Plans are newly acquired pension plans from acquisitions of companies during the yearended December 31, 2010. The accumulated benefit obligation for the defined benefit pension plans were$196.9 million and $184.0 million at December 31, 2011 and 2010, respectively. Accumulated benefitobligation and projected benefit obligation are materially the same for the Plans. Pre-tax increases in thepension liability which were (charged, net of tax) credited to other comprehensive income/(loss) were$(24.5) million, $(1.9) million and $(23) thousand in 2011, 2010 and 2009, respectively.
61
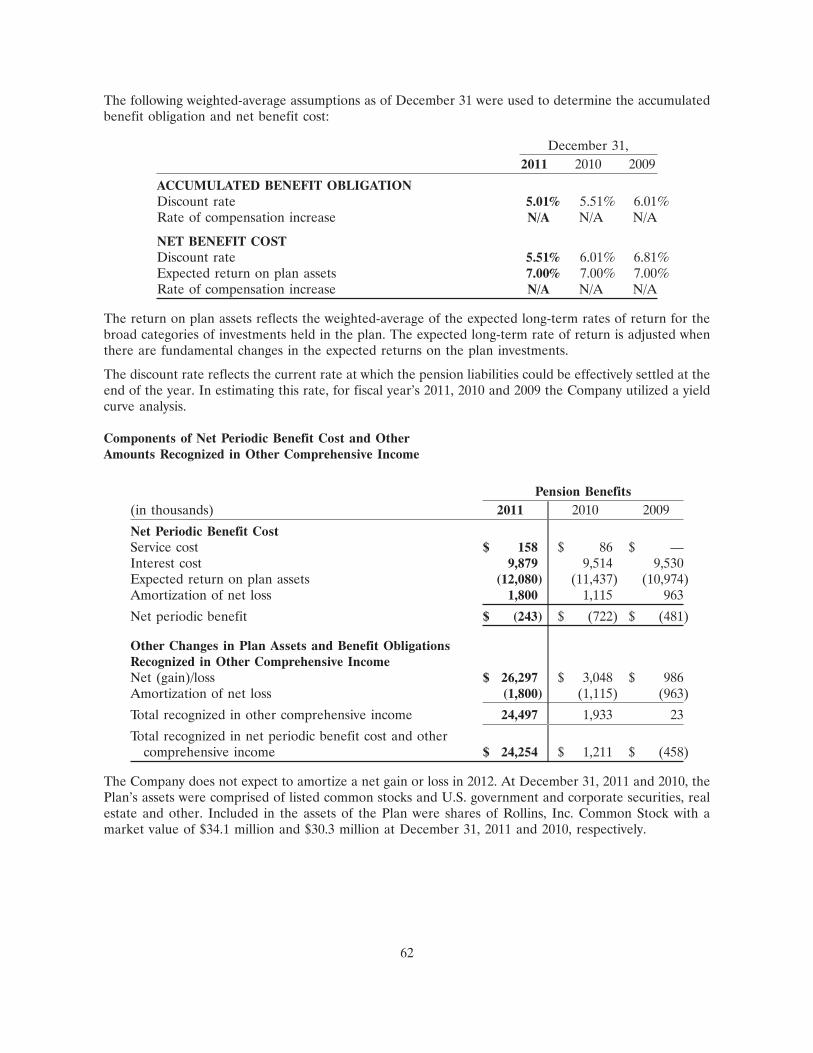
The following weighted-average assumptions as of December 31 were used to determine the accumulatedbenefit obligation and net benefit cost:
December 31,2011 2010 2009
ACCUMULATED BENEFIT OBLIGATIONDiscount rate 5.01% 5.51% 6.01%Rate of compensation increase N/A N/A N/A
NET BENEFIT COSTDiscount rate 5.51% 6.01% 6.81%Expected return on plan assets 7.00% 7.00% 7.00%Rate of compensation increase N/A N/A N/A
The return on plan assets reflects the weighted-average of the expected long-term rates of return for thebroad categories of investments held in the plan. The expected long-term rate of return is adjusted whenthere are fundamental changes in the expected returns on the plan investments.
The discount rate reflects the current rate at which the pension liabilities could be effectively settled at theend of the year. In estimating this rate, for fiscal year’s 2011, 2010 and 2009 the Company utilized a yieldcurve analysis.
Components of Net Periodic Benefit Cost and OtherAmounts Recognized in Other Comprehensive Income
Pension Benefits(in thousands) 2011 2010 2009
Net Periodic Benefit CostService cost $ 158 $ 86 $ —Interest cost 9,879 9,514 9,530Expected return on plan assets (12,080) (11,437) (10,974)Amortization of net loss 1,800 1,115 963
Net periodic benefit $ (243) $ (722) $ (481)
Other Changes in Plan Assets and Benefit ObligationsRecognized in Other Comprehensive IncomeNet (gain)/loss $ 26,297 $ 3,048 $ 986Amortization of net loss (1,800) (1,115) (963)
Total recognized in other comprehensive income 24,497 1,933 23
Total recognized in net periodic benefit cost and othercomprehensive income $ 24,254 $ 1,211 $ (458)
The Company does not expect to amortize a net gain or loss in 2012. At December 31, 2011 and 2010, thePlan’s assets were comprised of listed common stocks and U.S. government and corporate securities, realestate and other. Included in the assets of the Plan were shares of Rollins, Inc. Common Stock with amarket value of $34.1 million and $30.3 million at December 31, 2011 and 2010, respectively.
62
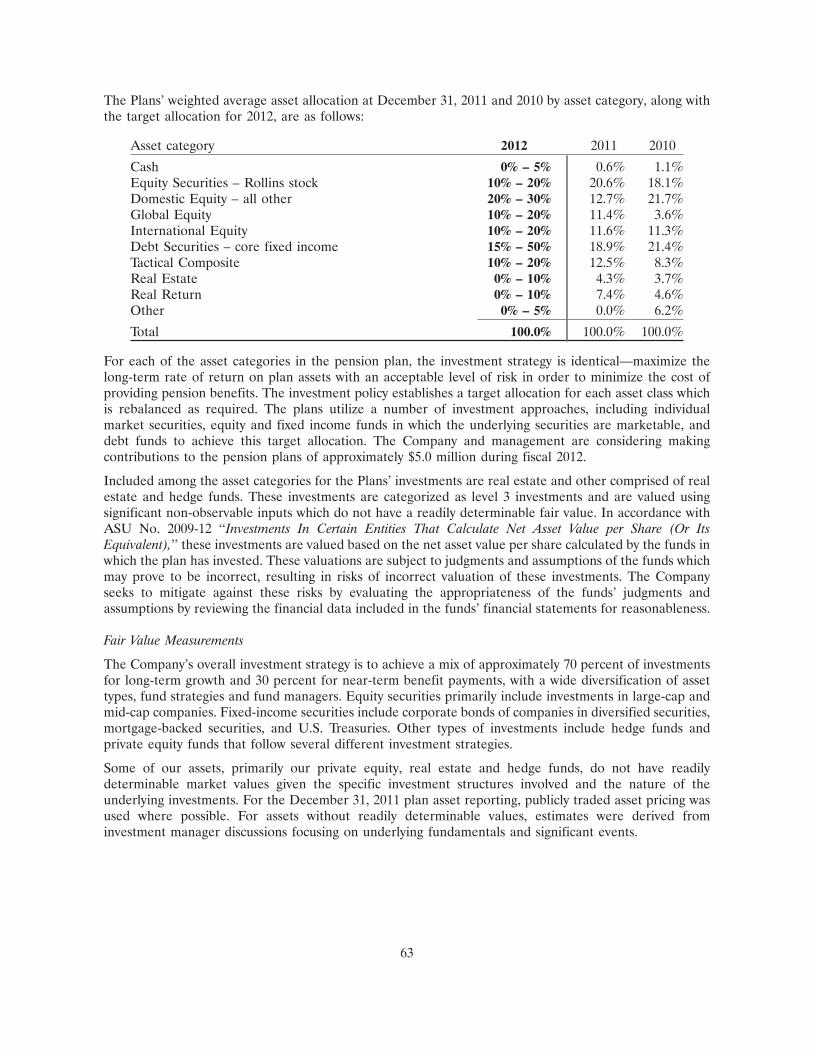
The Plans’ weighted average asset allocation at December 31, 2011 and 2010 by asset category, along withthe target allocation for 2012, are as follows:
Asset category 2012 2011 2010
Cash 0% – 5% 0.6% 1.1%Equity Securities – Rollins stock 10% – 20% 20.6% 18.1%Domestic Equity – all other 20% – 30% 12.7% 21.7%Global Equity 10% – 20% 11.4% 3.6%International Equity 10% – 20% 11.6% 11.3%Debt Securities – core fixed income 15% – 50% 18.9% 21.4%Tactical Composite 10% – 20% 12.5% 8.3%Real Estate 0% – 10% 4.3% 3.7%Real Return 0% – 10% 7.4% 4.6%Other 0% – 5% 0.0% 6.2%
Total 100.0% 100.0% 100.0%
For each of the asset categories in the pension plan, the investment strategy is identical—maximize thelong-term rate of return on plan assets with an acceptable level of risk in order to minimize the cost ofproviding pension benefits. The investment policy establishes a target allocation for each asset class whichis rebalanced as required. The plans utilize a number of investment approaches, including individualmarket securities, equity and fixed income funds in which the underlying securities are marketable, anddebt funds to achieve this target allocation. The Company and management are considering makingcontributions to the pension plans of approximately $5.0 million during fiscal 2012.
Included among the asset categories for the Plans’ investments are real estate and other comprised of realestate and hedge funds. These investments are categorized as level 3 investments and are valued usingsignificant non-observable inputs which do not have a readily determinable fair value. In accordance withASU No. 2009-12 ‘‘Investments In Certain Entities That Calculate Net Asset Value per Share (Or ItsEquivalent),’’ these investments are valued based on the net asset value per share calculated by the funds inwhich the plan has invested. These valuations are subject to judgments and assumptions of the funds whichmay prove to be incorrect, resulting in risks of incorrect valuation of these investments. The Companyseeks to mitigate against these risks by evaluating the appropriateness of the funds’ judgments andassumptions by reviewing the financial data included in the funds’ financial statements for reasonableness.
Fair Value Measurements
The Company’s overall investment strategy is to achieve a mix of approximately 70 percent of investmentsfor long-term growth and 30 percent for near-term benefit payments, with a wide diversification of assettypes, fund strategies and fund managers. Equity securities primarily include investments in large-cap andmid-cap companies. Fixed-income securities include corporate bonds of companies in diversified securities,mortgage-backed securities, and U.S. Treasuries. Other types of investments include hedge funds andprivate equity funds that follow several different investment strategies.
Some of our assets, primarily our private equity, real estate and hedge funds, do not have readilydeterminable market values given the specific investment structures involved and the nature of theunderlying investments. For the December 31, 2011 plan asset reporting, publicly traded asset pricing wasused where possible. For assets without readily determinable values, estimates were derived frominvestment manager discussions focusing on underlying fundamentals and significant events.
63
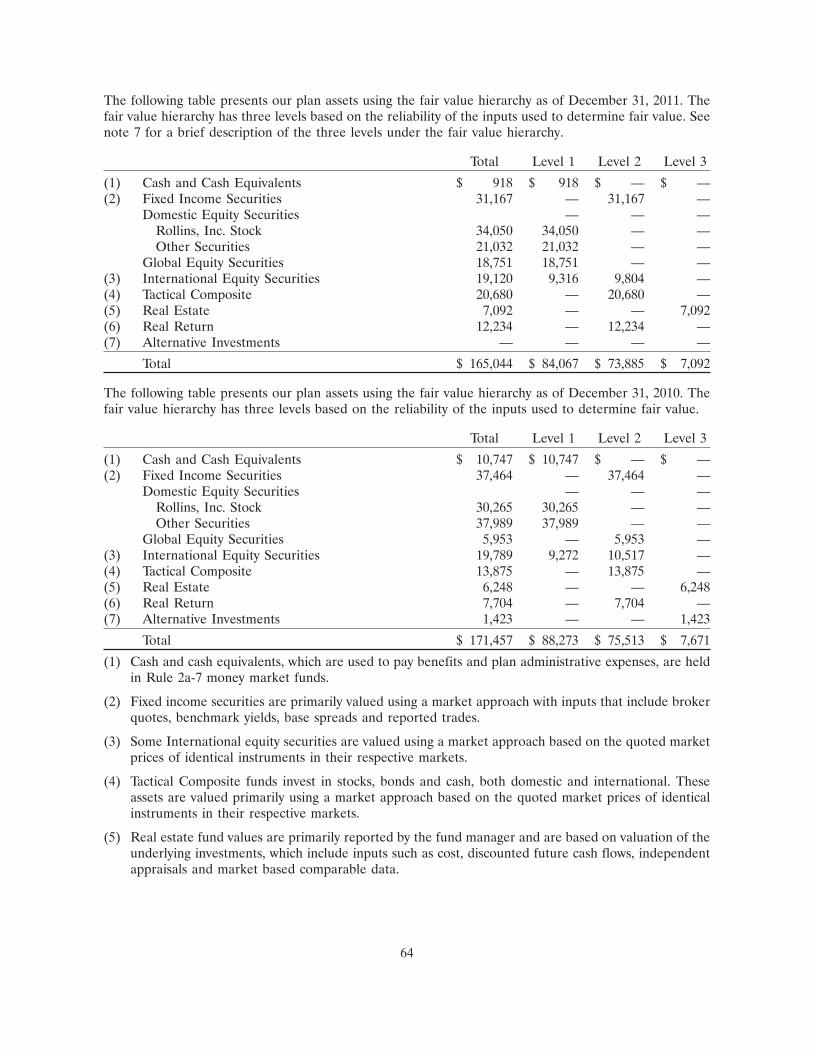
The following table presents our plan assets using the fair value hierarchy as of December 31, 2011. Thefair value hierarchy has three levels based on the reliability of the inputs used to determine fair value. Seenote 7 for a brief description of the three levels under the fair value hierarchy.
Total Level 1 Level 2 Level 3
(1) Cash and Cash Equivalents $ 918 $ 918 $ — $ —(2) Fixed Income Securities 31,167 — 31,167 —
Domestic Equity Securities — — —Rollins, Inc. Stock 34,050 34,050 — —Other Securities 21,032 21,032 — —
Global Equity Securities 18,751 18,751 — —(3) International Equity Securities 19,120 9,316 9,804 —(4) Tactical Composite 20,680 — 20,680 —(5) Real Estate 7,092 — — 7,092(6) Real Return 12,234 — 12,234 —(7) Alternative Investments — — — —
Total $ 165,044 $ 84,067 $ 73,885 $ 7,092
The following table presents our plan assets using the fair value hierarchy as of December 31, 2010. Thefair value hierarchy has three levels based on the reliability of the inputs used to determine fair value.
Total Level 1 Level 2 Level 3
(1) Cash and Cash Equivalents $ 10,747 $ 10,747 $ — $ —(2) Fixed Income Securities 37,464 — 37,464 —
Domestic Equity Securities — — —Rollins, Inc. Stock 30,265 30,265 — —Other Securities 37,989 37,989 — —
Global Equity Securities 5,953 — 5,953 —(3) International Equity Securities 19,789 9,272 10,517 —(4) Tactical Composite 13,875 — 13,875 —(5) Real Estate 6,248 — — 6,248(6) Real Return 7,704 — 7,704 —(7) Alternative Investments 1,423 — — 1,423
Total $ 171,457 $ 88,273 $ 75,513 $ 7,671
(1) Cash and cash equivalents, which are used to pay benefits and plan administrative expenses, are heldin Rule 2a-7 money market funds.
(2) Fixed income securities are primarily valued using a market approach with inputs that include brokerquotes, benchmark yields, base spreads and reported trades.
(3) Some International equity securities are valued using a market approach based on the quoted marketprices of identical instruments in their respective markets.
(4) Tactical Composite funds invest in stocks, bonds and cash, both domestic and international. Theseassets are valued primarily using a market approach based on the quoted market prices of identicalinstruments in their respective markets.
(5) Real estate fund values are primarily reported by the fund manager and are based on valuation of theunderlying investments, which include inputs such as cost, discounted future cash flows, independentappraisals and market based comparable data.
64
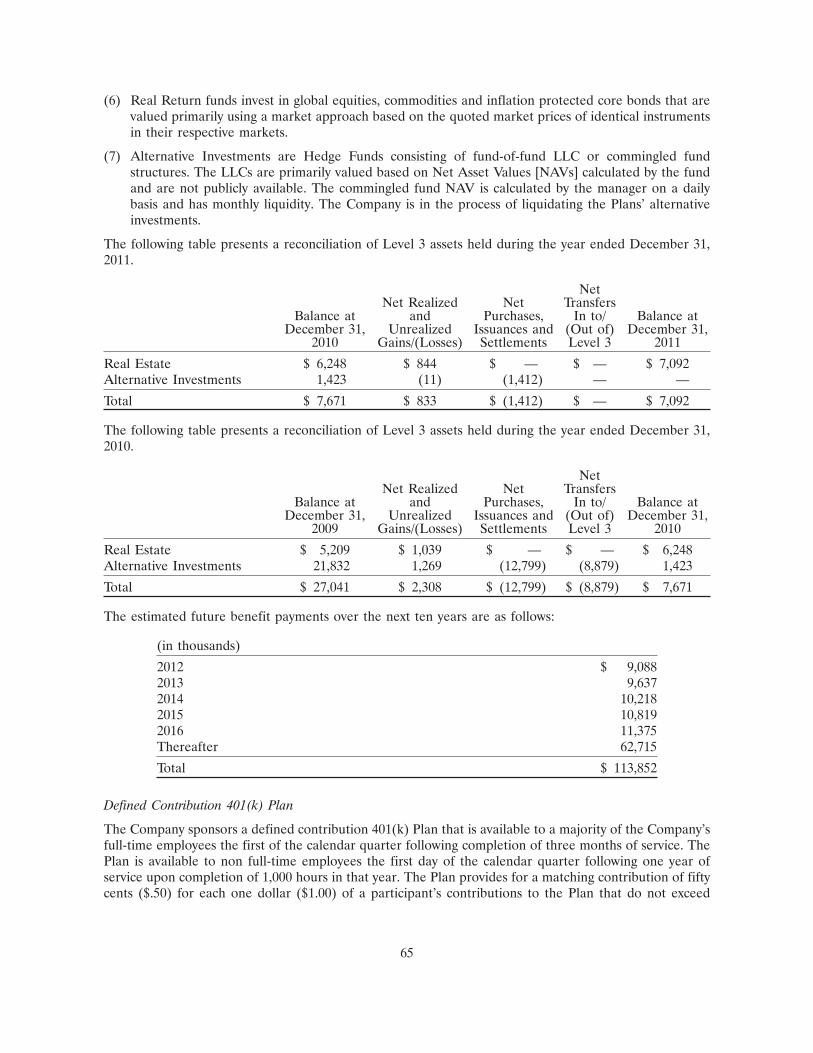
(6) Real Return funds invest in global equities, commodities and inflation protected core bonds that arevalued primarily using a market approach based on the quoted market prices of identical instrumentsin their respective markets.
(7) Alternative Investments are Hedge Funds consisting of fund-of-fund LLC or commingled fundstructures. The LLCs are primarily valued based on Net Asset Values [NAVs] calculated by the fundand are not publicly available. The commingled fund NAV is calculated by the manager on a dailybasis and has monthly liquidity. The Company is in the process of liquidating the Plans’ alternativeinvestments.
The following table presents a reconciliation of Level 3 assets held during the year ended December 31,2011.
NetNet Realized Net Transfers
Balance at and Purchases, In to/ Balance atDecember 31, Unrealized Issuances and (Out of) December 31,
2010 Gains/(Losses) Settlements Level 3 2011
Real Estate $ 6,248 $ 844 $ — $ — $ 7,092Alternative Investments 1,423 (11) (1,412) — —
Total $ 7,671 $ 833 $ (1,412) $ — $ 7,092
The following table presents a reconciliation of Level 3 assets held during the year ended December 31,2010.
NetNet Realized Net Transfers
Balance at and Purchases, In to/ Balance atDecember 31, Unrealized Issuances and (Out of) December 31,
2009 Gains/(Losses) Settlements Level 3 2010
Real Estate $ 5,209 $ 1,039 $ — $ — $ 6,248Alternative Investments 21,832 1,269 (12,799) (8,879) 1,423
Total $ 27,041 $ 2,308 $ (12,799) $ (8,879) $ 7,671
The estimated future benefit payments over the next ten years are as follows:
(in thousands)
2012 $ 9,0882013 9,6372014 10,2182015 10,8192016 11,375Thereafter 62,715
Total $ 113,852
Defined Contribution 401(k) Plan
The Company sponsors a defined contribution 401(k) Plan that is available to a majority of the Company’sfull-time employees the first of the calendar quarter following completion of three months of service. ThePlan is available to non full-time employees the first day of the calendar quarter following one year ofservice upon completion of 1,000 hours in that year. The Plan provides for a matching contribution of fiftycents ($.50) for each one dollar ($1.00) of a participant’s contributions to the Plan that do not exceed
65
6 percent of his or her eligible compensation (which includes commissions, overtime and bonuses). Thecharge to expense for the Company match was approximately $7.0 million for the years endedDecember 31, 2011 and 2010 and $6.6 million for the year ended December 31, 2009. At December 31,2011, 2010 and 2009 approximately, 35.5%, 35.1% and 29.3%, respectively of the plan assets consisted ofRollins, Inc. Common Stock. Total administrative fees paid by the Company for the Plan wereapproximately $42 thousand in 2011, $52 thousand in 2010 and $91 thousand in 2009.
Nonqualified Deferred Compensation Plan
The Deferred Compensation Plan provides that participants may defer up to 50% of their base salary andup to 85% of their annual bonus with respect to any given plan year, subject to a $2,000 per plan yearminimum. The Company may make discretionary contributions to participant accounts. The Companycurrently plans to credit accounts of participants of long service to the Company with certain discretionaryamounts (‘‘Pension Plan Benefit Restoration Contributions’’) in lieu of benefits that previously accruedunder the Company’s Retirement Income Plan up to a maximum of $245,000. The Company intends tomake Pension Plan Benefit Restoration Contributions under the Deferred Compensation Plan for fiveyears. The first contribution was made in January 2007 for those participants who were employed for all ofthe 2006 plan year. Only employees with five full years of vested service on June 30, 2005 qualify forPension Plan Benefit Restoration Contributions. Under the Deferred Compensation Plan, salary andbonus deferrals and Pension Plan Benefit Restoration Contributions are fully vested. Any discretionarycontributions are subject to vesting in accordance with the matching contribution vesting schedule set forthin the Rollins 401(k) Plan in which a participant participates. The Company made its last contributionsassociated with this plan during the first quarter of 2011.
Accounts will be credited with hypothetical earnings, and/or debited with hypothetical losses, based on theperformance of certain ‘‘Measurement Funds.’’ Account values are calculated as if the funds from deferralsand Company credits had been converted into shares or other ownership units of selected MeasurementFunds by purchasing (or selling, where relevant) such shares or units at the current purchase price of therelevant Measurement Fund at the time of the participant’s selection. Deferred Compensation Planbenefits are unsecured general obligations of the Company to the participants, and these obligations rankin parity with the Company’s other unsecured and unsubordinated indebtedness. The Company hasestablished a ‘‘rabbi trust,’’ which it uses to voluntarily set aside amounts to indirectly fund any obligationsunder the Deferred Compensation Plan. To the extent that the Company’s obligations under the DeferredCompensation Plan exceed assets available under the trust, the Company would be required to seekadditional funding sources to fund its liability under the Deferred Compensation Plan.
Generally, the Deferred Compensation Plan provides for distributions of any deferred amounts upon theearliest to occur of a participant’s death, disability, retirement or other termination of employment (a‘‘Termination Event’’). However, for any deferrals of salary and bonus (but not Company contributions),participants would be entitled to designate a distribution date which is prior to a Termination Event.Generally, the Deferred Compensation Plan allows a participant to elect to receive distributions under theDeferred Compensation Plan in installments or lump-sum payments.
At December 31, 2011 the Deferred Compensation Plan had 41 life insurance policies with a net face valueof $38.5 million. The cash surrender value of these life insurance policies were worth $9.8 million and$9.4 million at December 31, 2011 and 2010, respectively.
66
The estimated life insurance premium payments over the next five years are as follows:
(in thousands)
2012 $ 1,6312013 1,6982014 1,8012015 1,8102016 1,690
Total $ 8,630
Total expense/(income) related to deferred compensation was $218 thousand, $130 thousand and$22 thousand in 2011, 2010, and 2009, respectively. The Company had $10.1 million in deferredcompensation assets as of December 31, 2011 and 2010, respectively, located within other assets on theCompany’s consolidated statements of financial position and $9.8 million and $9.9 million in deferredcompensation liability as of December 31, 2011 and 2010, respectively, located within long-term accruedliabilities on the Company’s consolidated statements of financial position. The amounts of assets weremarked to fair value.
Stock Compensation Plans
All share and per share data has been adjusted for the three-for-two stock split effective December 10,2010.
Stock options and time lapse restricted shares (TLRSs) have been issued to officers and othermanagement employees under the Company’s Employee Stock Incentive Plan. The Company’s stockoptions generally vest over a five-year period and expire ten years from the issuance date.
TLRSs provide for the issuance of a share of the Company’s Common Stock at no cost to the holder andgenerally vest after a certain stipulated number of years from the grant date, depending on the terms of theissue. The Company issued TLRSs that vest over ten years prior to 2004. TLRSs issued 2004 and later vestin 20 percent increments starting with the second anniversary of the grant, over six years from the date ofgrant. During these years, grantees receive all dividends declared and retain voting rights for the grantedshares. The agreements under which the restricted stock is issued provide that shares awarded may not besold or otherwise transferred until restrictions established under the plans have lapsed.
For the year ended December 31, 2011, the Company issued approximately 0.1 million shares of commonstock upon exercise of stock options by employees and issued 0.5 million shares in 2010. In addition, theCompany issued time lapse restricted shares of 0.7 million, 0.9 million and 0.7 million for the years endedDecember 31, 2011, 2010 and 2009, respectively.
The Company issues new shares from its authorized but unissued share pool. At December 31, 2011,approximately 5.2 million shares of the Company’s common stock were reserved for issuance. Inaccordance with FASB ASC Topic 718, ‘‘Compensation—Stock Compensation.’’ The Company uses themodified prospective application method of adoption, which requires the Company to recordcompensation cost, related to unvested stock awards as of December 31, 2005 by recognizing theunamortized grant date fair value of these awards over the remaining service periods of those awards withno change in historical reported earnings. Awards granted after December 31, 2005 are valued at fair valueand recognized on a straight line basis over the service periods of each award. The Company estimatesrestricted share forfeiture rates based on its historical experience.
In order to estimate the fair value of stock options, the Company used the Black-Scholes option valuationmodel, which was developed for use in estimating the fair value of publicly traded options, which have no
67
vesting restrictions and are fully transferable. Option valuation models require the input of highlysubjective assumptions and these assumptions can vary over time.
The following table summarizes the components of the Company’s stock-based compensation programsrecorded as expense ($ in thousands):
Twelve months endedDecember 31,
2011 2010 2009
Time Lapse Restricted Stock:Pre-tax compensation expense $ 7,555 $ 7,538 $ 5,800Tax benefit (2,909) (2,902) (2,233)
Restricted stock expense, net of tax $ 4,646 $ 4,636 $ 3,567
As of December 31, 2011, $24.4 million of total unrecognized compensation cost related to time-lapserestricted shares is expected to be recognized over a weighted average period of approximately 4.1 years.
Option activity under the Company’s stock option plan as of December 31, 2011, 2010 and 2009 andchanges during the year ended December 31, 2011 were as follows:
WeightedAverage
Weighted RemainingAverage Contractual AggregateExercise Term Intrinsic
Shares Price (in years) Value
Outstanding at December 31, 2008 986 $ 4.71 3.39 $ 7,236Exercised (328) 4.84Forfeited (5) 3.22
Outstanding at December 31, 2009 653 4.67 2.44 5,348Exercised (517) 4.67
Outstanding at December 31, 2010 136 4.66 1.59 2,056Exercised (103) 4.48
Outstanding at December 31, 2011 33 $ 5.26 0.93 $ 553
Exercisable at December 31, 2011 33 $ 5.26 0.93 $ 553
The aggregate intrinsic value in the table above represents the total pre-tax intrinsic value (the differencebetween the Company’s closing stock price on the last trading day of the year and the exercise price,multiplied by the number of in-the-money options) that would have been received by the option holdershad all option holders exercised their options on that day. The amount of aggregate intrinsic value willchange based on the fair market value of the Company’s stock.
The aggregate intrinsic value of options exercised during the years ended December 31, 2011, 2010 and2009 was $1.7 million, $5.2 million and $2.4 million, respectively. Exercise of options during the yearsended December 31, 2011, 2010 and 2009 resulted in cash receipts of $0.1 million, $0.3 million and $0.5,respectively.
68
The following table summarizes information on unvested restricted stock units outstanding as ofDecember 31, 2011, 2010 and 2009:
Number of Weighted-AverageShares Grant-Date
(in thousands) Fair Value
Unvested Restricted Stock GrantsUnvested as of December 31, 2008 2,453 $ 9.80Forfeited (26) 9.48Vested (412) 8.51Granted 721 10.99
Unvested as of December 31, 2009 2,737 10.31Forfeited (277) 10.99Vested (666) 9.51Granted 871 12.32
Unvested as of December 31, 2010 2,664 11.09Forfeited (74) 12.90Vested (574) 10.08Granted 670 19.30
Unvested as of December 31, 2011 2,686 $ 13.31
14. ACCUMULATED OTHER COMPREHENSIVE INCOME/(LOSS)
Accumulated other comprehensive income/(loss) consist of the following (in thousands):
Pension ForeignLiability Currency
Adjustment Translation Total
Balance at December 31, 2009 $ (36,888) $ 4,761 $ (32,127)Change during 2010:Before-tax amount (1,933) 1,343 (590)Tax benefit/(expense) 744 (517) 227
(1,189) 826 (363)
Balance at December 31, 2010 (38,077) 5,587 (32,490)
Change during 2011:Before-tax amount (24,497) (1,125) (25,622)Tax benefit 9,605 417 10,022
(14,892) (708) (15,600)
Balance at December 31, 2011 $ (52,969) $ 4,879 $ (48,090)
15. RELATED PARTY TRANSACTIONS
The Company provides certain administrative services to RPC, Inc. (‘‘RPC’’) (a company of whichMr. R. Randall Rollins is also Chairman and which is otherwise affiliated with the Company). The serviceagreements between RPC and the Company provide for the provision of services on a cost reimbursementbasis and are terminable on six months notice. The services covered by these agreements includeadministration of certain employee benefit programs, and other administrative services. Charges to RPC(or to corporations which are subsidiaries of RPC) for such services and rent totaled less than $0.1 millionfor the years ended December 31, 2011, 2010 and 2009.
69
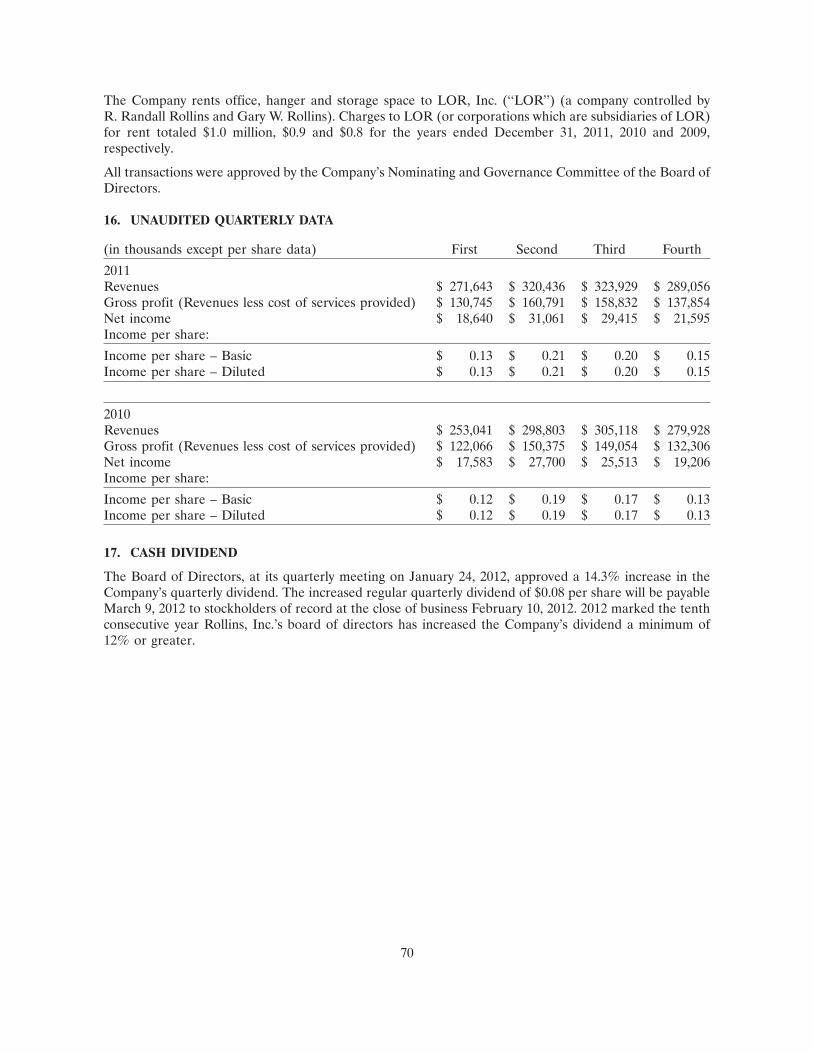
The Company rents office, hanger and storage space to LOR, Inc. (‘‘LOR’’) (a company controlled byR. Randall Rollins and Gary W. Rollins). Charges to LOR (or corporations which are subsidiaries of LOR)for rent totaled $1.0 million, $0.9 and $0.8 for the years ended December 31, 2011, 2010 and 2009,respectively.
All transactions were approved by the Company’s Nominating and Governance Committee of the Board ofDirectors.
16. UNAUDITED QUARTERLY DATA
(in thousands except per share data) First Second Third Fourth
2011Revenues $ 271,643 $ 320,436 $ 323,929 $ 289,056Gross profit (Revenues less cost of services provided) $ 130,745 $ 160,791 $ 158,832 $ 137,854Net income $ 18,640 $ 31,061 $ 29,415 $ 21,595Income per share:
Income per share – Basic $ 0.13 $ 0.21 $ 0.20 $ 0.15Income per share – Diluted $ 0.13 $ 0.21 $ 0.20 $ 0.15
2010Revenues $ 253,041 $ 298,803 $ 305,118 $ 279,928Gross profit (Revenues less cost of services provided) $ 122,066 $ 150,375 $ 149,054 $ 132,306Net income $ 17,583 $ 27,700 $ 25,513 $ 19,206Income per share:
Income per share – Basic $ 0.12 $ 0.19 $ 0.17 $ 0.13Income per share – Diluted $ 0.12 $ 0.19 $ 0.17 $ 0.13
17. CASH DIVIDEND
The Board of Directors, at its quarterly meeting on January 24, 2012, approved a 14.3% increase in theCompany’s quarterly dividend. The increased regular quarterly dividend of $0.08 per share will be payableMarch 9, 2012 to stockholders of record at the close of business February 10, 2012. 2012 marked the tenthconsecutive year Rollins, Inc.’s board of directors has increased the Company’s dividend a minimum of12% or greater.
70
Item 9. Changes in and Disagreements with Accountants on Accounting and Financial Disclosures.
None
Item 9A. Controls and Procedures.
Evaluation of Disclosure Controls and Procedures—We have established disclosure controls and procedures toensure, among other things, that material information relating to the Company, including its consolidatedsubsidiaries, is made known to the officers who certify the Company’s financial reports and to othermembers of senior management and the Board of Directors.
Based on management’s evaluation as of December 31, 2011, in which the principal executive officer andprincipal financial officer of the Company participated, the principal executive officer and principalfinancial officer have concluded that the Company’s disclosure controls and procedures (as defined inRules 13a-15(e) and 15d-15(e) under the Securities Exchange Act of 1934) are effective, at the reasonableassurance level to ensure that the information required to be disclosed by the Company in the reports thatit files or submits under the Securities Exchange Act of 1934 is recorded, processed, summarized andreported within the time periods specified in SEC rules and forms.
Management’s Report on Internal Control Over Financial Reporting—Management’s Report on InternalControl Over Financial Reporting is contained on page 34.
Changes in Internal Controls—There were no changes in our internal control over financial reporting duringthe fourth quarter of 2011 that materially affected or are reasonably likely to materially affect thesecontrols.
Item 9B. Other Information.
None
PART III
Item 10. Directors, Executive Officers and Corporate Governance.
Information concerning directors and executive officers is included in the Company’s Proxy Statement forits 2012 Annual Meeting of Stockholders (the ‘‘Proxy Statement’’), in the section titled ‘‘Election ofDirectors.’’ This information is incorporated herein by reference. Information about executive officers iscontained on page 19 of this document.
Audit Committee and Audit Committee Financial Expert
Information concerning the Audit Committee of the Company and the Audit Committee FinancialExpert(s) is included in the Company’s Proxy Statement for its 2012 Annual Meeting of Stockholders, inthe section titled ‘‘Corporate Governance and Board of Directors’ Committees and Meetings—AuditCommittee.’’ This information is incorporated herein by reference.
Code of Ethics
The Company has adopted a Code of Business Conduct that applies to all employees. In addition, theCompany has adopted a Code of Business Conduct and Ethics for Directors and Executive Officer andRelated Party Transaction Policy. Both of these documents are available on the Company’s website atwww.rollins.com and a copy is available by writing to Investor Relations at 2170 Piedmont Road, AtlantaGeorgia 30324. The Company intends to satisfy the disclosure requirement under Item 10 of Form 8-Kregarding an amendment to, or waiver from, a provision of its code of ethics that relates to any elements ofthe code of ethics definition enumerated in SEC rules by posting such information on its internet website,the address of which is provided above.
71
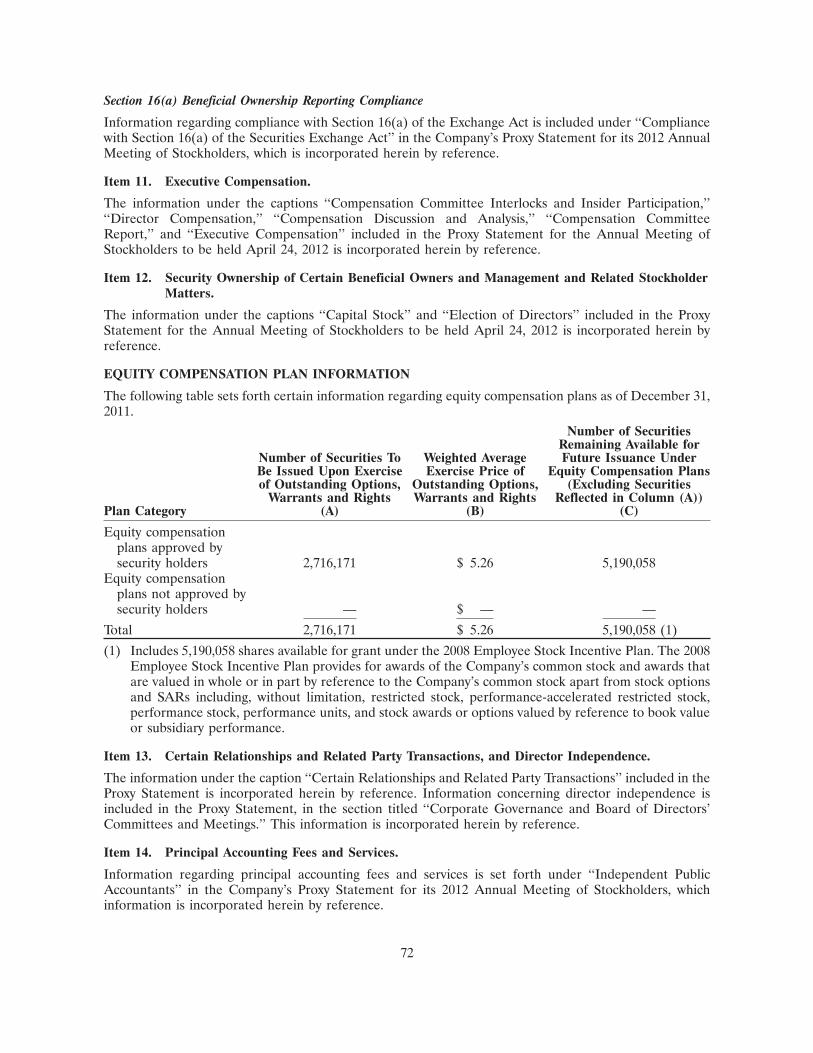
Section 16(a) Beneficial Ownership Reporting Compliance
Information regarding compliance with Section 16(a) of the Exchange Act is included under ‘‘Compliancewith Section 16(a) of the Securities Exchange Act’’ in the Company’s Proxy Statement for its 2012 AnnualMeeting of Stockholders, which is incorporated herein by reference.
Item 11. Executive Compensation.
The information under the captions ‘‘Compensation Committee Interlocks and Insider Participation,’’‘‘Director Compensation,’’ ‘‘Compensation Discussion and Analysis,’’ ‘‘Compensation CommitteeReport,’’ and ‘‘Executive Compensation’’ included in the Proxy Statement for the Annual Meeting ofStockholders to be held April 24, 2012 is incorporated herein by reference.
Item 12. Security Ownership of Certain Beneficial Owners and Management and Related StockholderMatters.
The information under the captions ‘‘Capital Stock’’ and ‘‘Election of Directors’’ included in the ProxyStatement for the Annual Meeting of Stockholders to be held April 24, 2012 is incorporated herein byreference.
EQUITY COMPENSATION PLAN INFORMATION
The following table sets forth certain information regarding equity compensation plans as of December 31,2011.
Number of SecuritiesRemaining Available for
Number of Securities To Weighted Average Future Issuance UnderBe Issued Upon Exercise Exercise Price of Equity Compensation Plansof Outstanding Options, Outstanding Options, (Excluding Securities
Warrants and Rights Warrants and Rights Reflected in Column (A))Plan Category (A) (B) (C)
Equity compensationplans approved bysecurity holders 2,716,171 $ 5.26 5,190,058
Equity compensationplans not approved bysecurity holders — $ — —
Total 2,716,171 $ 5.26 5,190,058 (1)
(1) Includes 5,190,058 shares available for grant under the 2008 Employee Stock Incentive Plan. The 2008Employee Stock Incentive Plan provides for awards of the Company’s common stock and awards thatare valued in whole or in part by reference to the Company’s common stock apart from stock optionsand SARs including, without limitation, restricted stock, performance-accelerated restricted stock,performance stock, performance units, and stock awards or options valued by reference to book valueor subsidiary performance.
Item 13. Certain Relationships and Related Party Transactions, and Director Independence.
The information under the caption ‘‘Certain Relationships and Related Party Transactions’’ included in theProxy Statement is incorporated herein by reference. Information concerning director independence isincluded in the Proxy Statement, in the section titled ‘‘Corporate Governance and Board of Directors’Committees and Meetings.’’ This information is incorporated herein by reference.
Item 14. Principal Accounting Fees and Services.
Information regarding principal accounting fees and services is set forth under ‘‘Independent PublicAccountants’’ in the Company’s Proxy Statement for its 2012 Annual Meeting of Stockholders, whichinformation is incorporated herein by reference.
72
PART IV
Item 15. Exhibits and Financial Statement Schedules, and Reports on Form 8-K.
(a) Consolidated Financial Statements, Financial Statement Schedule and Exhibits.
1. Consolidated financial statements listed in the accompanying Index to ConsolidatedFinancial Statements and Schedule are filed as part of this report.
2. The financial statement schedule listed in the accompanying Index to Consolidated FinancialStatements and Schedule is filed as part of this report.
3. Exhibits listed in the accompanying Index to Exhibits are filed as part of this report. Thefollowing such exhibits are management contracts or compensatory plans or arrangements:
(10)(a) Rollins, Inc. 1994 Employee Stock Incentive Plan incorporated herein byreference to Exhibit (10)(b) as filed with its Form 10-K for the year endedDecember 31, 1999.
(10)(b) Rollins, Inc. 1998 Employee Stock Incentive Plan incorporated herein byreference to Exhibit A of the March 24, 1998 Proxy Statement for the AnnualMeeting of Stockholders held on April 28, 1998.
(10)(c) Rollins, Inc. Form of Restricted Stock Agreement incorporated herein byreference to Exhibit (10)(c) as filed with its Form 10-K for the year endedDecember 31, 2004.
(10)(d) Rollins, Inc. Form of Option Agreement incorporated herein by reference toExhibit (10)(d) as filed with its Form 10-K for the year ended December 31,2004.
(10)(e) Rollins, Inc. Amended and Restated Deferred Compensation Plan,incorporated herein by reference to Exhibit 4.1 filed with the registrant’sForm S-8 filed November 18, 2005.
(10)(f) Form of Plan Agreement pursuant to the Rollins, Inc. Amended and RestatedDeferred Compensation Plan, incorporated herein by reference to Exhibit 4.2filed with the registrant’s Form S-8 filed November 18, 2005.
(10)(g) Amendment to 1994 and 1998 Stock Incentive Plans incorporated herein byreference to Exhibit 10.1 as filed with its Form 10-Q for the quarter endedSeptember 30, 2010.
(10)(h) Written description of Rollins, Inc. Performance-Based Incentive CashCompensation Plan incorporated herein by reference to Exhibit 10(a) as filedwith its Form 8-K dated April 22, 2008.
(10)(i) Forms of award agreements under the 2008 Cash Incentive Plan incorporatedherein by reference to Exhibit 10(b) of its Form 8-K dated April 22, 2008.
(10)(j) 2008 Stock Incentive Plan incorporated herein by reference to Exhibit A of theMarch 17, 2008 Proxy Statement for the Annual Meeting of the Stockholdersheld on April 22, 2008.
(10)(k) Form of Restricted Stock Grant Agreement incorporated herein by referenceto Exhibit 10(d) as filed with its Form 8-K dated April 22, 2008.
(10)(m) Summary of Compensation Arrangements with Executive Officers.(10)(n) Summary of Compensation Arrangements with Directors.
(b) Exhibits (inclusive of item 3 above):
(3)(i) (A) Restated Certificate of Incorporation of Rollins, Inc. dated July 28, 1981,incorporated herein by reference to Exhibit (3)(i)(A) as filed with theregistrant’s Form 10-Q filed August 1, 2005.
73
(B) Certificate of Amendment of Certificate of Incorporation of Rollins, Inc.dated August 20, 1987, incorporated herein by reference to Exhibit 3(i)(B)filed with the registrant’s 10-K filed March 11, 2005.(C) Certificate of Change of Location of Registered Office and of RegisteredAgent dated March 22, 1994, incorporated herein by reference toExhibit (3)(i)(C) filed with the registrant’s Form 10-Q filed August 1, 2005.(D) Certificate of Amendment of Certificate of Incorporation of Rollins, Inc.dated April 25, 2006, incorporated herein by reference to Exhibit 3(i)(D) filedwith the registrant’s 10-Q filed October 31, 2006(E) Certificate of Amendment of Certificate of Incorporation of Rollins, Inc.dated April, 26, 2011, incorporated herein by reference to Exhibit (3)(i)(E) asfiled with the Registrant’s 10-Q filed October 28, 2011.
(ii) Revised By-laws of Rollins, Inc. dated October 23, 2007, incorporated hereinby reference to Exhibit (3) (i) as filed with its Form 8-K dated October 23,2007.
(4) Form of Common Stock Certificate of Rollins, Inc. incorporated herein byreference to Exhibit (4) as filed with its Form 10-K for the year endedDecember 31, 1998.
(10)(a) Rollins, Inc. 1994 Employee Stock Incentive Plan incorporated herein byreference to Exhibit (10)(b) as filed with its Form 10-K for the year endedDecember 31, 1999.
(10)(b) Rollins, Inc. 1998 Employee Stock Incentive Plan incorporated herein byreference to Exhibit A of the March 24, 1998 Proxy Statement for the AnnualMeeting of Stockholders held on April 28, 1998.
(10)(c) Rollins, Inc. Form of Restricted Stock Agreement incorporated herein byreference to Exhibit (10)(c) as filed with its Form 10-K for the year endedDecember 31, 2004.
(10)(d) Rollins, Inc. Form of Option Agreement incorporated herein by reference toExhibit (10)(d) as filed with its Form 10-K for the year ended December 31,2004.
(10)(e) Rollins, Inc. Amended and Restated Deferred Compensation Plan,incorporated herein by reference to Exhibit 4.1 filed with the registrant’sForm S-8 filed November 18, 2005.
(10)(f) Form of Plan Agreement pursuant to the Rollins, Inc. Amended and RestatedDeferred Compensation Plan, incorporated herein by reference to Exhibit 4.2filed with the registrant’s Form S-8 filed November 18, 2005.
(10)(g) Amendment to 1994 and 1998 Stock Incentive Plans incorporated herein byreference to Exhibit 10(r) as filed with its Form 10-K for the year endedDecember 31, 2006.
(10)(h) Written description of Rollins, Inc. Performance-Based Incentive CashCompensation Plan incorporated herein by reference to Exhibit 10(a) as filedwith its Form 8-K dated April 22, 2008.
(10)(i) Forms of award agreements under the 2008 Cash Incentive Plan incorporatedherein by reference to Exhibit 10(b) of its Form 8-K dated April 22, 2008.
(10)(j) 2008 Stock Incentive Plan incorporated herein by reference to Exhibit A of theMarch 17, 2008 Proxy Statement for the Annual Meeting of the Stockholdersheld on April 22, 2008.
(10)(k) Form of Restricted Stock Grant Agreement incorporated herein by referenceto Exhibit 10(d) as filed with its Form 8-K dated April 22, 2008.
74
(10)(l) Revolving Credit Agreement dated as of March 28, 2008 between Rollins, Inc.,SunTrust Bank and Bank of America, N.A., incorporated herein by referenceto Exhibit 10.2 as filed with its Form 10-Q for the quarter ended September 30,2010.
(10)(m) Summary of Compensation Arrangements with Executive Officers,incorporated herein reference to Exhibit (10)(q) as filed with its Form 10-K forthe year ended December 31, 2010.
(10)(n) Summary of Compensation Arrangements with Directors, incorporated hereinreference to Exhibit (10)(r) as filed with its Form 10-K for the year endedDecember 31, 2010.
(21) Subsidiaries of Registrant.(23.1) Consent of Grant Thornton LLP, Independent Registered Public Accounting
Firm.(24) Powers of Attorney for Directors.
(31.1) Certification of Chief Executive Officer Pursuant to Item 601(b)(31) ofRegulation S-K, as adopted pursuant to Section 302 of the Sarbanes-Oxley Actof 2002.
(31.2) Certification of Chief Financial Officer Pursuant to Item 601(b)(31) ofRegulation S-K, as adopted pursuant to Section 302 of the Sarbanes-Oxley Actof 2002.
(32.1) Certification of Chief Executive Officer and Chief Financial Officer Pursuantto 18 U.S.C. Section 1350, As Adopted Pursuant to Section 906 of theSarbanes-Oxley Act of 2002.
(101.INS) EX-101 Instance Document(101.SCH) EX-101 Schema Document(101.CAL) EX-101 Calculation Linkbase Document(101.LAB) EX-101 Labels Linkbase Document(101.PRE) EX-101 Presentation Linkbase Document(101.DEF) Ex-101 Definition Linkbase Document
75
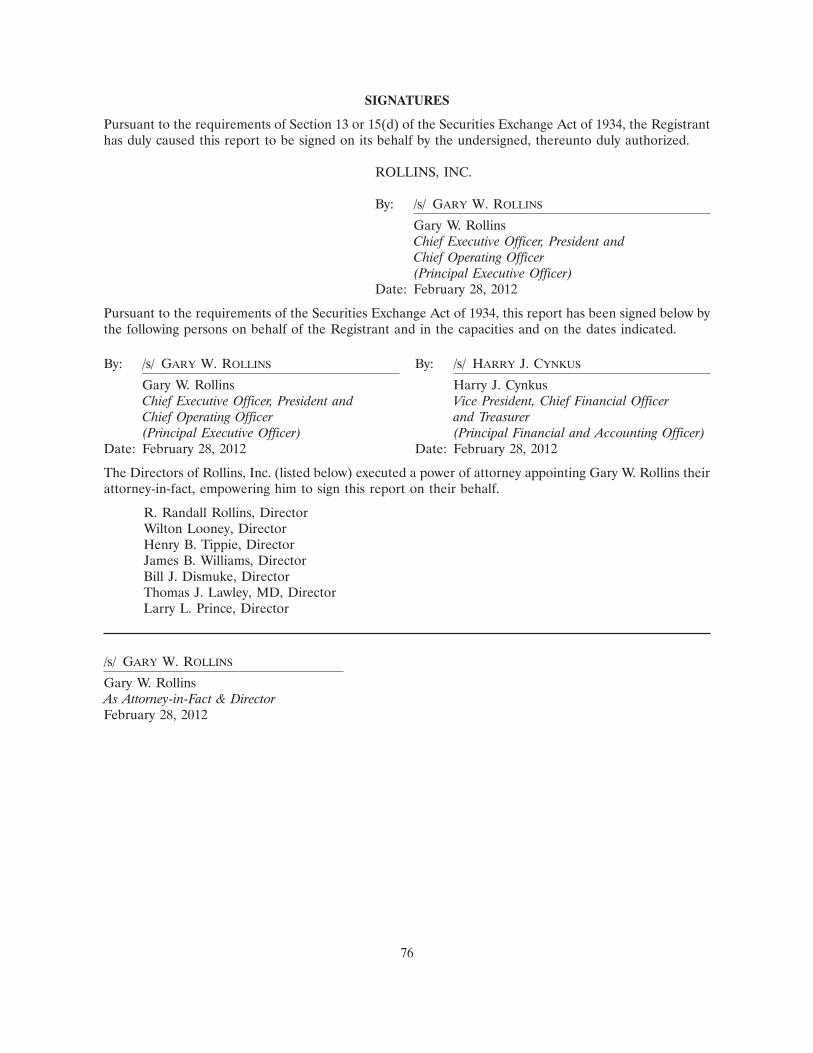
SIGNATURES
Pursuant to the requirements of Section 13 or 15(d) of the Securities Exchange Act of 1934, the Registranthas duly caused this report to be signed on its behalf by the undersigned, thereunto duly authorized.
ROLLINS, INC.
By: /s/ GARY W. ROLLINS
Gary W. RollinsChief Executive Officer, President andChief Operating Officer(Principal Executive Officer)
Date: February 28, 2012
Pursuant to the requirements of the Securities Exchange Act of 1934, this report has been signed below bythe following persons on behalf of the Registrant and in the capacities and on the dates indicated.
By: /s/ GARY W. ROLLINS By: /s/ HARRY J. CYNKUS
Gary W. Rollins Harry J. CynkusChief Executive Officer, President and Vice President, Chief Financial OfficerChief Operating Officer and Treasurer(Principal Executive Officer) (Principal Financial and Accounting Officer)
Date: February 28, 2012 Date: February 28, 2012
The Directors of Rollins, Inc. (listed below) executed a power of attorney appointing Gary W. Rollins theirattorney-in-fact, empowering him to sign this report on their behalf.
R. Randall Rollins, DirectorWilton Looney, DirectorHenry B. Tippie, DirectorJames B. Williams, DirectorBill J. Dismuke, DirectorThomas J. Lawley, MD, DirectorLarry L. Prince, Director
/s/ GARY W. ROLLINS
Gary W. RollinsAs Attorney-in-Fact & DirectorFebruary 28, 2012
76
ROLLINS, INC. AND SUBSIDIARIESINDEX TO CONSOLIDATED FINANCIAL STATEMENTS AND SCHEDULE
The following documents are filed as part of this report.
Page NumberFrom
This Form 10-K
Financial statements and reports
Management’s Report on Internal Control Over Financial Reporting 34
Report of Independent Registered Public Accounting Firm On Internal ControlOver Financial Reporting 35
Report of Independent Registered Public Accounting Firm on the ConsolidatedFinancial Statements 36
Consolidated Financial Statements
Consolidated Statements of Financial Position as of December 31, 2011 and 2010 37
Consolidated Statements of Income for each of the three years in the periodended December 31, 2011 38
Consolidated Statements of Comprehensive Earnings for each of the three yearsin the period ended December 31, 2011 39
Consolidated Statements of Stockholders’ Equity for each of the three years inthe period ended December 31, 2011 40
Consolidated Statements of Cash Flows for each of the three years in the periodended December 31, 2011 41
Notes to Consolidated Financial Statements 42-70
Financial Statement Schedules
Schedule II—Valuation and Qualifying Accounts 78
Schedules not listed above have been omitted as not applicable, immaterial ordisclosed in the Consolidated Financial Statements or notes thereto.
77
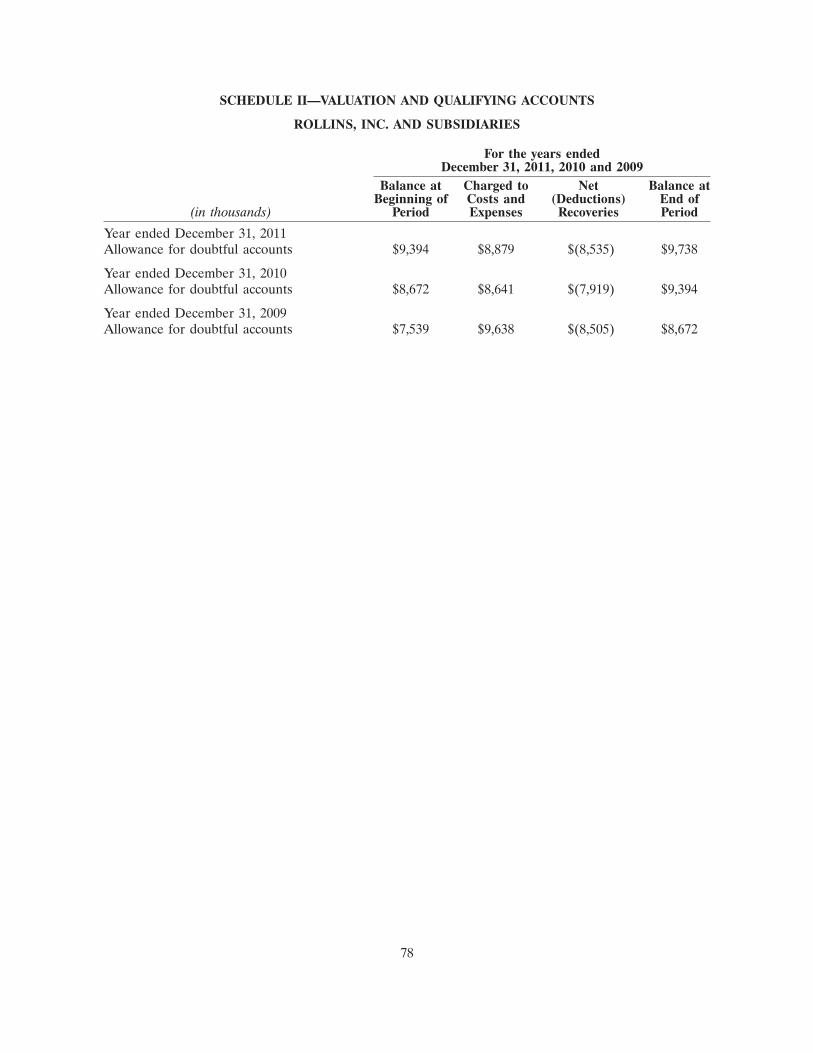
SCHEDULE II—VALUATION AND QUALIFYING ACCOUNTS
ROLLINS, INC. AND SUBSIDIARIES
For the years endedDecember 31, 2011, 2010 and 2009
Balance at Charged to Net Balance atBeginning of Costs and (Deductions) End of
(in thousands) Period Expenses Recoveries Period
Year ended December 31, 2011Allowance for doubtful accounts $9,394 $8,879 $(8,535) $9,738
Year ended December 31, 2010Allowance for doubtful accounts $8,672 $8,641 $(7,919) $9,394
Year ended December 31, 2009Allowance for doubtful accounts $7,539 $9,638 $(8,505) $8,672
78
ROLLINS, INC. AND SUBSIDIARIESINDEX TO EXHIBITS
ExhibitNumber Exhibit Description
(3)(i) (A) Restated Certificate of Incorporation of Rollins, Inc. dated July 28, 1981, incorporatedherein by reference to Exhibit (3)(i)(A) as filed with the registrant’s Form 10-Q filed August 1,2005.
(B) Certificate of Amendment of Certificate of Incorporation of Rollins, Inc. dated August 20,1987, incorporated herein by reference to Exhibit 3(i)(B) filed with the registrant’s 10-K filedMarch 11, 2005.
(C) Certificate of Change of Location of Registered Office and of Registered Agent datedMarch 22, 1994, incorporated herein by reference to Exhibit (3)(i)(C) filed with theregistrant’s Form 10-Q filed August 1, 2005.
(D) Certificate of Amendment of Certificate of Incorporation of Rollins, Inc. dated April 25,2006, incorporated herein by reference to Exhibit 3(i)(D) filed with the registrant’s 10-Q filedOctober 31, 2006.
(E) Certificate of Amendment of Certificate of Incorporation of Rollins, Inc. dated April, 26,2011, incorporated herein by reference to Exhibit (3)(i)(E) as filed with the Registrant’s 10-Qfiled October 28, 2011.
(ii) Revised By-laws of Rollins, Inc. dated October 23, 2007, incorporated herein by reference toExhibit (3) (i) as filed with its Form 8-K dated October 23, 2007.
(4) Form of Common Stock Certificate of Rollins, Inc. incorporated herein by reference toExhibit (4) as filed with its Form 10-K for the year ended December 31, 1998.
(10)(a) Rollins, Inc. 1994 Employee Stock Incentive Plan incorporated herein by reference toExhibit (10)(b) as filed with its Form 10-K for the year ended December 31, 1999.
(10)(b) Rollins, Inc. 1998 Employee Stock Incentive Plan incorporated herein by reference toExhibit A of the March 24, 1998 Proxy Statement for the Annual Meeting of Stockholders heldon April 28, 1998.
(10)(c) Rollins, Inc. Form of Restricted Stock Agreement incorporated herein by reference toExhibit (10)(c) as filed with its Form 10-K for the year ended December 31, 2004.
(10)(d) Rollins, Inc. Form of Option Agreement incorporated herein by reference to Exhibit (10)(d)as filed with its Form 10-K for the year ended December 31, 2004.
(10)(e) Rollins, Inc. Amended and Restated Deferred Compensation Plan, incorporated herein byreference to Exhibit 4.1 filed with the registrant’s Form S-8 filed November 18, 2005.
(10)(f) Form of Plan Agreement pursuant to the Rollins, Inc. Amended and Restated DeferredCompensation Plan, incorporated herein by reference to Exhibit 4.2 filed with the registrant’sForm S-8 filed November 18, 2005.
(10)(g) Amendment to 1994 and 1998 Stock Incentive Plans incorporated herein by reference toExhibit 10.1 as filed with its Form 10-Q for the quarter ended September 30, 2010.
(10)(h) Written description of Rollins, Inc. Performance-Based Incentive Cash Compensation Planincorporated herein by reference to Exhibit 10(a) as filed with its Form 8-K dated April 22,2008.
79
ExhibitNumber Exhibit Description
(10)(i) Forms of award agreements under the 2008 Cash Incentive Plan incorporated herein byreference to Exhibit 10(b) of its Form 8-K dated April 22, 2008.
(10)(j) 2008 Stock Incentive Plan incorporated herein by reference to Exhibit A of the March 17, 2008Proxy Statement for the Annual Meeting of the Stockholders held on April 22, 2008.
(10)(k) Form of Restricted Stock Grant Agreement incorporated herein by reference to Exhibit 10(d)as filed with its Form 8-K dated April 22, 2008.
(10)(l) Revolving Credit Agreement dated as of March 28, 2008 between Rollins, Inc., SunTrust Bankand Bank of America, N.A., incorporated herein by reference to Exhibit 10.2 as filed with itsForm 10-Q for the quarter ended September 30, 2010.
(10)(m) Summary of Compensation Arrangements with Executive Officers, incorporated hereinreference to Exhibit (10)(q) as filed with its Form 10-K for the year ended December 31, 2010.
(10)(n) Summary of Compensation Arrangements with Directors, incorporated herein reference toExhibit (10)(r) as filed with its Form 10-K for the year ended December 31, 2010.
(21) Subsidiaries of Registrant.
(23.1) Consent of Grant Thornton LLP, Independent Registered Public Accounting Firm.
(24) Powers of Attorney for Directors.
(31.1) Certification of Chief Executive Officer Pursuant to Item 601(b)(31) of Regulation S-K, asadopted pursuant to Section 302 of the Sarbanes-Oxley Act of 2002.
(31.2) Certification of Chief Financial Officer Pursuant to Item 601(b)(31) of Regulation S-K, asadopted pursuant to Section 302 of the Sarbanes-Oxley Act of 2002.
(32.1) Certification of Chief Executive Officer and Chief Financial Officer Pursuant to 18 U.S.C.Section 1350, As Adopted Pursuant to Section 906 of the Sarbanes-Oxley Act of 2002.
(101.INS) EX-101 Instance Document
(101.SCH) EX-101 Schema Document
(101.CAL) EX-101 Calculation Linkbase Document
(101.LAB) EX-101 Labels Linkbase Document
(101.PRE) EX-101 Presentation Linkbase Document
(101.DEF) Ex-101 Definition Linkbase Document
80
Exhibit 31.1
I, Gary W. Rollins, certify that:
1. I have reviewed this annual report on Form 10-K of Rollins, Inc.;
2. Based on my knowledge, this report does not contain any untrue statement of a material fact or omitto state a material fact necessary to make the statements made, in light of the circumstances underwhich such statements were made, not misleading with respect to the period covered by this report;
3. Based on my knowledge, the financial statements, and other financial information included in thisreport, fairly present in all material respects the financial condition, results of operations and cashflows of the registrant as of, and for, the periods presented in this report;
4. The registrant’s other certifying officer(s) and I are responsible for establishing and maintainingdisclosure controls and procedures (as defined in Exchange Act Rules 13a-15(e) and 15d-15(e)) andinternal control over financial reporting (as defined in Exchange Act Rules 13a-15(f) and 15d-15(f))for the registrant and have:
a) Designed such disclosure controls and procedures, or caused such disclosure controls andprocedures to be designed under our supervision, to ensure that material information relating tothe registrant, including its consolidated subsidiaries, is made known to us by others within thoseentities, particularly during the period in which this report is being prepared;
b) Designed such internal control over financial reporting, or caused such internal control overfinancial reporting to be designed under our supervision, to provide reasonable assuranceregarding the reliability of financial reporting and the preparation of financial statements forexternal purposes in accordance with generally accepted accounting principles;
c) Evaluated the effectiveness of the registrant’s disclosure controls and procedures and presentedin this report our conclusions about the effectiveness of the disclosure controls and procedures,as of the end of the period covered by this report based on such evaluation; and
d) Disclosed in this report any change in the registrant’s internal control over financial reportingthat occurred during the registrant’s most recent fiscal quarter (the registrant’s fourth fiscalquarter in the case of an annual report) that has materially affected, or is reasonably likely tomaterially affect, the registrant’s internal control over financial reporting; and
5. The registrant’s other certifying officer(s) and I have disclosed, based on our most recent evaluation ofinternal control over financial reporting, to the registrant’s auditors and the audit committee of theregistrant’s board of directors (or persons performing the equivalent functions):
a) All significant deficiencies and material weaknesses in the design or operation of internal controlover financial reporting which are reasonably likely to adversely affect the registrant’s ability torecord, process, summarize and report financial information; and
b) Any fraud, whether or not material, that involves management or other employees who have asignificant role in the registrant’s internal control over financial reporting.
/s/ GARY W. ROLLINS
Gary W. Rollins, Chief Executive Officer,President and Chief Operating Officer
Date: February 28, 2012 (Principal Executive Officer)
Exhibit 31.2
I, Harry J. Cynkus, certify that:
1. I have reviewed this annual report on Form 10-K of Rollins, Inc.;
2. Based on my knowledge, this report does not contain any untrue statement of a material fact or omitto state a material fact necessary to make the statements made, in light of the circumstances underwhich such statements were made, not misleading with respect to the period covered by this report;
3. Based on my knowledge, the financial statements, and other financial information included in thisreport, fairly present in all material respects the financial condition, results of operations and cashflows of the registrant as of, and for, the periods presented in this report;
4. The registrant’s other certifying officer(s) and I are responsible for establishing and maintainingdisclosure controls and procedures (as defined in Exchange Act Rules 13a-15(e) and 15d-15(e)) andinternal control over financial reporting (as defined in Exchange Act Rules 13a-15(f) and 15d-15(f))for the registrant and have:
a) Designed such disclosure controls and procedures, or caused such disclosure controls andprocedures to be designed under our supervision, to ensure that material information relating tothe registrant, including its consolidated subsidiaries, is made known to us by others within thoseentities, particularly during the period in which this report is being prepared;
b) Designed such internal control over financial reporting, or caused such internal control overfinancial reporting to be designed under our supervision, to provide reasonable assuranceregarding the reliability of financial reporting and the preparation of financial statements forexternal purposes in accordance with generally accepted accounting principles;
c) Evaluated the effectiveness of the registrant’s disclosure controls and procedures and presentedin this report our conclusions about the effectiveness of the disclosure controls and procedures,as of the end of the period covered by this report based on such evaluation; and
d) Disclosed in this report any change in the registrant’s internal control over financial reportingthat occurred during the registrant’s most recent fiscal quarter (the registrant’s fourth fiscalquarter in the case of an annual report) that has materially affected, or is reasonably likely tomaterially affect, the registrant’s internal control over financial reporting; and
5. The registrant’s other certifying officer(s) and I have disclosed, based on our most recent evaluation ofinternal control over financial reporting, to the registrant’s auditors and the audit committee of theregistrant’s board of directors (or persons performing the equivalent functions):
a) All significant deficiencies and material weaknesses in the design or operation of internal controlover financial reporting which are reasonably likely to adversely affect the registrant’s ability torecord, process, summarize and report financial information; and
b) Any fraud, whether or not material, that involves management or other employees who have asignificant role in the registrant’s internal control over financial reporting.
/s/ HARRY J. CYNKUS
Harry J. Cynkus, Senior Vice President, ChiefFinancial Officer and Treasurer
Date: February 28, 2012 (Principal Financial and Accounting Officer)
Exhibit 32.1
CERTIFICATION OF PERIODIC FINANCIAL REPORTS PURSUANT TO SECTION 906 OFTHE SARBANES-OXLEY ACT OF 2002
In connection with the Annual Report of Rollins, Inc., a Delaware corporation (the ‘‘Company’’), onForm 10-K for the period ended December 31, 2011 as filed with the Securities and Exchange Commissionon the date hereof (the ‘‘Report’’), each of the undersigned certifies, pursuant to 18 U.S.C. sec. 1350, asadopted pursuant to Section 906 of the Sarbanes-Oxley Act of 2002, that to his knowledge:
(1) The Report fully complies with the requirements of Section 13(a) or 15(d) of the Securities ExchangeAct of 1934; and
(2) The information contained in the Report fairly presents, in all material respects, the financialcondition and results of operations of the Company.
Date: February 28, 2012 By: /s/ GARY W. ROLLINS
Gary W. RollinsChief Executive Officer, Presidentand Chief Operating Officer(Principal Executive Officer)
Date: February 28, 2012 By: /s/ HARRY J. CYNKUS
Harry J. CynkusSenior Vice President, Chief Financial Officerand Treasurer(Principal Financial and Accounting Officer)
This certification shall not be deemed ‘‘filed’’ for purposes of Section 18 of the Securities Exchange Act of1934, as amended (the ‘‘Exchange Act’’), or incorporated by reference in any filing under the SecuritiesAct of 1933, as amended, or the Exchange Act, except as shall be expressly set forth by specific reference insuch a filing.
Additional Annual Report Stockholder’s Information(This is not part of the Company’s Form 10-K filed with the
Securities and Exchange Commission)
CAUTION CONCERNING FORWARD-LOOKING STATEMENTS
This annual report contains statements that constitute ‘‘forward-looking statements’’ within the meaning ofthe Private Securities Litigation Reform Act of 1995, including all statements that look forward in time orexpress management’s beliefs, expectations or hopes. In particular, such statements include, withoutlimitation, statements regarding our belief that our persistent focus on exceeding our customers’expectations will continue to drive exceptional performance despite the nation’s ongoing economicmalaise; our plans to continue to pursue strategic acquisitions that are complementary; our statement thatwe will maintain a relentless drive to improve and innovate; our belief that our investments in newtechnology will result in improved customer service and employee retention, while increasing revenue andprofit, all of which will strengthen the Company’s results and performance; our expectation is to improvebusiness execution and enhance real-time online reporting; our expectation to roll out a new customerrelationship management and branch system operating software in 2013; our plans to install modified salesmanagement software at our Rollins independent brands during the first quarter of 2012; and our plans toroll out in early 2012 our Home Suite Sales Presentation application. All forward-looking statements aremade as of the date hereof and are based on current management expectations and information availableto us as of such date. The company assumes no obligation to update any forward-looking statementsbecause of various risks and uncertainties, including, without limitation, the possibility that we may not beable to maintain our competitive position in the future; economic conditions may adversely affect ourbusiness; our inability to identify, complete or successfully integrate acquisitions; the effect of adverseweather conditions on our operations; potential inability to attract and retain skilled workers; the possibleadverse effect of pending and ongoing litigation; or potential inability to comply with regulatory andenvironmental laws; and all other risks identified under the title ‘‘Risk Factors’ in the Company’s AnnualReport on Form 10-K included as a part of this Annual Report. All of the foregoing risks and uncertaintiesthat could cause its actual results to differ materially from those indicated by the forward-lookingstatements.

(This page has been left blank intentionally.)

(This page has been left blank intentionally.)
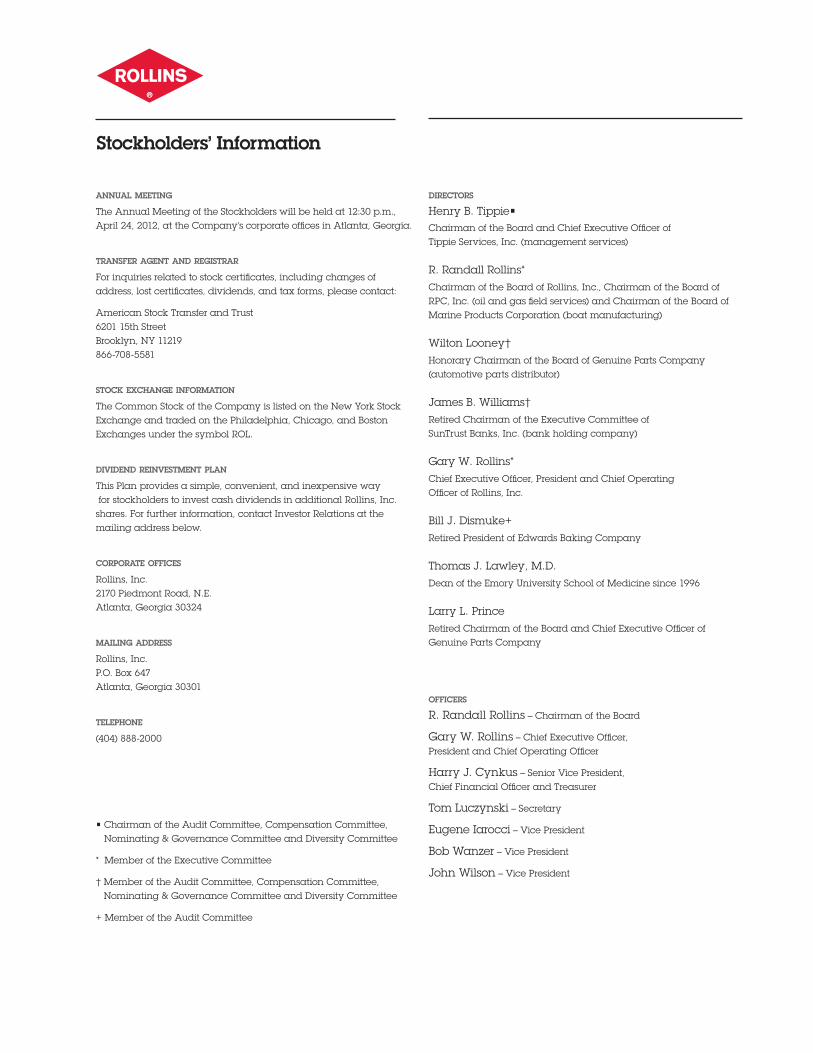
annual meeting
The Annual Meeting of the Stockholders will be held at 12:30 p.m., April 24, 2012, at the Company’s corporate offices in Atlanta, Georgia.
transfer agent and registrar
For inquiries related to stock certificates, including changes of address, lost certificates, dividends, and tax forms, please contact:
American Stock Transfer and Trust 6201 15th Street Brooklyn, NY 11219 866-708-5581
stock exchange information
The Common Stock of the Company is listed on the New York Stock Exchange and traded on the Philadelphia, Chicago, and Boston Exchanges under the symbol ROL.
dividend reinvestment plan
This Plan provides a simple, convenient, and inexpensive way for stockholders to invest cash dividends in additional Rollins, Inc. shares. For further information, contact Investor Relations at the mailing address below.
corporate offices
Rollins, Inc. 2170 Piedmont Road, N.E. Atlanta, Georgia 30324
mailing address
Rollins, Inc. P.O. Box 647 Atlanta, Georgia 30301
telephone
(404) 888-2000
directors
Henry B. Tippie•Chairman of the Board and Chief Executive Officer of Tippie Services, Inc. (management services)
R. Randall Rollins*
Chairman of the Board of Rollins, Inc., Chairman of the Board of RPC, Inc. (oil and gas field services) and Chairman of the Board of Marine Products Corporation (boat manufacturing)
Wilton Looney†
Honorary Chairman of the Board of Genuine Parts Company (automotive parts distributor)
James B. Williams†
Retired Chairman of the Executive Committee of SunTrust Banks, Inc. (bank holding company)
Gary W. Rollins*
Chief Executive Officer, President and Chief Operating Officer of Rollins, Inc.
Bill J. Dismuke+
Retired President of Edwards Baking Company
Thomas J. Lawley, M.D.
Dean of the Emory University School of Medicine since 1996
Larry L. Prince
Retired Chairman of the Board and Chief Executive Officer of Genuine Parts Company
officers
R. Randall Rollins – Chairman of the Board
Gary W. Rollins – Chief Executive Officer, President and Chief Operating Officer
Harry J. Cynkus – Senior Vice President, Chief Financial Officer and Treasurer
Tom Luczynski – Secretary
Eugene Iarocci – Vice President
Bob Wanzer – Vice President
John Wilson – Vice President
Stockholders’ Information
• Chairman of the Audit Committee, Compensation Committee, Nominating & Governance Committee and Diversity Committee
* Member of the Executive Committee
† Member of the Audit Committee, Compensation Committee, Nominating & Governance Committee and Diversity Committee
+ Member of the Audit Committee

www.orkin.com www.orkincanada.ca www.pestdefense.com www.westernpest.com www.indfumco.com www.walthamservices.com www.cranepestcontrol.com www.truetechinc.com
ROLLINS INC.
2170 Piedmont Road, NE
Atlanta, GA 30324
www.rollins.com
ROLLIN
S 2011 AN
NU
AL REPO
RT