PRODUCT LIFECYCLE MANAGEMENT - Rok 2011 Management W-10/0… · electronic equipment (WEEE), can...
110
Projekt współfinansowany ze środków Unii Europejskiej w ramach Europejskiego Funduszu Społecznego ROZWÓJ POTENCJAŁU I OFERTY DYDAKTYCZNEJ POLITECHNIKI WROCŁAWSKIEJ Wrocław University of Technology Production Management Mariusz Cholewa PRODUCT LIFECYCLE MANAGEMENT Developing Engine Technology Wrocław 2011
-
Upload
duongquynh -
Category
Documents
-
view
218 -
download
4
Transcript of PRODUCT LIFECYCLE MANAGEMENT - Rok 2011 Management W-10/0… · electronic equipment (WEEE), can...
Projekt współfinansowany ze środków Unii Europejskiej w ramach Europejskiego Funduszu Społecznego
ROZWÓJ POTENCJAŁU I OFERTY DYDAKTYCZNEJ POLITECHNIKI WROCŁAWSKIEJ
Wrocław University of Technology
Production Management
Mariusz Cholewa
PRODUCT LIFECYCLE
MANAGEMENT Developing Engine Technology
Wrocław 2011
Wrocław University of Technology
Production Management
Mariusz Cholewa
PRODUCT LIFECYCLE
MANAGEMENT Developing Engine Technology
Wrocław 2011
Copyright © by Wrocław University of Technology
Wrocław 2011
Reviewer: Edward Chlebus
ISBN 978-83-62098-15-6
Published by PRINTPAP Łódź, www.printpap.pl
Content: PLM introduction ..................................................................................................................................................... 5
Needs ................................................................................................................................................................... 5
Product lifecycle .................................................................................................................................................. 9
PLM evolution ................................................................................................................................................... 13
Definition ........................................................................................................................................................... 17
Benefits .............................................................................................................................................................. 24
Examples ............................................................................................................................................................ 34
PLM fundamentals ................................................................................................................................................. 39
Structure of PDM systems .................................................................................................................................. 40
Function of PDM systems .................................................................................................................................. 42
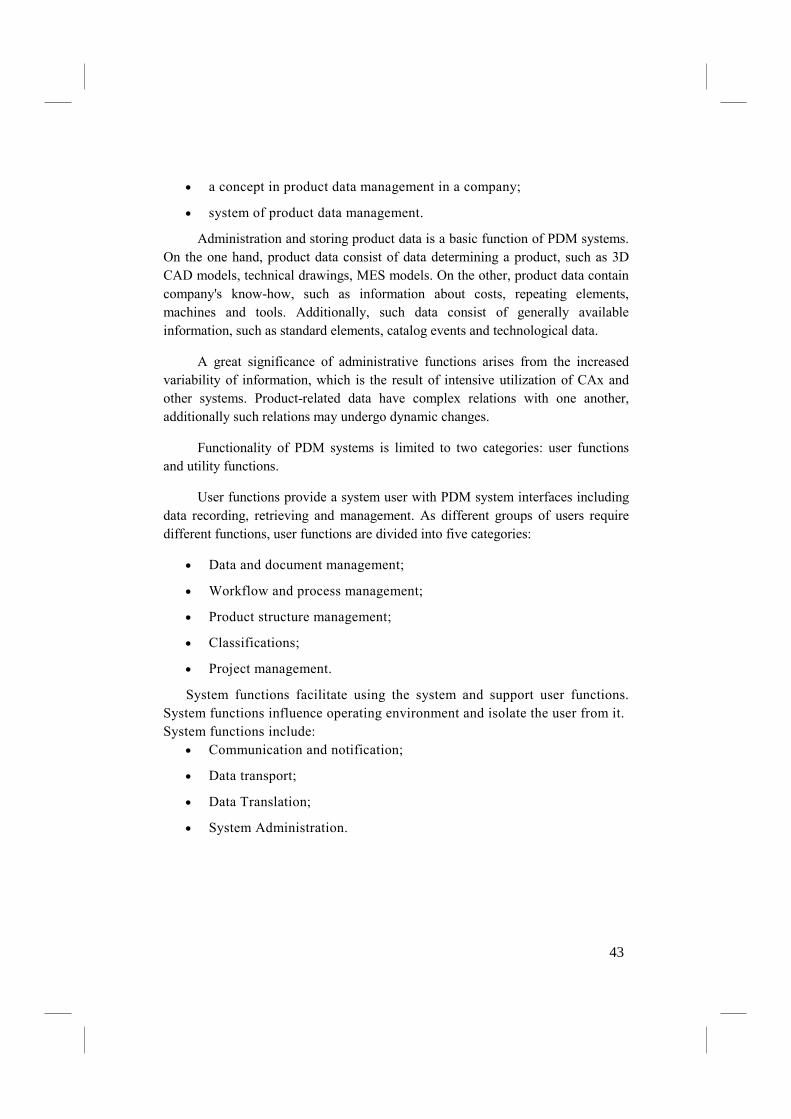
Managing data and documents ....................................................................................................................... 44
Workflow and process management ............................................................................................................... 50
Managing Product Structure ........................................................................................................................... 59
Clasification ................................................................................................................................................... 64
Project management ....................................................................................................................................... 69
Change management ...................................................................................................................................... 70
CAD Integration ............................................................................................................................................. 71
ERP Integration .............................................................................................................................................. 72
System Functions ........................................................................................................................................... 73
PLM system structure ........................................................................................................................................ 74
Position of PLM systems .................................................................................................................................... 77
Integration, Information and Data Exchange .......................................................................................................... 82
STEP Norm in PDM Systems ............................................................................................................................ 82
PLM implementation ............................................................................................................................................. 91
Verification of Costs Related to PDM/PLM Systems [] ..................................................................................... 91
Investigating and adopting a PLM solution ........................................................................................................ 94
Strategy and PLM project objectives .................................................................................................................. 94
Assessing your pre-PLM situation ..................................................................................................................... 98
Setting realistic goals for your PLM solution ................................................................................................... 102
3

Identifying your PLM project expenses ........................................................................................................... 102
Forecasting your PLM project costs ................................................................................................................. 103
Licensing methods: initial price versus lifetime cost ........................................................................................ 104
Establish a budget and calculate ROI ............................................................................................................... 106
PLM market ......................................................................................................................................................... 107
4
PLM introduction
�eeds
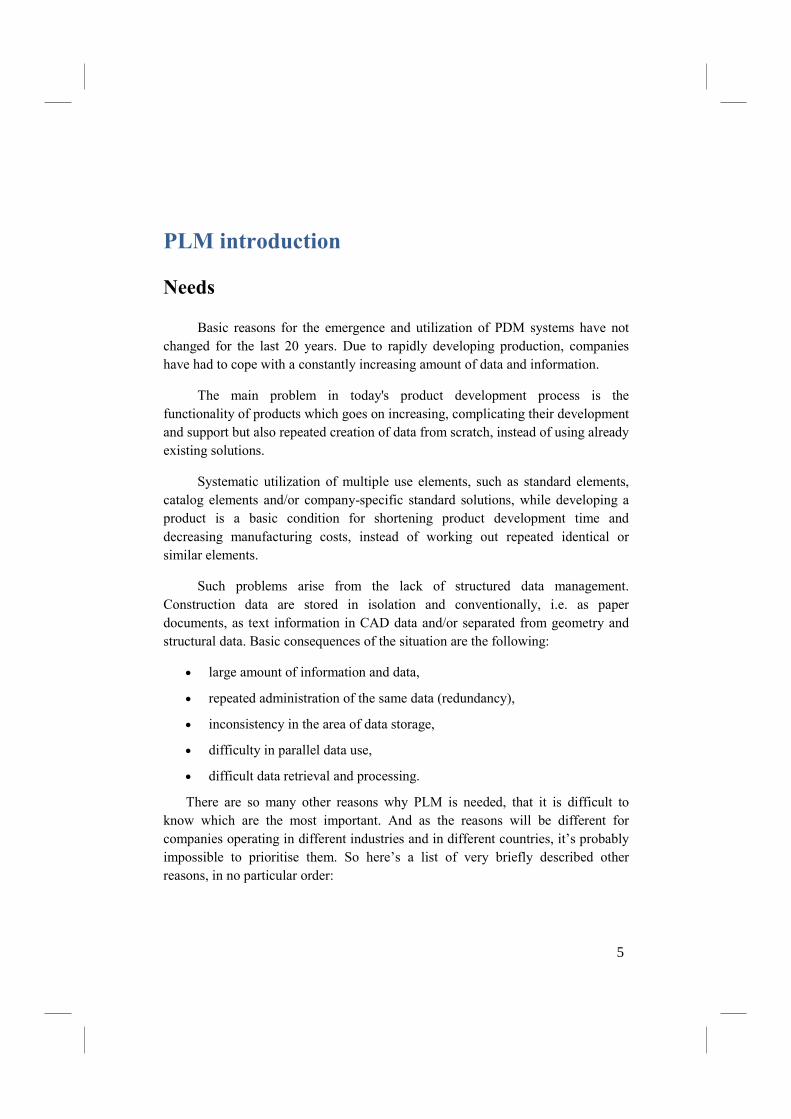
Basic reasons for the emergence and utilization of PDM systems have not
changed for the last 20 years. Due to rapidly developing production, companies
have had to cope with a constantly increasing amount of data and information.
The main problem in today's product development process is the
functionality of products which goes on increasing, complicating their development
and support but also repeated creation of data from scratch, instead of using already
existing solutions.
Systematic utilization of multiple use elements, such as standard elements,
catalog elements and/or company-specific standard solutions, while developing a
product is a basic condition for shortening product development time and
decreasing manufacturing costs, instead of working out repeated identical or
similar elements.
Such problems arise from the lack of structured data management.
Construction data are stored in isolation and conventionally, i.e. as paper
documents, as text information in CAD data and/or separated from geometry and
structural data. Basic consequences of the situation are the following:
• large amount of information and data,
• repeated administration of the same data (redundancy),
• inconsistency in the area of data storage,
• difficulty in parallel data use,
• difficult data retrieval and processing.
There are so many other reasons why PLM is needed, that it is difficult to
know which are the most important. And as the reasons will be different for
companies operating in different industries and in different countries, it’s probably
impossible to prioritise them. So here’s a list of very briefly described other
reasons, in no particular order:
5
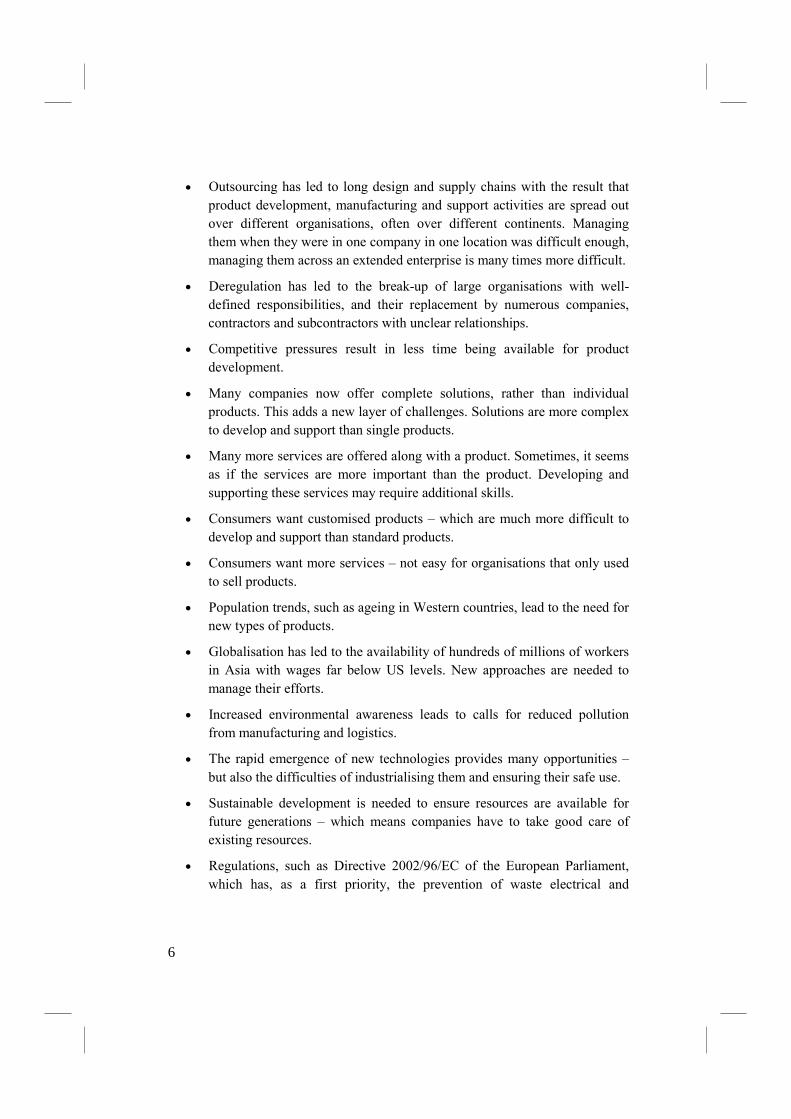
• Outsourcing has led to long design and supply chains with the result that
product development, manufacturing and support activities are spread out
over different organisations, often over different continents. Managing
them when they were in one company in one location was difficult enough,
managing them across an extended enterprise is many times more difficult.
• Deregulation has led to the break-up of large organisations with well-
defined responsibilities, and their replacement by numerous companies,
contractors and subcontractors with unclear relationships.
• Competitive pressures result in less time being available for product
development.
• Many companies now offer complete solutions, rather than individual
products. This adds a new layer of challenges. Solutions are more complex
to develop and support than single products.
• Many more services are offered along with a product. Sometimes, it seems
as if the services are more important than the product. Developing and
supporting these services may require additional skills.
• Consumers want customised products – which are much more difficult to
develop and support than standard products.
• Consumers want more services – not easy for organisations that only used
to sell products.
• Population trends, such as ageing in Western countries, lead to the need for
new types of products.
• Globalisation has led to the availability of hundreds of millions of workers
in Asia with wages far below US levels. New approaches are needed to
manage their efforts.
• Increased environmental awareness leads to calls for reduced pollution
from manufacturing and logistics.
• The rapid emergence of new technologies provides many opportunities –
but also the difficulties of industrialising them and ensuring their safe use.
• Sustainable development is needed to ensure resources are available for
future generations – which means companies have to take good care of
existing resources.
• Regulations, such as Directive 2002/96/EC of the European Parliament,
which has, as a first priority, the prevention of waste electrical and
6
electronic equipment (WEEE), can lead to major changes in business rules
and models.
• A Stock Exchange mentality, with managers more interested in quarterly
results than in the long-term well-being of their products and services.
• Changes in management responsibilities resulting from the Sarbanes-Oxley
Act.
• The lifetime of some products is now so short, that the development of a
future generation has to start before the development of the previous
generation has been finished.
• Geopolitical developments – such as the appearance of China as a major
exporter of manufactured goods, India as a leading producer of software
and software developers, and Russia as a leading producer of oil and gas –
lead to many changes[1].
Purposes of Deploying PLM Systems
Three basic aims of aiding engineering data management using information
technologies can be distinguished:
• shortening product development time,
• decreasing product development costs,
• enhancing the quality of the product.
To meet these targets, changes in the following areas are required:
• inside office integration,
• product data management,
• product data retrieval,
• archiving product data,
• inside office organization.
When it comes to inside office integration, three levels of integration can be
mentioned:
• product development process integration,
• integration in the remaining lifecycles of the product and in administrative
processes,
• integration of suppliers.
7
All these levels can be effectively aided by PDM systems. The target is a full
integration of the standard model of a product with all systems, enabling full access
to data.
PLM is the activity of managing a company’s products all the way across
their lifecycles in the most effective way. In so doing, it enables the company to
take control of its products. For various reasons, some of which are mentioned in
the next section, companies are losing control of their products. Losing control of
their products can have disastrous effects. Keeping control isn’t easy. During the
development of a product, it doesn’t physically exist, so during that phase of its life
it’s difficult to control. Once a product does exist, it should be used at a customer
location, where again, it’s difficult for a company to keep control of it.
PLM helps bring better products to market faster, and enables better support of
customers’ use of products. It’s important to bring a product to market quickly –
otherwise the customer will choose a competitor’s product before yours gets to
market. PLM helps reduce the cost of a product. It’s important to reduce product
costs – otherwise the customer will choose a competitive product that costs less
than yours. It’s important to support customers’ use of your product – otherwise
they may stop using your product and use a competitor’s one instead.
PLM enables the value of a product to be maximised over its lifecycle. With
accurate, consolidated information about mature products available, low-cost ways
can be found to extend their revenue-generating lifetimes.
PLM gives transparency about what is happening over the product lifecycle. It
offers managers visibility about what is really happening with products. Before,
they were often faced by an opaque mass of conflicting information. PLM provides
them the opportunity to manage better. Based on the real information, they can
come to better decisions.
PLM systems are such systems, that support, among others, engineers, managers,
etc., in designing, processing and managing data and processes taking place at the
company. A PLM system creates a structure of a product with all types of
information needed for defining and production, it also supports quality
management and control. The system is aimed at co-operating with electronic
documents, files and computer databases.
8
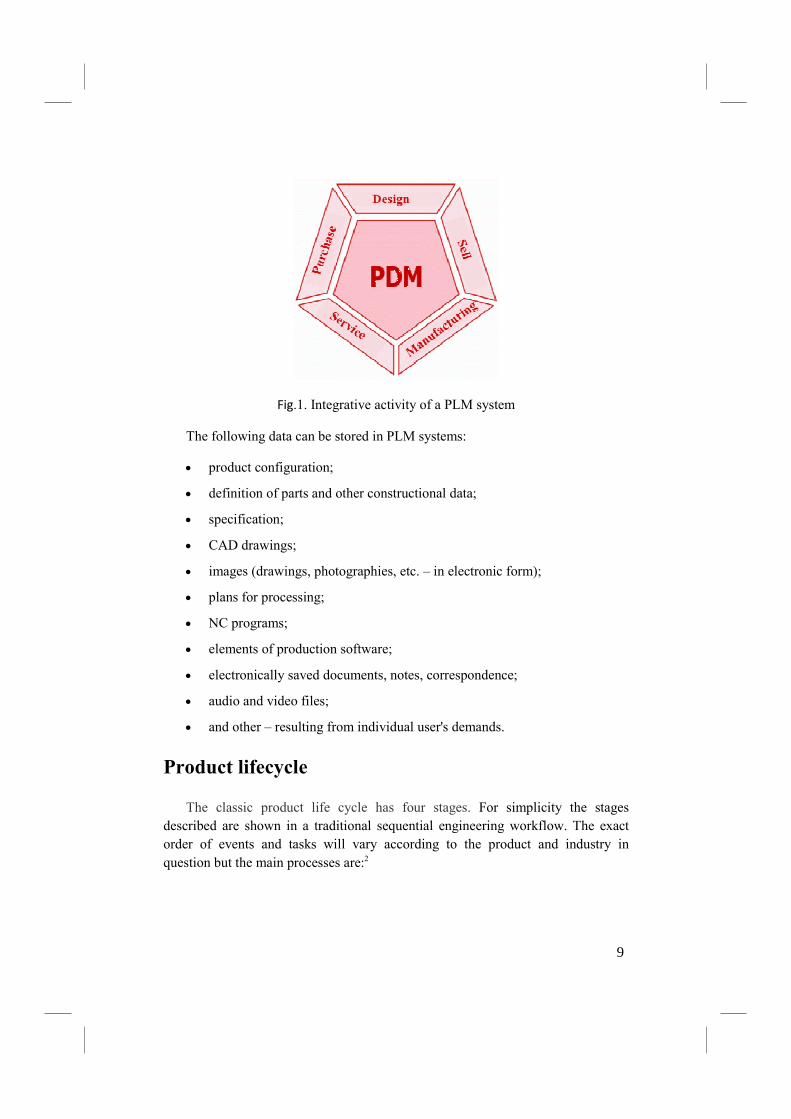
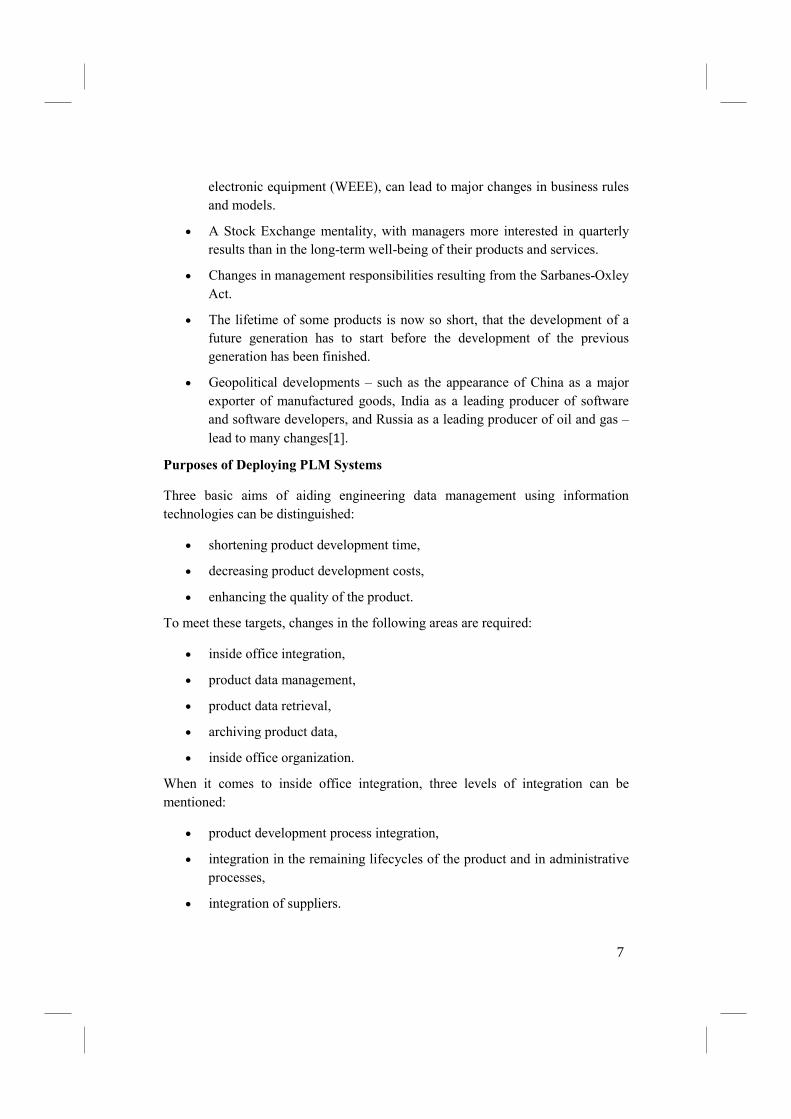
Fig.1. Integrative activity of a PLM system
The following data can be stored in PLM systems:
• product configuration;
• definition of parts and other constructional data;
• specification;
• CAD drawings;
• images (drawings, photographies, etc. – in electronic form);
• plans for processing;
• NC programs;
• elements of production software;
• electronically saved documents, notes, correspondence;
• audio and video files;
• and other – resulting from individual user's demands.
Product lifecycle
The classic product life cycle has four stages. For simplicity the stages
described are shown in a traditional sequential engineering workflow. The exact
order of events and tasks will vary according to the product and industry in
question but the main processes are:2
9
• Conceive
o Specification
o Concept design
• Design
o Detailed design
o Validation and analysis (simulation)
o Tool design
• Realize
o Plan manufacturing
o Manufacture
o Build/Assemble
o Test (quality check)
• Service
o Sell and Deliver
o Use
o Maintain and Support
o Dispose
Phase 1: Conceive
Imagine, specify, plan, innovate
The first stage in idea is the definition of requirements based on customer,
company, market and regulatory bodies’ viewpoints. From this specification of the
product major technical parameters can be defined. Parallel to the requirements
specification the initial concept design work is carried out defining the visual
aesthetics of the product together with its main functional aspects. For the
Industrial Design, Styling, work many different media are used from pencil and
paper, clay models to 3D CAID Computer-aided industrial design software.
Phase 2: Design
Describe, define, develop, test, analyze and validate
This is where the detailed design and development of the product’s form starts,
progressing to prototype testing, through pilot release to full product launch. It can
also involve redesign and ramp for improvement to existing products. The main
tool used for design and development is CAD Computer-aided design. This can be
10
simple 2D Drawing / Drafting or 3D Parametric Feature Based Solid/Surface
Modeling. Such software includes technology such as Hybrid Modeling, Reverse
Engineering, KBE (Knowledge-Based Engineering), Assembly construction.
This step covers many engineering disciplines including: Mechanical, Electrical,
Electronic, Software (embedded), and domain-specific, such as Architectural,
Aerospace, Automotive, ... Along with the actual creation of geometry there is the
analysis of the components and product assemblies. Simulation, validation and
optimization tasks are carried out using CAE (Computer-aided engineering)
software either integrated in the CAD package or stand-alone. These are used to
perform tasks such as: Stress analysis, FEA (Finite Element Analysis); Kinematics;
Computational fluid dynamics (CFD); and mechanical event simulation (MES).
CAQ (Computer-aided quality) is used for tasks such as Dimensional Tolerance
(engineering) Analysis. Another task performed at this stage is the sourcing of
bought out components, possibly with the aid of Procurement systems.
Phase 3: Realize
Manufacture, make, build, procure, produce, sell and deliver
Once the design of the product’s components is complete the method of
manufacturing is defined. This includes CAD tasks such as tool design; creation of
CNC Machining instructions for the product’s parts as well as tools to manufacture
those parts, using integrated or separate CAM Computer-aided manufacturing
software. This also involves analysis tools for process simulation for operations
such as casting, molding, and die press forming. Once the manufacturing method
has been identified CPM comes into play. This involves CAPE (Computer-aided
Production Engineering) or CAP/CAPP – (Production Planning) tools for carrying
out Factory, Plant and Facility Layout and Production Simulation. For example:
Press-Line Simulation and Industrial Ergonomics as well as tool selection
management. Once components are manufactured their geometrical form and size
can be checked against the original CAD data with the use of Computer Aided
Inspection equipment and software. Parallel to the engineering tasks, sales product
configuration and marketing documentation work will be taking place. This could
include transferring engineering data (geometry and part list data) to a web based
sales configurator and other Desktop Publishing systems.
Phase 4: Service
Use, operate, maintain, support, sustain, phase-out, retire, recycle and disposal
11
The final phase of the lifecycle involves managing of service information.
Providing customers and service engineers with support information for repair and
maintenance, as well as waste management/recycling information. This involves
using such tools as Maintenance, Repair and Operations Management (MRO)
software.
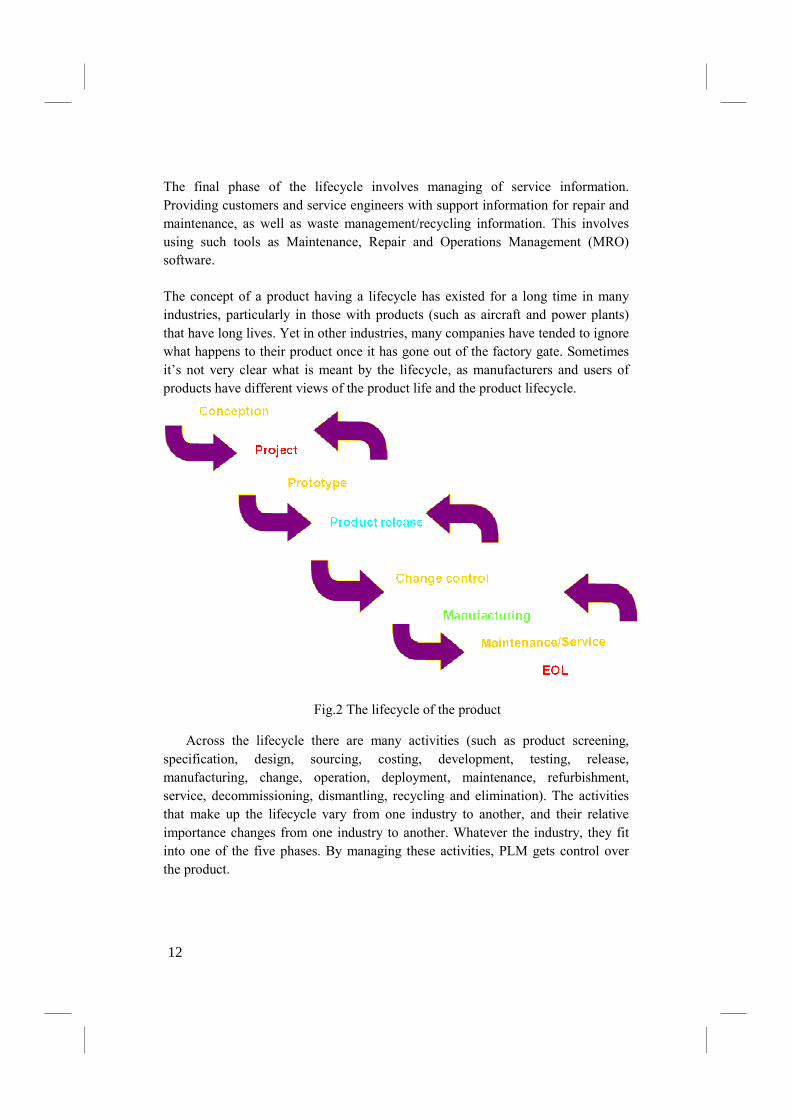
The concept of a product having a lifecycle has existed for a long time in many
industries, particularly in those with products (such as aircraft and power plants)
that have long lives. Yet in other industries, many companies have tended to ignore
what happens to their product once it has gone out of the factory gate. Sometimes
it’s not very clear what is meant by the lifecycle, as manufacturers and users of
products have different views of the product life and the product lifecycle.
Fig.2 The lifecycle of the product
Across the lifecycle there are many activities (such as product screening,
specification, design, sourcing, costing, development, testing, release,
manufacturing, change, operation, deployment, maintenance, refurbishment,
service, decommissioning, dismantling, recycling and elimination). The activities
that make up the lifecycle vary from one industry to another, and their relative
importance changes from one industry to another. Whatever the industry, they fit
into one of the five phases. By managing these activities, PLM gets control over
the product.
12
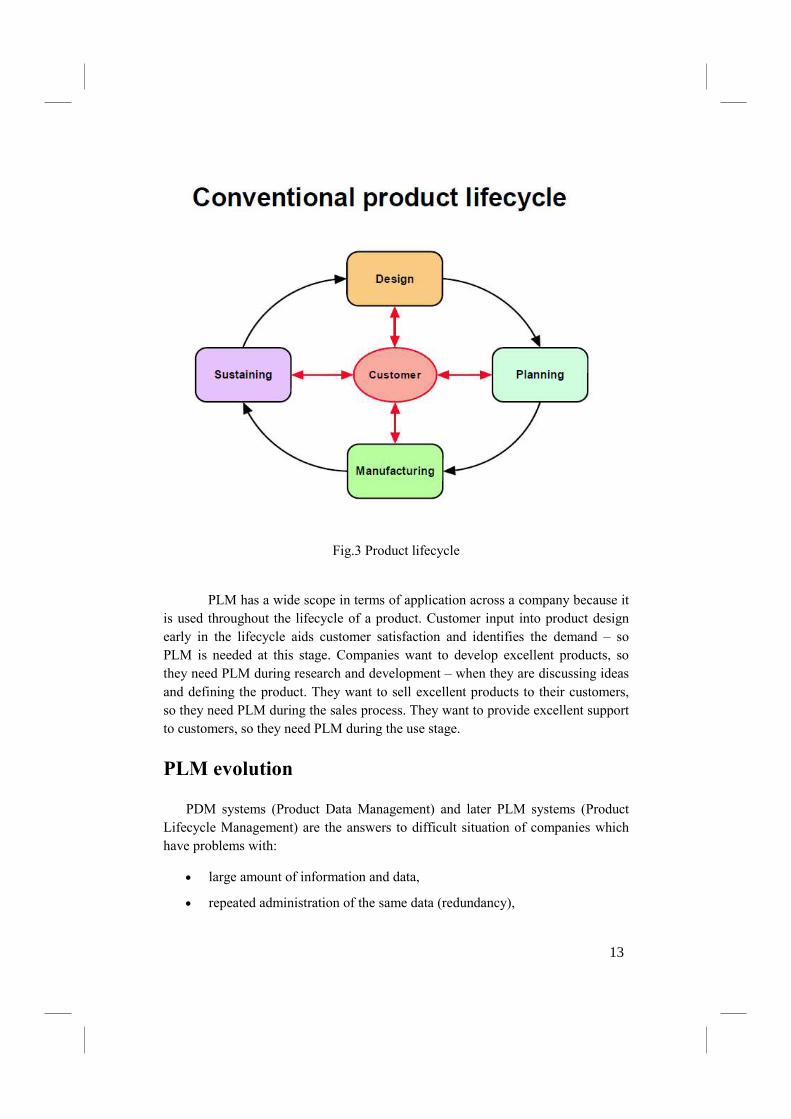
Fig.3 Product lifecycle
PLM has a wide scope in terms of application across a company because it
is used throughout the lifecycle of a product. Customer input into product design
early in the lifecycle aids customer satisfaction and identifies the demand – so
PLM is needed at this stage. Companies want to develop excellent products, so
they need PLM during research and development – when they are discussing ideas
and defining the product. They want to sell excellent products to their customers,
so they need PLM during the sales process. They want to provide excellent support
to customers, so they need PLM during the use stage.
PLM evolution
PDM systems (Product Data Management) and later PLM systems (Product
Lifecycle Management) are the answers to difficult situation of companies which
have problems with:
• large amount of information and data,
• repeated administration of the same data (redundancy),
13
• inconsistency in the area of data storage,
• difficulty in parallel data use,
• difficult data retrieval and processing.
The first works were undertaken in the eighties and since the nineties a rapid
development of the techniques ensued. Distribution of companies co-operating
with one another had a great influence on the development of PDM systems.
Hence, these instruments integrate processes and information describing a certain
product and allow for controlling them. Communication may take place between
different systems via built-in interfaces.
PDM/PLM systems used nowadays and in the past have three different roots –
sources of origin.
The largest number of PDM systems appeared as a response to the CAD
systems users' demands. A large popularity and mass utilization of CAD tools in
the process of product development caused the generation of huge amounts of data
(2D drawings, 3D models, analyses, specifications, etc.) describing a product.
Access, searching, updating, forming archives and exchange of the data presented
large problems. Thus, the suppliers of CAD systems were the first to offer PDM
tools, which, among other things, solved the aforementioned problems. PDM
systems of that type have a very well finished up modules integrating with an
appropriate CAD system, which significantly influences functionality and work
efficiency in the area of product design.
The next group of PDM systems derive from MRP class systems. PDM
systems connect (in terms of data) the design area with the production area. In
order to realize their functions, PDM systems need to be integrated with MRP class
systems, hence manufacturers of such systems became suppliers of PDM/PLM
solutions, too. This group of PDM systems co-operates very well with an
appropriate MRP management system, which makes data exchange with an MRP
system very efficient and functions responsible for work organization, product
tracking during the whole lifecycle and calculating costs are extremely precise.
The last group of PDM systems is connected with neither CAD software
designers nor the manufacturers of MRP systems – it is independent. Independence
results in a large versatility of such systems, which can co-operate with various
CAD systems and MRP systems. It is especially important for companies co-
operating with different firms, which have varying computer solutions, but thanks
to independent PDM systems it is possible to exchange data loss-free, in their
native formats.
14
The main trend-setting tendencies for PDM development and areas of
application are as follows:
1. Dynamic changes and transformations taking place in the industry:
• strong competition forcing the shortening of the lifecycle of a product and
answering individual customer's needs,
• development of co-operation between a final product manufacturer and
subsuppliers,
• necessity of co-operation even between competitive companies resulting
from market globalization.
2. New techniques and procedures aiding the development of a product and
manufacturing processes:
• common use of CAx techniques,
• utilizing 3D models as basic models in the product development cycle,
• using modern design methods e.g. concurrent design – CE (Concurrent
Engineering) or working in design teams according to TDM (Team Data
Management) concept,
• workflow, i.e. management and supervision of the organization and flow of
the production process,
• integration of all factors supporting a product lifecycle in database
management systems.
• Fast development of communication technologies, especially the Internet,
which enables:
• creation of one's own applications handling selected areas in a company,
basing on generally accepted concepts,
• development of co-operation between companies,
• incorporating productive and technological potential into the global
economy,
• creation of networks aiding work on creating a common product.
Like all IT solutions, also PDM systems have evolved.
One of the evolution phases was cPDm system (Collaborative Product
Definition Management)3, which was defined as a strategic business approach,
applying a consistent set of business solutions that collaboratively manage the
product or plant definition lifecycle across the extended enterprise. cPDm focuses
on managing the complete product or plant definition lifecycle, including
15
mechanical, electronic, software, and documentation components, and the
processes that are used during the lifecycle.
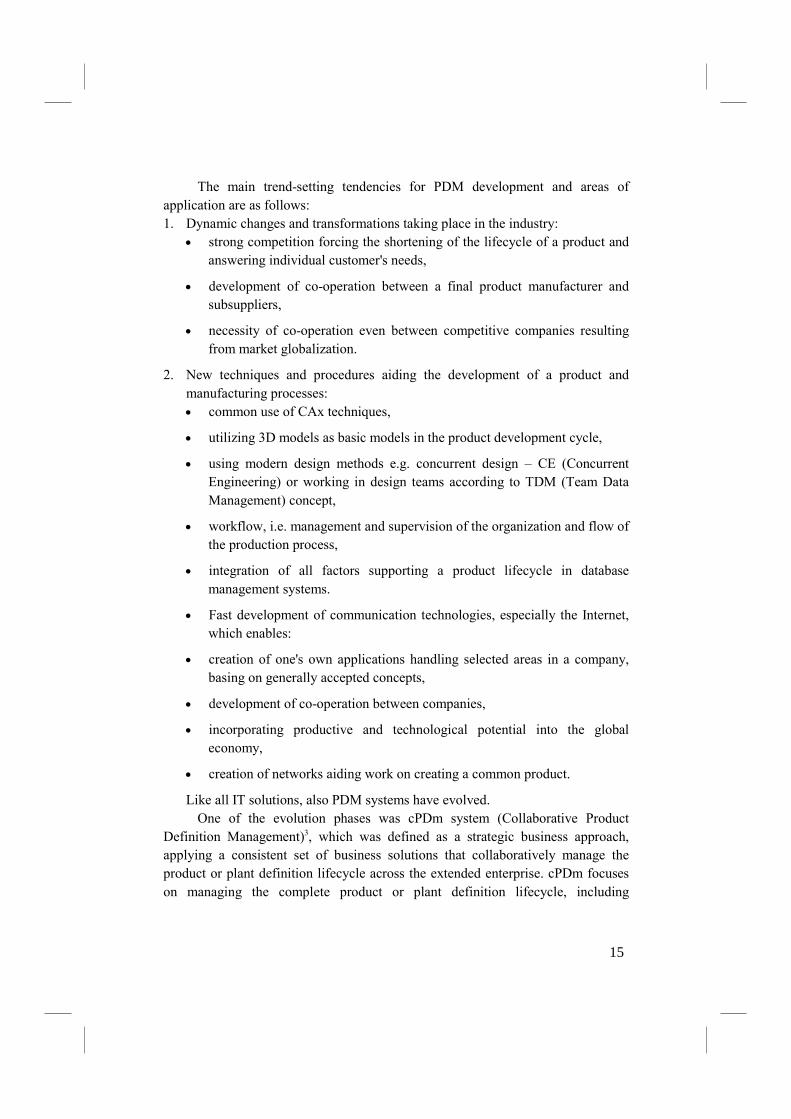
The evolution of PDM systems led to the situation, where they are perceived
as the core of full PLM solutions.
Fig.4 Evolution of the PLM solutions
The term lifecycle management was changing its meaning in the course of
the last twenty years. According to CIMdata, PLM (Product Lifecycle
Management) is a strategic approach used as a group of solutions supporting
integration, management, circulation and using information defining a product,
incorporating the whole undertaking – from the conceptional phase until the end of
the product lifecycle, integrating people, processes, system solutions and
information 4. PLM systems help companies achieve their targets by the reduction
of costs, improvement of quality, shortening time for delivering products onto the
market, innovativeness of the products, service and co-operation with customers,
suppliers and business partners.
The evolution of PLM systems was very dynamic, which caused continuous
improvement of their functionality. At the end of the 1980s, implemented systems
consisted mainly of tools handling engineering data. At that time, a significant
emphasis was laid on the problem of CAD type documents management. In the
most common systems tools and applications were developed, which aimed at
automating typical functions connected with product structure management, its
16
configuration and introduced innovations. Along with successive implementations
and experience acquired in various branches of industry, producers also started
working on trade applications. Such applications contained standard data models,
templates and other functions enabling manager problem solving. Systems
emerging nowadays most frequently contain complete applications which are
capable of handling all areas of company's activities. They allow organizations to
adjust processes to requirements existing in the industry. The evolution of PLM
systems changed the level of management, and what is more important, changed
the way in which such solutions are made and implemented.
Definition
PDM and PLM are, generally, an extension of such terms as: EDM
(Engineering Data Management), DM (Document Management), PIM (Product
Information Management), TDM (Technical Data Management), TIM (Technical
Information Management), IM (Image Management) and other notions connected
with data and information management systems. The system combines and
manages product data appearing in various applications and systems. Thanks to its
versatility, it can manage both mathematical data and drawings. The types of
features and functions that should be contained within a PDM system are
independent of the detail-level of the application and the form of data 5.
17
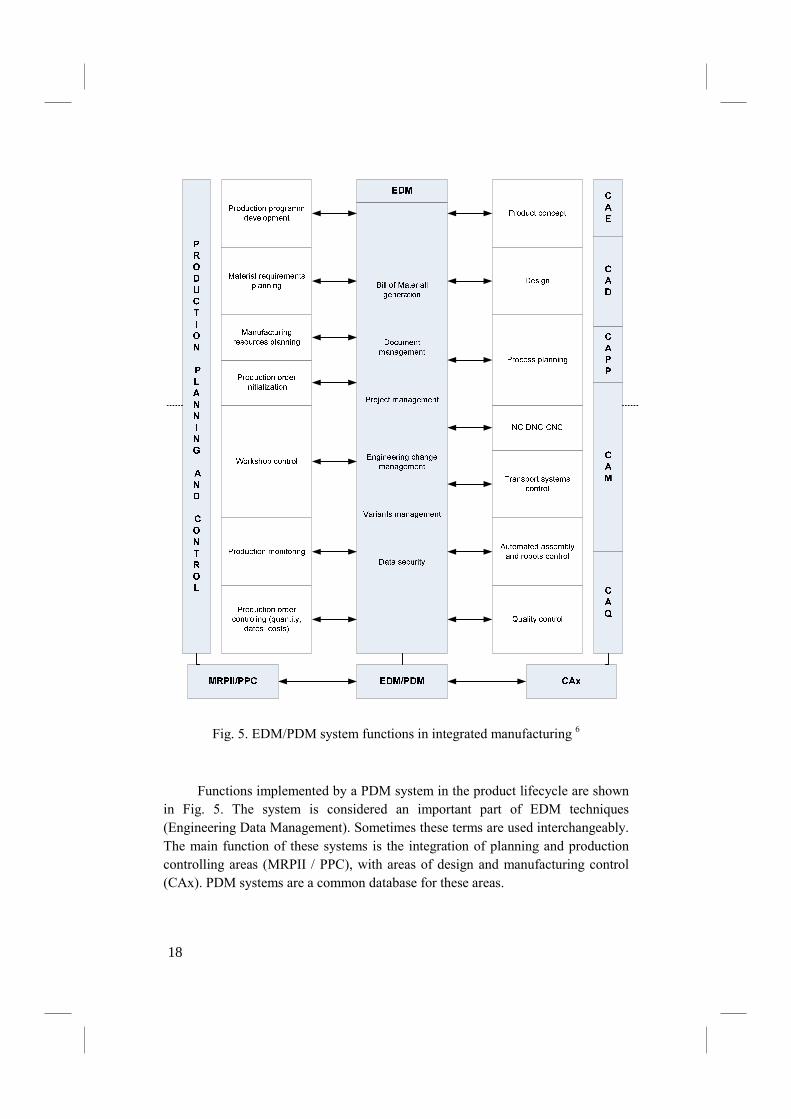
Fig. 5. EDM/PDM system functions in integrated manufacturing 6
Functions implemented by a PDM system in the product lifecycle are shown
in Fig. 5. The system is considered an important part of EDM techniques
(Engineering Data Management). Sometimes these terms are used interchangeably.
The main function of these systems is the integration of planning and production
controlling areas (MRPII / PPC), with areas of design and manufacturing control
(CAx). PDM systems are a common database for these areas.
18
In PDM systems, a product may be:
• a manufactured product – a car, computer, telephone, etc.;
• a project – of a building, bridge, road;
• food – food industry;
• medicine – pharmaceutical industry;
• airports, railroad systems, ports, warehouse logistic systems –
communication;
• power engineering, water, gas, TV network – distribution;
• other
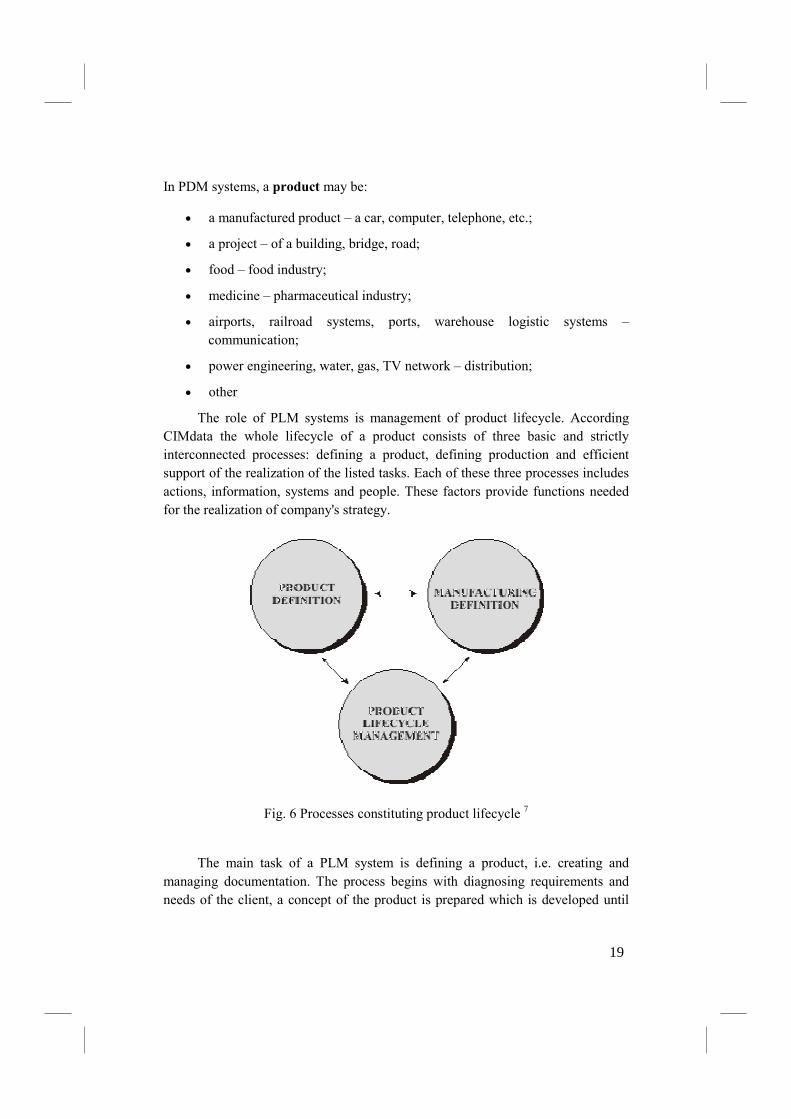
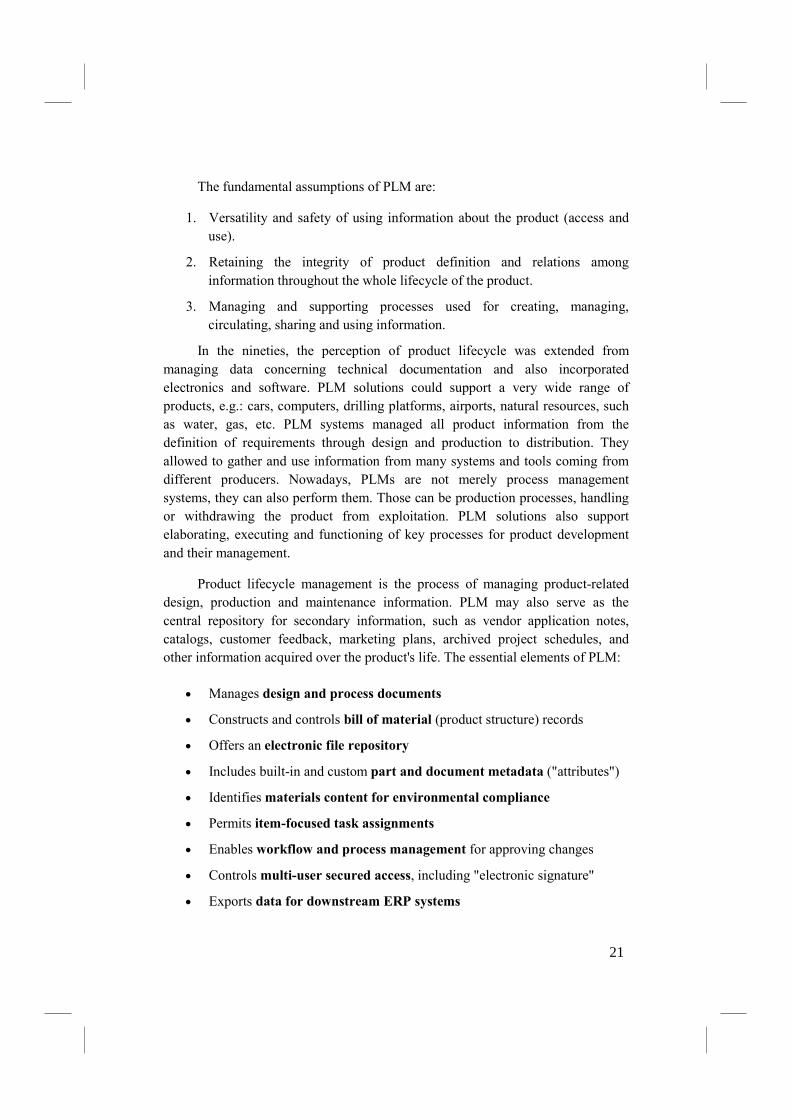
The role of PLM systems is management of product lifecycle. According
CIMdata the whole lifecycle of a product consists of three basic and strictly
interconnected processes: defining a product, defining production and efficient
support of the realization of the listed tasks. Each of these three processes includes
actions, information, systems and people. These factors provide functions needed
for the realization of company's strategy.
Fig. 6 Processes constituting product lifecycle 7
The main task of a PLM system is defining a product, i.e. creating and
managing documentation. The process begins with diagnosing requirements and
needs of the client, a concept of the product is prepared which is developed until
19
there is demand for a given product. At that time, a complete definition of the
product is created, starting from individual components, software, until the whole
documentation has been created.
A product definition contains the whole group of information concerning:
design, production, use, servicing, withdrawing from use and disassembly of the
product when it has been exploited. Information is updated throughout the whole
lifecycle of the product. It is intellectual goods, which a company creates, gathers,
modifies and stores. In integrated manufacturing, not only internal users make use
of them, but also cooperators, suppliers and even customers. Already at the
beginning of the 1980s, industrial companies started perceiving information as
intellectual capital having strategic meaning. PLM continues this approach because
correct definition of a product is basis for further work on its development.
Delivery of the ready product is also the task of PLM systems. The process consist
of all activities connected with the production and distribution of goods. Production
is based on ERP applications, which focus on manufacturing resource planning and
transport. The third important process realized within PLM is managing resources
supporting product lifecycle. These are resources with strategic meaning for the
company, such as: people, finances, infrastructure, etc.
There has to be a strict coordination and communication between those three
processes for a company to achieve success. Henceforth, creating a uniform
product requires close co-operation. Accomplishing objective depends on meeting
a series of conditions, such as:
• basing company's development on the development of products
(intellectual resources are the largest capital)
• enabling integration between employees and organizations
• efficient use of information defining the product
• strict co-operation with the suppliers.
Managing product lifecycle is not a new concept. However, in recent years
the ability of the industry to implement it has significantly increased, thanks to the
availability of new technologies, facilitating co-operation between companies. The
approach to the problem of managing complete information about the product,
according to PLM, is not only about the technology, but also solution in which
processes are as important or even more important than data.
20
The fundamental assumptions of PLM are:
1. Versatility and safety of using information about the product (access and
use).
2. Retaining the integrity of product definition and relations among
information throughout the whole lifecycle of the product.
3. Managing and supporting processes used for creating, managing,
circulating, sharing and using information.
In the nineties, the perception of product lifecycle was extended from
managing data concerning technical documentation and also incorporated
electronics and software. PLM solutions could support a very wide range of
products, e.g.: cars, computers, drilling platforms, airports, natural resources, such
as water, gas, etc. PLM systems managed all product information from the
definition of requirements through design and production to distribution. They
allowed to gather and use information from many systems and tools coming from
different producers. Nowadays, PLMs are not merely process management
systems, they can also perform them. Those can be production processes, handling
or withdrawing the product from exploitation. PLM solutions also support
elaborating, executing and functioning of key processes for product development
and their management.
Product lifecycle management is the process of managing product-related
design, production and maintenance information. PLM may also serve as the
central repository for secondary information, such as vendor application notes,
catalogs, customer feedback, marketing plans, archived project schedules, and
other information acquired over the product's life. The essential elements of PLM:
• Manages design and process documents
• Constructs and controls bill of material (product structure) records
• Offers an electronic file repository
• Includes built-in and custom part and document metadata ("attributes")
• Identifies materials content for environmental compliance
• Permits item-focused task assignments
• Enables workflow and process management for approving changes
• Controls multi-user secured access, including "electronic signature"
• Exports data for downstream ERP systems
21
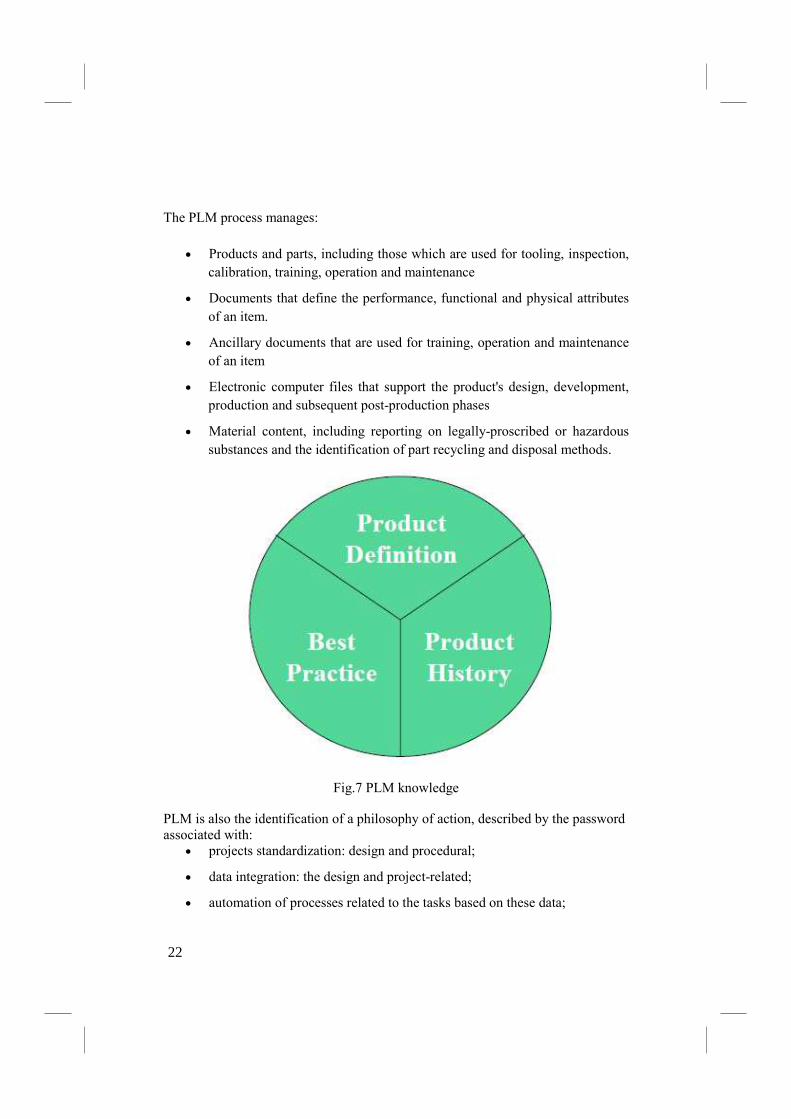
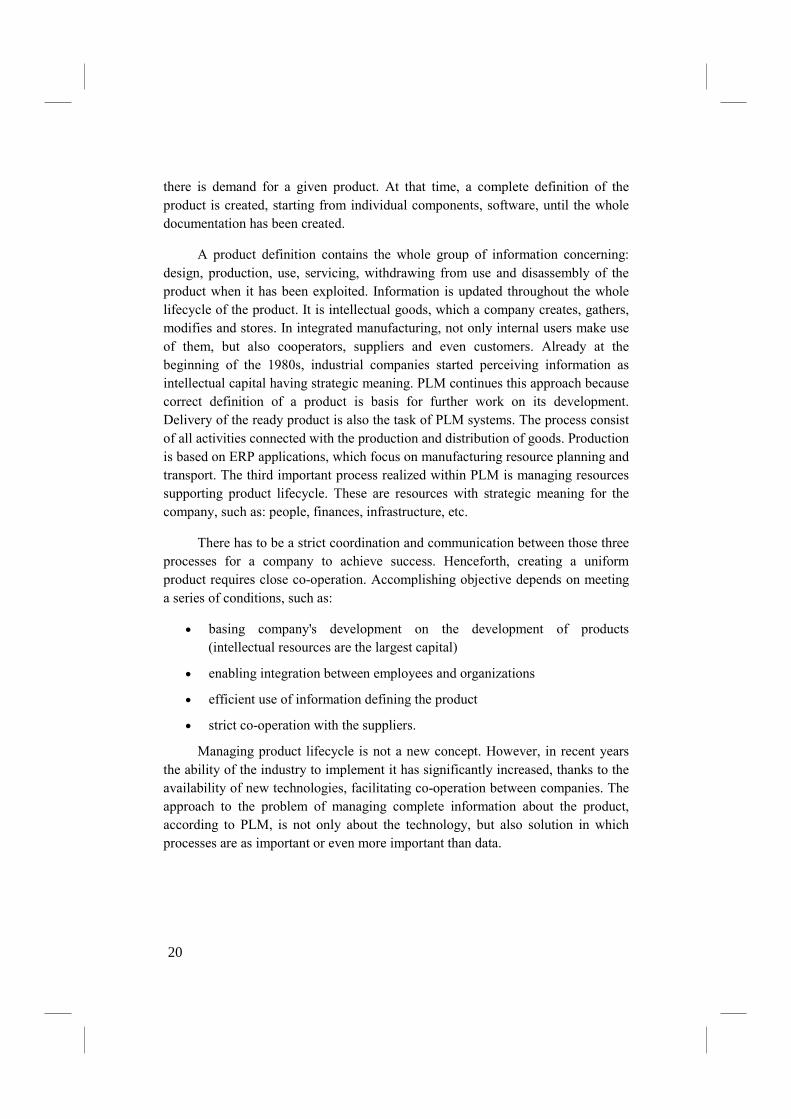
The PLM process manages:
• Products and parts, including those which are used for tooling, inspection,
calibration, training, operation and maintenance
• Documents that define the performance, functional and physical attributes
of an item.
• Ancillary documents that are used for training, operation and maintenance
of an item
• Electronic computer files that support the product's design, development,
production and subsequent post-production phases
• Material content, including reporting on legally-proscribed or hazardous
substances and the identification of part recycling and disposal methods.
Fig.7 PLM knowledge
PLM is also the identification of a philosophy of action, described by the password associated with:
• projects standardization: design and procedural;
• data integration: the design and project-related;
• automation of processes related to the tasks based on these data;
22
• automation of project management.
Below are some definitions of PLM systems and solutions.
•CIMData
“–A strategic business approach that applies a consistent set of business solutions
that support the collaborative creation, management, dissemination, and use of
product definition information
–Supporting the extended enterprise (customers, design and supply partners, etc.)
–Spanning from concept to end of life of a product or plant
–Integrating people, processes, business systems, and information”
•John Stark’s collection of PLM definitions
–"PLM : A set of technologies and processes ...“
–"PLM is an extended enterprise solution ..."
–“…PLM is a business initiative, rather than an application or even a set of
applications."
–“PLM, …It's a business approach, a strategy to solve the problem of managing
the complete information set that defines a product"
–"PLM : A business strategy that helps companies share product data, apply
common processes, and leverage corporate knowledge…"
•PCMag.com
“–(Product Lifecycle Management) A comprehensive information system that
coordinates all aspects of a product from initial concept to itseventual retirement.
Sometimes called the "digital backbone" of a product, it includes the requirements
phase, analysis and design stages, manufacturing, product launch, distribution,
quality assurance, in-service maintenance and spare parts provisions.”
•Cambashi.com
“–Product Lifecycle Management (PLM) systems support the management of a
portfolio of products, processes and services from initial concept, through design,
launch, production and use to final disposal. They co-ordinate products, project
and process information throughout new product introduction, production, service
and retirement among the various players, internal and external to the OEM,
whomust collaborate to bring the concept to fruition.”
23
Benefits
Many industries are quite networked nowadays and the information system
environment of different companies is very heterogeneous. There can be several
specialized CAD systems, ERP systems, sales systems, and so forth in production
use. The heterogeneous information system environment sets great demands upon
the integration of systems and the transfer of information. On the other hand, it is
possible to obtain the most considerable advantages in this environment. The same
also holds true for the operation of the company in a scattered operation field in
which there are plenty of interest groups of different types. The great physical
distances and the interfaces of organizations of different types will lose their
significance when the product management is reasonably adapted. PLM systems
are extremely suitable for developing the internal communication of the company
and communication between external companies in the same network. Between the
separate departments of the organization and other external interest groups, the
improvement in communication is perhaps the most important single benefit from a
functional product lifecycle management system.
PLM systems are considered the most integrated tools for individual stages
of product development, regardless of the branch of the industry. Implementing the
system in a company not only reduces costs, but most of all it orders the
management process and information use. Solutions used in PLM systems
concentrate on all data related to the product and its lifecycle, not only on the
drawings or images as it was implemented in electronic systems of documentation
management – EDM 8. Taking advantage of the latest information technology,
PLM systems became very powerful tools for managing files, drawings, data and
relations between them. With the use of computers, they allow for creating data in
a faster way, with higher quality, and unconstrained flow of information, data and
documentation between various departments in a company. It increases the profits
coming from concurrent engineering and the time from the moment a concept
comes into existence to the moment of launching becomes shorter.
In the area of product data administration and order administration, it is a
primary goal for PLM systems to avoid storing redundant data (repeated storage
and incoherence). Such a problem appears in companies where several logically
separated databases are used to save data.
Another purpose connected with searching for product data is unlimited
access to all information for authorized users. Protecting data in PLM systems is
24
implemented via a mechanism of access control and precise administration of
authorizations. Such mechanisms are based on the so-called roles and views. The
user's role may be e.g. creator of the document. What is more, PLM systems offer
the possibility to assign statuses to product data (in the process, tested, freed,
modified) and access rights (none, reading, writing, deleting).
Moreover, PLM systems enable medium-term data archiving and/or support
long-term archiving. When it comes to long-term archiving, PLM systems use
standard data formats, e.g. STEP.
Another purpose of PLM is protecting the documentation and storing
company's know-how. The know-how includes all types of company works
(projects, programs, etc.) that have ever been elaborated. It must be accessible for
all company's employees for many years.
One of the most important purposes of EDM systems is optimal control of
company's processes and accelerating production processes.
A PLM system, apart from managing picture documentation, as an answer to
customer's needs can also manage the concept of the product, detailed drawings,
prototypes, testing, as well as manufacturing and maintaining production. PLM
controls product data, checks their state, confirms and authorizes processes.
Delivering data for managing and protecting the production process, PLM ensures
constant information update for the user.
Moreover, PLM systems, apart from typical applications in industrial domains,
can also be used for creating software, managing finances and other domains
in which control and managing product information is important.
PLM systems bring advantages in many domains and areas of product
creation. Practically each company's employee can become the user of the system.
However, the majority of PLM systems are used by constructors, engineers,
technologists, administrators and employees from departments of marketing and
sales. Thanks to the system, managers have the possibility to control processes and
get insight into stages of design and production.
PLM software can help people improve their understanding of how products are
designed, built and serviced. Most users appreciate centralized access to all
product-related information; they feel more productive and efficient. But the
benefits are quite concrete and easy to demonstrate.
25
These benefits for whole company can be categorized as
• Increase sales revenue
• Reduce product unit costs
• Reduce administrative and clerical overhead
Increase revenue
It's fairly intuitive that shorter design times and faster change cycles yield earlier
product introductions and optimized products, resulting in earlier revenue and
longer product life.
Reduce design time
Increasing efficiency of engineers' work. PDM renders possibilities for the user
which enable shortening design time by:
• speed and accessibility of information offered by the system allows for the
shortening of time required for finding images or other information. It is
estimated that from 25% to 30% of time was wasted by engineers to
retrieve data [13],
• one of the functions offered by PDM is managing work history. It allows
for repeated use of already designed solutions.
• concurrent reviews by consumers of affected data without distracting
designers
• elimination of lost or damaged files
• consistent, data-rich bills of materials with real-time cost roll-ups
Some PLM systems allow tasks to be attached directly to document or part,
keeping both designers and project managers in the loop.
Accelerate release and change cycles
Perhaps the most remarkable impact of PLM is the substantial efficiency
gained when processing product releases and changes. A non-automated process
usually requires extensive document collection and copying efforts, repetitive and
error-prone change order creation, and relying on time-consuming interoffice mail
or on an engineer or change analyst walking the package from office to office.
26
Involving supply chain partners may require express parcels, insecure or lost mail,
irrelevant or incorrect file attachments, and a host of other time-wasters.
Managing engineered changes.
Each PDM system allows for changing or creating new documents in the database
without losing information contained in the previous versions of documentation.
By design, a PLM system contains all product information in a secure central
location; allows multiple users simultaneous access to the data; provides templates
for change types, including pre-defined review workflows, approving departments
and interested observers; identifies all dispositioning tasks and rolls up cost
impacts automatically; and utilizes email so there is no lag between one person's
approval and the next person's notification.
Reduce product cost
Purchase fewer parts in larger volumes
Part re-use is difficult in larger organizations with significant numbers of parts.
Relying on designers' memory or searching through the ERP system is a hit-or-
miss affair, resulting in almost-identical parts being sourced. PLM encourages item
exploration, which avoids sourcing new parts that are functionally similar to items
already in inventory.
Increase production experience
Earlier product introductions ensure longer production runs; increased production
experience results in more rapid, on-going cost reductions.
Reduce production rework and scrap
Changes are reviewed by all affected parties; on-line review and approval is faster
and more comprehensive than paper-based change process; bills of materials are
consistent and can include documentation on production and inspection processes.
Conduct more comprehensive, less intrusive collaboration
Increase of precision in designing and production. PLM allows for
simultaneous work on the same, always up-to-date set of data by many employees.
It eliminates nonconformities in projects and enables time saving.
27
Project control. PLM enables control of a huge amount of data which are created
during the desing process. It eliminates the possibility of unaccomplishment or
delay of planned tasks due to the wrong organization of project supervision.
Real-time visibility into evolving designs encourages early and frequent design
checks; these permit sourcing, production, quality and service specialists, as well as
supply chain partners, to provide timely feedback. Includes all aspects of the
product plans, drawings and procedures for production, inspection, service, repair
and disposal. This information is available in a single location, without having to
distract designers with on-going requests for in-process data.
Better use of teamwork possibilities. The system supports teamwork in three ways:
• saves all documents and introduced changes, which causes the shortening
of time for design and corrections and eliminates potential errors while
designing,
• reduces the probability of project failure by sharing responsibilities and
documentation and making the documentation accessible to people in
charge of the project,
• enabling simultaneous access to the same data allows for a problem to be
solved by a group of employees [13].
Reduction of time needed for launching the new product onto the market is the
most essential advantage provided by a PLM system. The system enables time
reduction by:
• accelerating work by immediate access to information required at a given
moment,
• enabling people in charge to access the data with a guarantee that they will
always receive the latest and most current data [13],
• supporting concurrent engineering.
Simultaneous use of product data is particularly important in the process of
product development. The process can be characterized by the following stages:
• concept (considers catalogs, standards, etc.),
• planning (considers methods),
• modelling (e.g. using 3D CAD system),
• creating sketch/drawing (e.g. using 2D CAD system),
28
• calculation (e.g. Finite-Element Method),
• simulation (using dedicated simulation programs),
• documentation (e.g. text processing).
In order to speed up product development process, there has to be a possibility to
realize these stages simultaneously and/or independently of one another.
Methods supporting the process of product development ensure effective product
development.
These methods are:
• Concurrent Design (CD),
• Simultaneous Engineering (SE), and
• Computer Supported Cooperative Work (CSCW).
Methods of organizing and managing product development are changing.
The change consists in abandoning tailoristic organization and aiming at holistic
organization based on managing product and process data.
Product development organization is usually assigned to the department of
construction and technology. Organization based upon tailoristic approach defines
hierarchies of departments in a company and assigns tasks to them. Every
department is responsible for its own successes and is managed so as to reach their
targets. The results achieved by departments are documented and propagated on
paper (e.g. technical drawings, lists of elements, etc.). Such paper documents are
often subject of analyses to determine efficiency and possibility of success for
departments' actions. Information flow among departments, necessary for
communication, is also based on paper documents. Those paper documents must be
approved by departments which created them. Approving a document means
determining its author and taking the responsibility for its content. It usually leads
to the custom of shifting responsibilities upon other departments and indicates the
possibility of separating departments. Such an approach generates problems if a
quick reaction is required in case of a modification or change and the decision-
making process concerns several departments.
Managing teams preparing production and construction is usually based on
projects. Projects are defined to solve constructional and technological orders.
They consist of tasks assigned to resources and schedule with “milestones” to make
decisions about future work. In tailoristic organization, projects are often defined
29
within a single department. It means that a certain number of projects can be
defined independently of one another. Holistic approach binding several
departments and co-operating companies together is inadmissible in tailoristic
organization.
In the holistic approach, projects integrate expert from various departments
and co-operating companies into project teams. It leads to matrix organization,
where engineers are subordinate to the department manager and project manager.
Projects are defined to optimize the process of product development by achieving
optimal product quality, fulfilling financial objectives and the optimization of
product development time. Product development time is one of the most important
component of success for competing companies. It greatly influences the "time to
production" and "time to market".
Contemporary methods of product development management understand
design and process planning activites as a process, which is part of the product
development project. Such methods are concurrent design and simultaneous
engineering. Both methods aim at fulfilling the premises of the holistic notion of
creating a product.
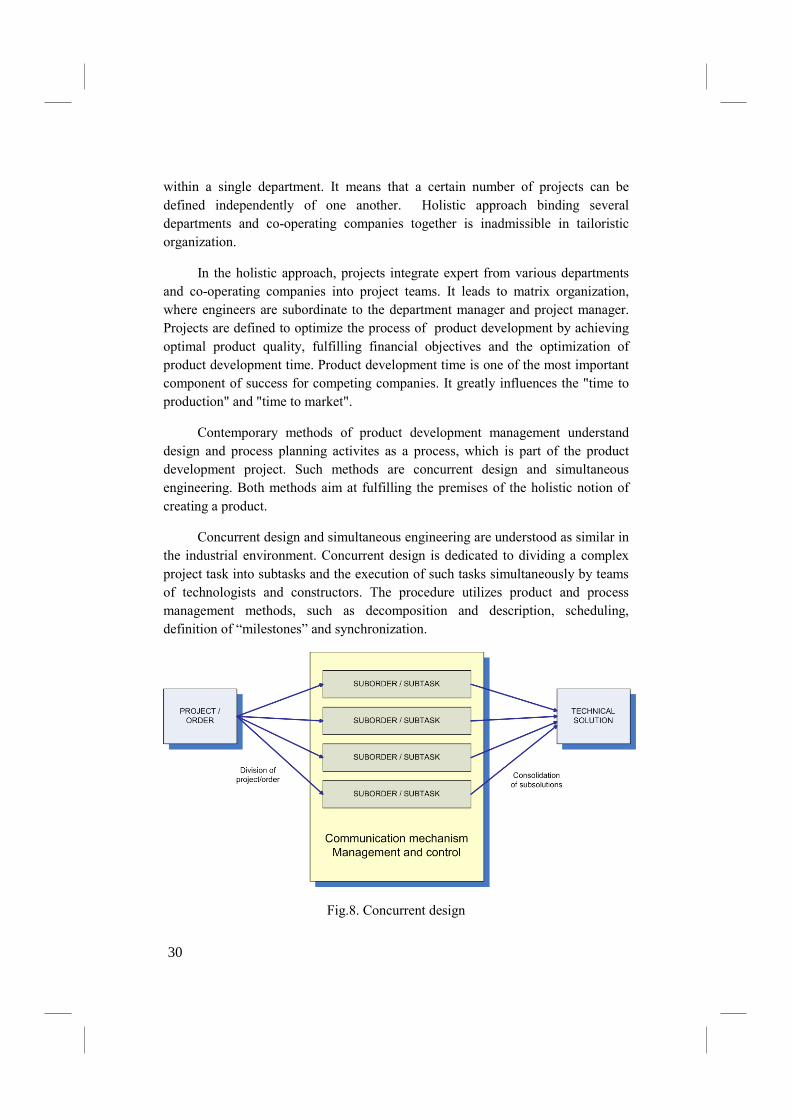
Concurrent design and simultaneous engineering are understood as similar in
the industrial environment. Concurrent design is dedicated to dividing a complex
project task into subtasks and the execution of such tasks simultaneously by teams
of technologists and constructors. The procedure utilizes product and process
management methods, such as decomposition and description, scheduling,
definition of “milestones” and synchronization.
Fig.8. Concurrent design
30
Other objectives of concurrent design are the coordination of co-operating
technologists and constructors, sharing project specifications with team members.
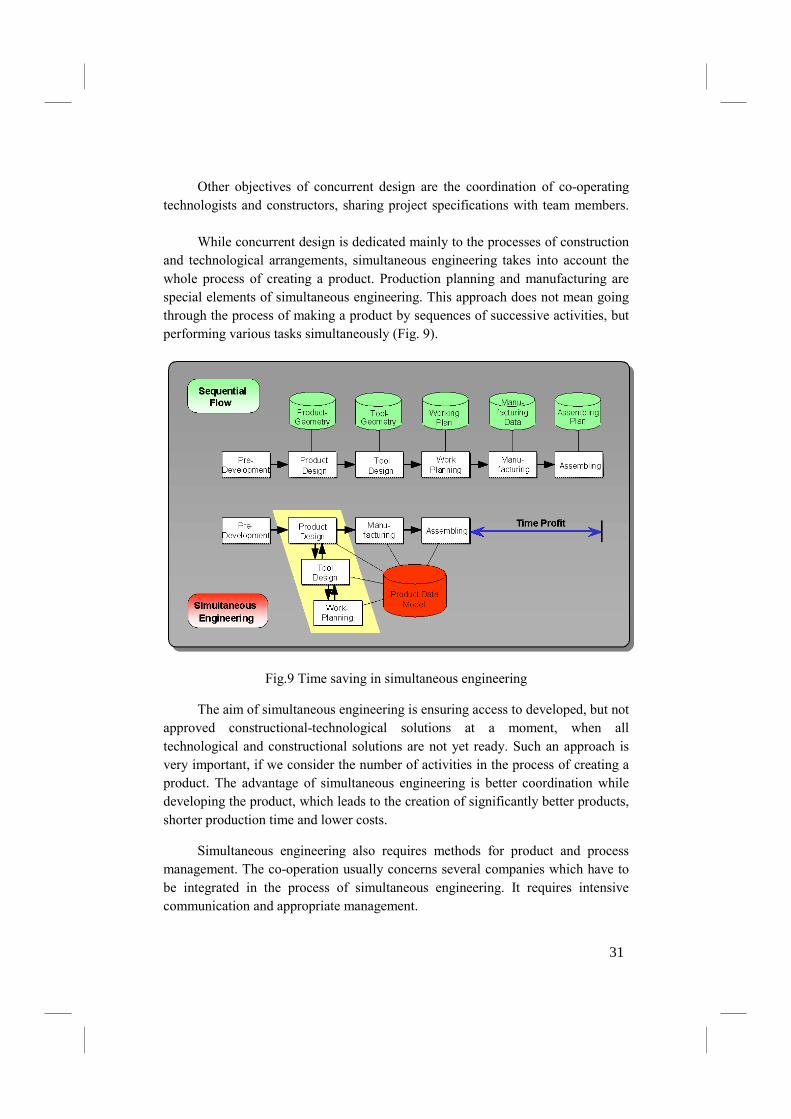
While concurrent design is dedicated mainly to the processes of construction
and technological arrangements, simultaneous engineering takes into account the
whole process of creating a product. Production planning and manufacturing are
special elements of simultaneous engineering. This approach does not mean going
through the process of making a product by sequences of successive activities, but
performing various tasks simultaneously (Fig. 9).
Fig.9 Time saving in simultaneous engineering
The aim of simultaneous engineering is ensuring access to developed, but not
approved constructional-technological solutions at a moment, when all
technological and constructional solutions are not yet ready. Such an approach is
very important, if we consider the number of activities in the process of creating a
product. The advantage of simultaneous engineering is better coordination while
developing the product, which leads to the creation of significantly better products,
shorter production time and lower costs.
Simultaneous engineering also requires methods for product and process
management. The co-operation usually concerns several companies which have to
be integrated in the process of simultaneous engineering. It requires intensive
communication and appropriate management.
31
Advantages coming from the use of CE in PLM systems are visible, among
others, in:
• saving costs in the company;
• reducing product design time;
• reducing product launching time;
• increase of quality;
• and others resulting from individual system applications.
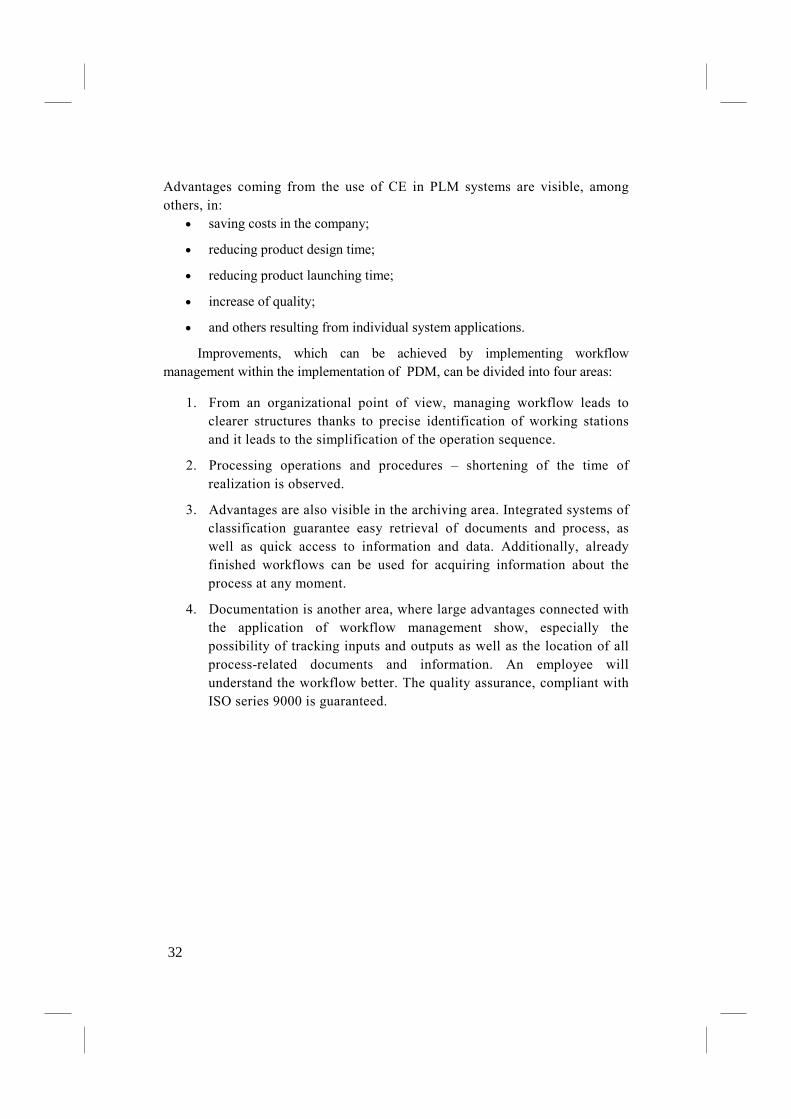
Improvements, which can be achieved by implementing workflow
management within the implementation of PDM, can be divided into four areas:
1. From an organizational point of view, managing workflow leads to
clearer structures thanks to precise identification of working stations
and it leads to the simplification of the operation sequence.
2. Processing operations and procedures – shortening of the time of
realization is observed.
3. Advantages are also visible in the archiving area. Integrated systems of
classification guarantee easy retrieval of documents and process, as
well as quick access to information and data. Additionally, already
finished workflows can be used for acquiring information about the
process at any moment.
4. Documentation is another area, where large advantages connected with
the application of workflow management show, especially the
possibility of tracking inputs and outputs as well as the location of all
process-related documents and information. An employee will
understand the workflow better. The quality assurance, compliant with
ISO series 9000 is guaranteed.
32
Fig.10 Advantages coming from the application of workflow management systems
Reduce overhead
Simplify regulatory and contractual compliance
If your development or production process is subject to audit by a third party, a
PLM product can simplify review and acceptance. It's far easier to document your
process when it's based on commercial-grade documentation and system
configuration reports, particularly if the PLM vendor is sensitive to regulatory
issues, and has experience designing compliant products. 9
Mitigate and, if required, report on a product's environmental impact
Government regulations both restrict the types of materials contained in products
and specify more stringent environmental-impact reporting.
Europe's Waste Electrical and Electronic Equipment ("WEEE") and Restriction of
Hazardous Substances in Electrical and Electronic Equipment ("RoHS") directives
address product environmental impact and require material tracking and, in some
cases, data reporting. The US Environmental Agency also prohibits or restricts the
use of certain hazardous materials, and your company may be required to track and
report on certain compositions.
33
New efforts are underway, particularly in the electronics and automotive industries,
to increase the use of environmentally-friendly materials, and supply chain partners
often require detailed materials reporting via a Materials Declaration.
Manual calculations, particularly for hazardous substances that are measured in
parts per million (ppm) or parts per billion (ppb), can be time-consuming,
imprecise and error-prone. PLM systems that can automatically calculate and
report product material composition across a bill of materials radically simplify the
task.
Reduce process administrative and clerical costs
Depending on your industry, for every 8 to 12 engineers and designers a manual
document control and change management process may require a change analyst,
administrator, document checker, or clerk. Implementing a PLM system may allow
you to cut that ratio to 20:1 or better.
PLM offers many ways to solve problems and seize market opportunities. Each
company will apply it in a different way but all will find that the benefits are
substantial.
Many companies have improved competitiveness through successful
implementation of PLM technologies, reducing, for example, product development
costs by 15%, product development time by 25%, engineering change time by
30%, and the number of engineering changes by 40%. Results like these have a
significant impact on an organisation’s competitiveness.
Examples
Baldwin Filters
Baldwin Filters designs and manufactures more than 4,000 different types of air,
coolant, diesel/gas fuel, hydraulic, lube, and transmission filters. Baldwin’s 20-
person engineering staff and 10-person support team introduce an average of 700
new filters per year. In the past, processing up to three new products and an
average of 12 engineering change orders (ECOs) per day generated an amount of
paperwork that slowed down Baldwin’s engineers. Baldwin installed the eMatrix
solution from MatrixOne. Through eMatrix automation, Baldwin estimates that the
company saved about one month per ECO, a saving of $125,000 per year. Baldwin
then focused on automating its five-step New Product Release process. With this
process automated through the eMatrix solution, management estimates that the
34
company will reduce the product development cycle by one month and produce
$50,000 in additional revenue per year.
(http://www.matrixone.com/pdf/ds_cs_baldwin.pdf)
Boeing Commercial Airplanes
Boeing Commercial Airplanes controls product configuration for the 737, 747,
757, 767, and 777 airplanes on one collaborative platform accessible to more than
25,000 globally distributed users. Teamcenter from UGS PLM Solutions provides
Commercial Airplanes with one single source of product definition so product
configuration data is available in one complete system. Previously, essential
product information was stored in hundreds of legacy systems. With the
implementation of Teamcenter, Commercial Airplanes ended reliance on manual
processes – some of which had been in place since the early 1940s. For the 737
alone, 12.9 million records were migrated into Teamcenter. All airplanes, each
with up to four million parts, are under Teamcenter control when they ship from
Boeing.
(http://www.eds.com/news release template.shtml?rowid_3649)
B/E Aerospace Seating Products Group
B/E Aerospace Seating Products Group (SPG) is the world’s largest manufacturer
of commercial aircraft seats, with an installed base of more than a million seats in
service. SPG works with a database that contains 3.7 million parts and roughly 10
million single-level Bills of Material (BOMs). An airliner may have anywhere
from 15 to 25 different seat part numbers, and each seat could have anywhere from
800 to 1500 parts, not to mention the trim and finish requirements. SPG deployed
Agile Product Collaboration. Benefits included improved profitability through
increased engineering productivity, reduced required headcounts in product content
management teams, increased efficiency by eliminating manual processes
transferring data into the corporate ERP system, and improved product quality
while reducing costs.
(http://www.agile.com/customers/successStories.asp?view_18)
Char-Broil
Char-Broil, a manufacturer of outdoor cooking products, implemented PTC’s
Windchill to shorten the development cycle to enable a later start, more current
market input and tighter collaboration with suppliers. Benefits included new
product development cycles reduced by 25% and overhead reduced by about 1,320
hours per year.
(http://www.ptc.com/appserver/it/icm/cda/template_lib/icm01_customer_v.jsp?im_
dbkey_2390)
35
Dell Computer
Dell Computer implemented software from Agile Software and reduced the
resources necessary to process engineering changes by more than 30%. The
average time to process an engineering change dropped by 50%. 30% fewer people
were needed for configuration management globally, since employees are able to
process four times as many engineering changes as they had done previously.
(http://www.agile.com/pressreleases/index.asp?view_16)
Hewlett-Packard Co.
Hewlett-Packard Co. used PTC’s Windchill to improve their product development
process. HP achieved an 80% improvement in design and process reuse. Time-to-
market, product cost, and warranty cost fell. Productivity rose between 20% and
30%
(http://www.ptc.com/appserver/mkt/solutions/index.jsp?s_181&k_0)
Japan Electron Optics Laboratory
Japan Electron Optics Laboratory (JEOL) manufactures microscopes, and other
scientific and metrological instruments. It implemented eMatrix from MatrixOne.
With eMatrix, JEOL made significant savings by reducing product development
time by 30%. JEOL’s eMatrix collaboration platform holds some 7 million product
component data items, 400,000 drawings, 20,000 catalogue items, and 5,000
technical documents.
(http://www.matrixone.com/pdf/ds_cs_jeol.pdf)
�EC Computers
NEC Computers, using the Agile Product Collaboration solution suite, quoted an
efficiency increase estimated at 30% savings in monthly engineering workload.
Quality improvement impacts included a more than 10% improvement in the Bill
of Material (BOM) error rate and nearly 70% reduction in Engineering Change
Notification (ECN) management errors. The quality improvements resulted in a
39% reduction in scrap and rework costs.
(http://www.agile.com/customers/successStories.asp?view_29)
�ikon Corporation Imaging Company
Nikon’s Imaging Company wanted to speed the distribution of design drawings
within the organisation, to reduce paper usage, and to decrease the time required to
access existing product drawings. The company produces almost 15,000 design
drawings annually and has accumulated several hundred thousand pages over the
years. Distributing the drawings on paper required a lot of time and energy. Nikon
36
has multiple operation sites, including some in overseas locations. It took a
minimum of 72 hours to send drawings overseas by airmail. Another problem was
the time to retrieve drawings in paper or microfilm format. The time to find a
drawing was, on average, 9.7 minutes per item. About 6,400 documents are
retrieved per month. Teamcenter, from UGS PLM, was implemented. Results
included: drawing distribution takes less than one-tenth the time; paper usage was
reduced by 80%; drawings are retrieved five times faster; easier tracking of
changes, and easier identification of orders affected by changes.
(http://www.eds.com/products/plm/success/teamcenter/nikon.shtml)
Oklahoma City Air Logistics Center
The Oklahoma City Air Logistics Center (OC/ALC) manages an inventory of more
than 2,000 aircraft as well as nearly 23,000 jet engines. The Engineering Data
Section needed to adjust to smaller budget and staff by streamlining processes and
providing faster response to requests for data. It looked for a better way to manage
engineering data spread out over 18 non-integrated legacy databases – millions of
physical drawings, some over 40 years old, as well as documents in raster, PDF,
and CAD formats. Fourteen business processes related to the acquisition,
management, and delivery of that data had to be streamlined. OC/ALC selected
Teamcenter, from UGS PLM. After mapping more than 10 million index records
(raster and PDF document indexes, aperture card indexes, mylar card indexes, and
so on), nearly instant location access is possible for both on-line and off-line data.
The time needed to process data requests has dropped from 53 days to 28.All data
requests are tracked, allowing data center management to see where bottlenecks are
happening and redirect personnel to alleviate them.
(http://www.eds.com/products/plm/success/teamcenter/oklahoma_alx.shtml)
Rockwell Automation
Rockwell Automation’s business issue was to achieve “design anywhere, build
anywhere, support anywhere” capability to ensure fast product development and
lowest costs. Rockwell Automation implemented Teamcenter, from UGS PLM, at
sites around the world to control information access and manage critical activities.
The results included: engineering change notice (ECN) cycle time cut in half (the
paperbased process handled 2,000 ECNs annually with the average one taking 74
days); cost per ECN reduced by $200 for $400,000 annual savings in just one
business unit; ECN and drafting backlogs eliminated; infrastructure in place for
global operation.
(http://www.eds.com/products/plm/success/teamcenter/rockwell.shtml)
37
Shell Oil Products Company
Shell Oil Products Company has used Cimmetry Systems’ AutoVue as a viewing
and markup tool for over three years at its oil products manufacturing division and
refinery located in Martinez, CA. AutoVue has been integrated into an in-house
application for tracking about 130,000 engineering drawings kept at the plant.
Users can query the database in various ways and then display drawings. A core
group of about 100 of the 1,000 employees at the facility frequently access
AutoVue. In one particular month, 1,448 AutoCAD drawings, 17 MicroStation and
194 scanned images were viewed with AutoVue. Accessing the drawings from an
individual workstation can save hours of effort as staff no longer have to drive
miles across the sprawling plant in their search efforts. AutoVue has saved Shell
Oil several hundred thousand dollars since it was implemented.
(http://www.cimmetry.com/cimweb.nsf/pages/ShellOilCompany)
Webasto
Webasto implemented PTC’s Windchill solution to: support the exchange of part
and project information world-wide; act as the communication link with customers
and suppliers; standardise processes such as change management for Webasto
world-wide; integrate heterogeneous CAD systems and different installations of
ERP systems. Benefits included: shortening development time by making data easy
to find and available world-wide; reducing costs by minimising physical prototypes
and reducing duplicate data entry; accelerating international co-ordination from
five days to just a few minutes.
(http://www.ptc.com/appserver/it/icm/cda/template_lib/icm01_customer_v.jsp?im_
dbkey_17043)
38
PLM fundamentals The functionality that will be needed in a PLM solution can be grouped and
described in different ways. Different companies will look for different groups of
functions. Not all functionality will be needed by a particular company. The
following list shows one way of classifying the functions, and indicates the
percentage contribution of each group in a particular PLM environment:
• Product data management (20%)
• Product and process definition (15%)
• Configuration management (10%)
• Collaboration software (10%)
• Customer-oriented applications (10%)
• Visualisation/Viewing (5%)
• Data exchange (5%)
• Supplier-oriented applications (5%)
• Definition and management of product lifecycle processes (5%)
• Project management (5%)
• Portfolio management (5%)
• Integration (5%).
PLM (Product Lifecycle Management) class systems, used to management
the product lifecycle, have developed on the base of PDM (Product Data
Management) systems, which, in turn, were based on the CIM concepts. PDM is
the primary system component of PLM. They are systems to manage product data
and product workflow. The basic components of a PDM system include:
• The information warehouse or vault. This is where product data is stored.
• The information management module, which manages the information
warehouse. It is responsible for such issues as data access, storage and
recall,information security and integrity, concurrent use of data, and
archival andrecovery. It provides traceability of all actions taken on
product data.
39
• The user interface. This provides a standard, but tailorable, interface for
users. It supports user queries, menu-driven and forms-driven input, and
report generation.
• System interfaces for programs such as CAD and ERP
• Information and workflow structure definition functions which are used to
define the structure of the data and workflows to be managed by the PDM
system. The workflow is made up of a set of tasks. Data such as resources,
events, responsibilities, procedures and standards can be associated to these
tasks.
• Information structure management functions that maintain the exact
structure of all information in the system across the product lifecycle
• Workflow management functions that keep workflow under control, for
example, managing engineering changes and revisions
• System administration functionality which is used to set up, and maintain,
the configuration of the system, and to assign and modify access rights.
Whatever the PLM strategy that is chosen, it is probable that PDM will be a
major constituent. Unless the product data in the product lifecycle is under control,
it will be difficult to get the product under control.
Structure of PDM systems
PDM as a concept of product data management requires four basic elements
to function:
• Network and communication. There should be a local-area (LAN) and
wide-area network infrastructure, for a possibility of co-operation between
users inside the company and the users from co-operating firms.
• Source data. They are often non-uniform data coming from different
systems and applications: CAD, CAM, CAE files, scanned documents, text
documents, spreadsheets, etc.
• Applications. PDM is an open system, which can co-operate with various
application via built-in interfaces. In such applications, product data are
created to be managed by a PDM system.
• Data management system. It encompasses supporting company's standards
and database management. Currently, relational systems of database
40
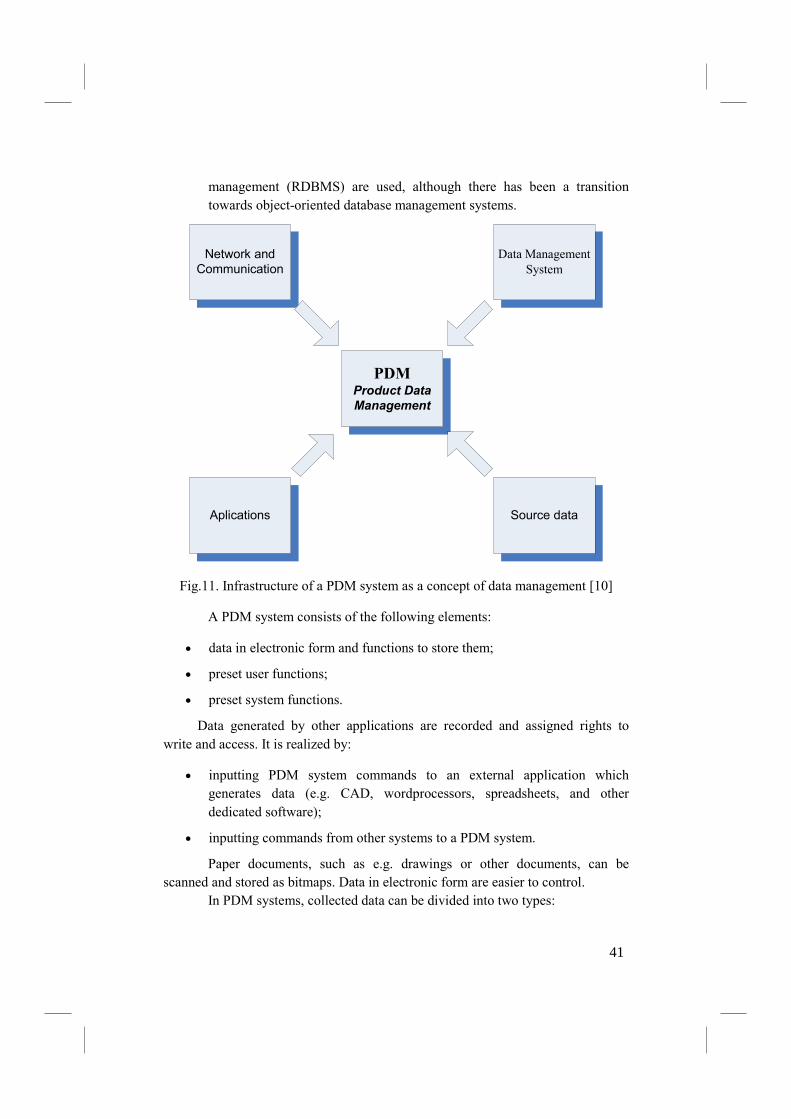
management (RDBMS) are used, although there has been a transition
towards object-oriented database management systems.
Network and
Communication
Data Management
System
Aplications Source data
PDMProduct Data
Management
Fig.11. Infrastructure of a PDM system as a concept of data management [10]
A PDM system consists of the following elements:
• data in electronic form and functions to store them;
• preset user functions;
• preset system functions.
Data generated by other applications are recorded and assigned rights to
write and access. It is realized by:
• inputting PDM system commands to an external application which
generates data (e.g. CAD, wordprocessors, spreadsheets, and other
dedicated software);
• inputting commands from other systems to a PDM system.
Paper documents, such as e.g. drawings or other documents, can be
scanned and stored as bitmaps. Data in electronic form are easier to control.
In PDM systems, collected data can be divided into two types:
41
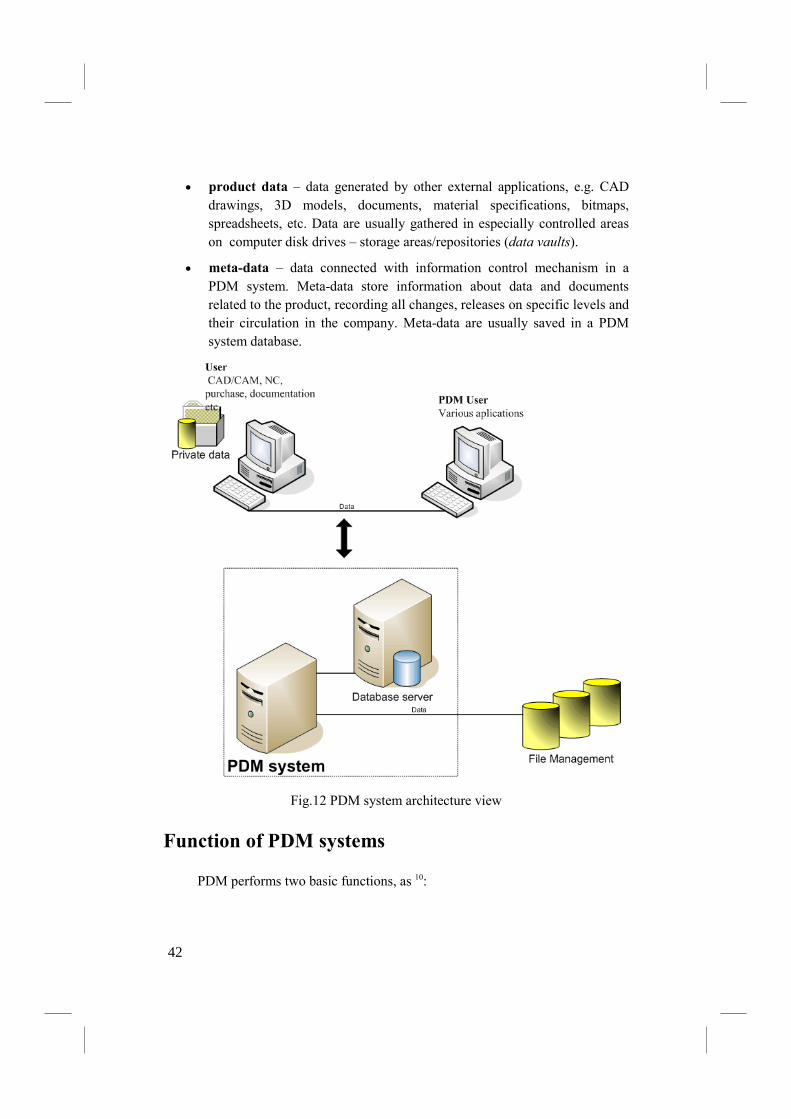
• product data – data generated by other external applications, e.g. CAD
drawings, 3D models, documents, material specifications, bitmaps,
spreadsheets, etc. Data are usually gathered in especially controlled areas
on computer disk drives – storage areas/repositories (data vaults).
• meta-data – data connected with information control mechanism in a
PDM system. Meta-data store information about data and documents
related to the product, recording all changes, releases on specific levels and
their circulation in the company. Meta-data are usually saved in a PDM
system database.
Fig.12 PDM system architecture view
Function of PDM systems
PDM performs two basic functions, as 10:
42
• a concept in product data management in a company;
• system of product data management.
Administration and storing product data is a basic function of PDM systems.
On the one hand, product data consist of data determining a product, such as 3D
CAD models, technical drawings, MES models. On the other, product data contain
company's know-how, such as information about costs, repeating elements,
machines and tools. Additionally, such data consist of generally available
information, such as standard elements, catalog events and technological data.
A great significance of administrative functions arises from the increased
variability of information, which is the result of intensive utilization of CAx and
other systems. Product-related data have complex relations with one another,
additionally such relations may undergo dynamic changes.
Functionality of PDM systems is limited to two categories: user functions
and utility functions.
User functions provide a system user with PDM system interfaces including
data recording, retrieving and management. As different groups of users require
different functions, user functions are divided into five categories:
• Data and document management;
• Workflow and process management;
• Product structure management;
• Classifications;
• Project management.
System functions facilitate using the system and support user functions.
System functions influence operating environment and isolate the user from it.
System functions include:
• Communication and notification;
• Data transport;
• Data Translation;
• System Administration.
43
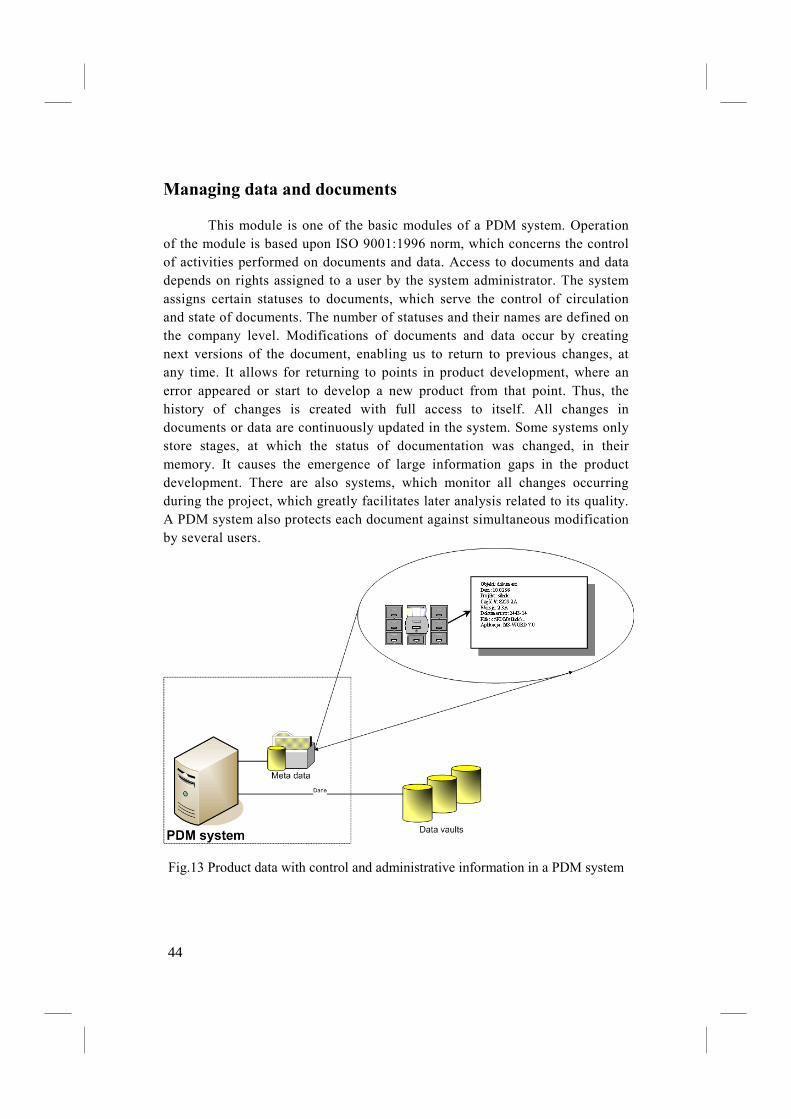
Managing data and documents
This module is one of the basic modules of a PDM system. Operation
of the module is based upon ISO 9001:1996 norm, which concerns the control
of activities performed on documents and data. Access to documents and data
depends on rights assigned to a user by the system administrator. The system
assigns certain statuses to documents, which serve the control of circulation
and state of documents. The number of statuses and their names are defined on
the company level. Modifications of documents and data occur by creating
next versions of the document, enabling us to return to previous changes, at
any time. It allows for returning to points in product development, where an
error appeared or start to develop a new product from that point. Thus, the
history of changes is created with full access to itself. All changes in
documents or data are continuously updated in the system. Some systems only
store stages, at which the status of documentation was changed, in their
memory. It causes the emergence of large information gaps in the product
development. There are also systems, which monitor all changes occurring
during the project, which greatly facilitates later analysis related to its quality.
A PDM system also protects each document against simultaneous modification
by several users.
Fig.13 Product data with control and administrative information in a PDM system
44
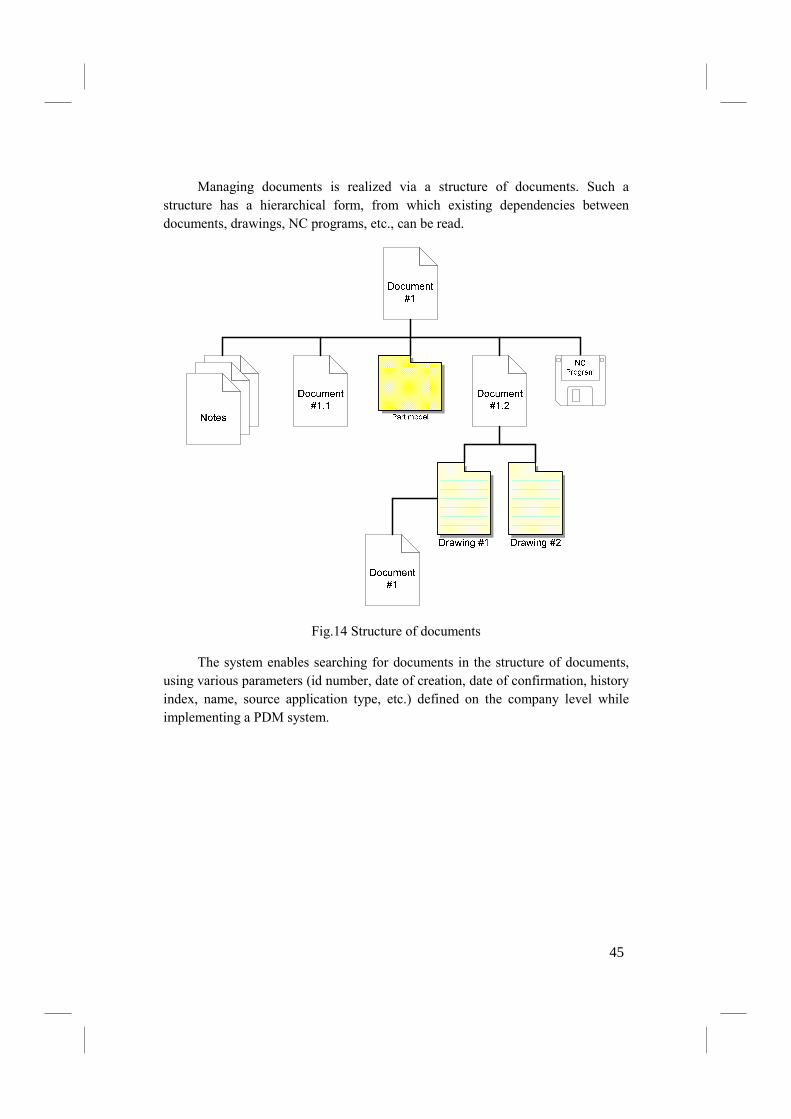
Managing documents is realized via a structure of documents. Such a
structure has a hierarchical form, from which existing dependencies between
documents, drawings, NC programs, etc., can be read.
Fig.14 Structure of documents
The system enables searching for documents in the structure of documents,
using various parameters (id number, date of creation, date of confirmation, history
index, name, source application type, etc.) defined on the company level while
implementing a PDM system.
45
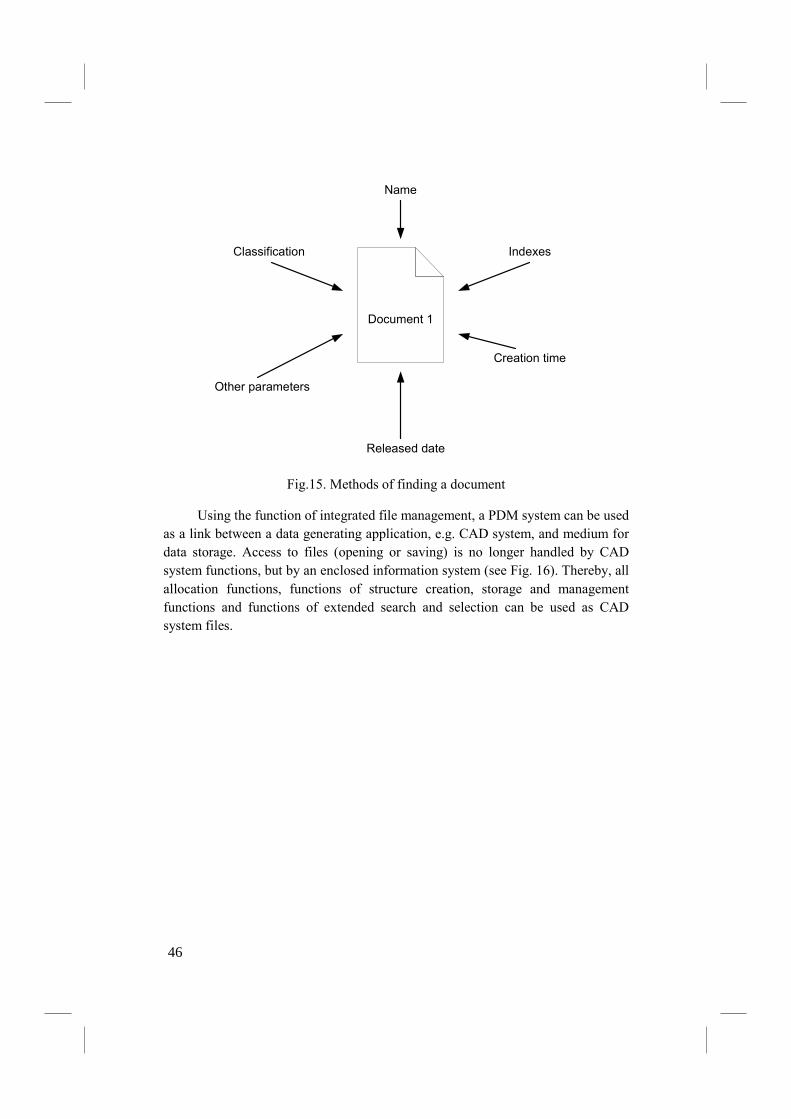
Document 1
Classification
Name
Indexes
Creation time
Released date
Other parameters
Fig.15. Methods of finding a document
Using the function of integrated file management, a PDM system can be used
as a link between a data generating application, e.g. CAD system, and medium for
data storage. Access to files (opening or saving) is no longer handled by CAD
system functions, but by an enclosed information system (see Fig. 16). Thereby, all
allocation functions, functions of structure creation, storage and management
functions and functions of extended search and selection can be used as CAD
system files.
46
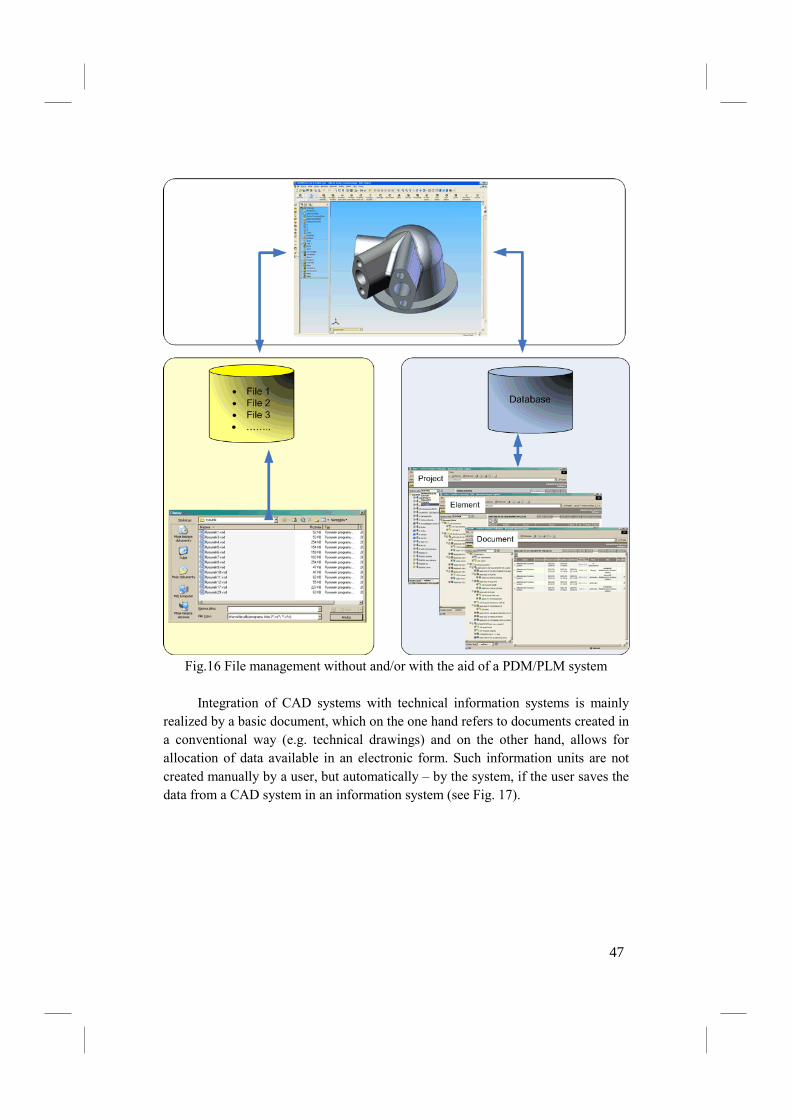
Fig.16 File management without and/or with the aid of a PDM/PLM system
Integration of CAD systems with technical information systems is mainly
realized by a basic document, which on the one hand refers to documents created in
a conventional way (e.g. technical drawings) and on the other hand, allows for
allocation of data available in an electronic form. Such information units are not
created manually by a user, but automatically – by the system, if the user saves the
data from a CAD system in an information system (see Fig. 17).
47
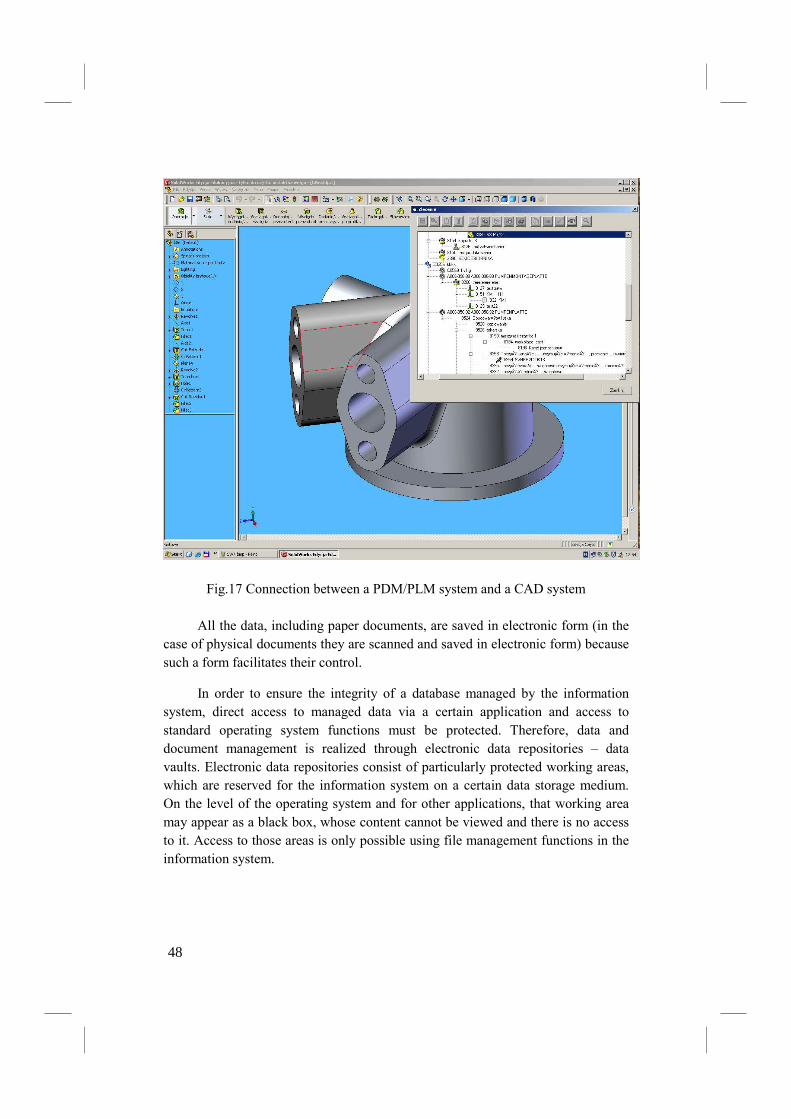
Fig.17 Connection between a PDM/PLM system and a CAD system
All the data, including paper documents, are saved in electronic form (in the
case of physical documents they are scanned and saved in electronic form) because
such a form facilitates their control.
In order to ensure the integrity of a database managed by the information
system, direct access to managed data via a certain application and access to
standard operating system functions must be protected. Therefore, data and
document management is realized through electronic data repositories – data
vaults. Electronic data repositories consist of particularly protected working areas,
which are reserved for the information system on a certain data storage medium.
On the level of the operating system and for other applications, that working area
may appear as a black box, whose content cannot be viewed and there is no access
to it. Access to those areas is only possible using file management functions in the
information system.
48
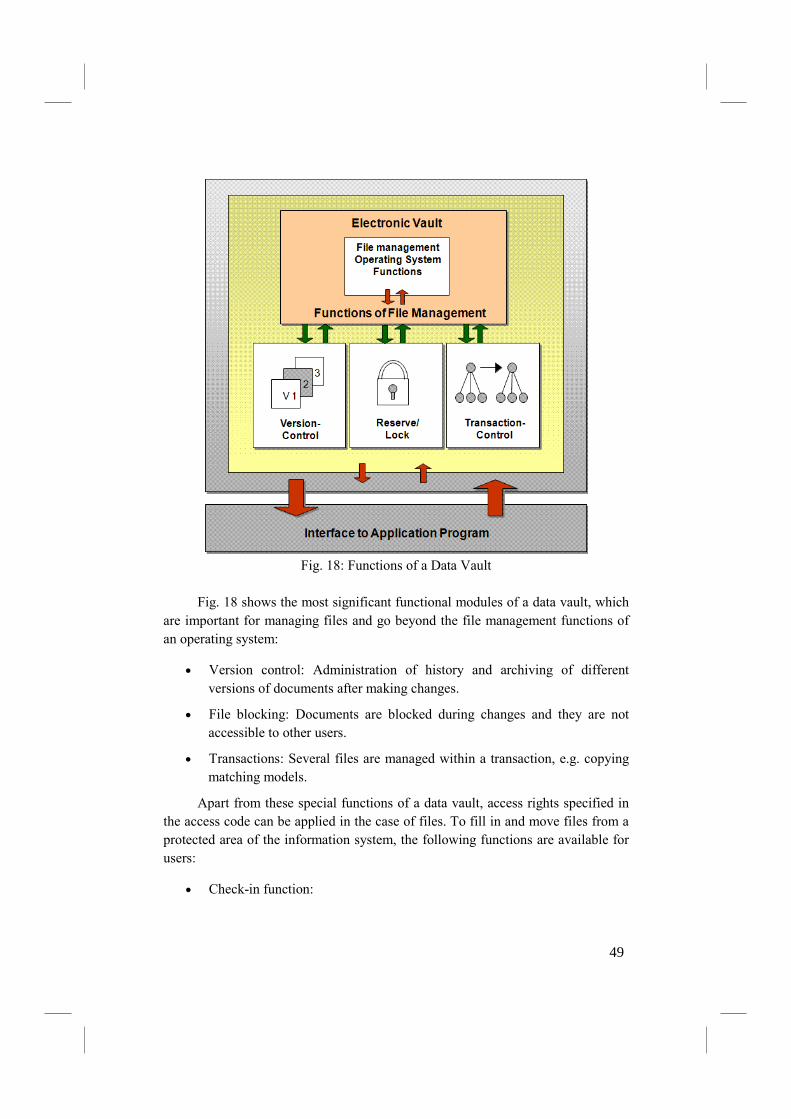
Fig. 18: Functions of a Data Vault
Fig. 18 shows the most significant functional modules of a data vault, which
are important for managing files and go beyond the file management functions of
an operating system:
• Version control: Administration of history and archiving of different
versions of documents after making changes.
• File blocking: Documents are blocked during changes and they are not
accessible to other users.
• Transactions: Several files are managed within a transaction, e.g. copying
matching models.
Apart from these special functions of a data vault, access rights specified in
the access code can be applied in the case of files. To fill in and move files from a
protected area of the information system, the following functions are available for
users:
• Check-in function:
49
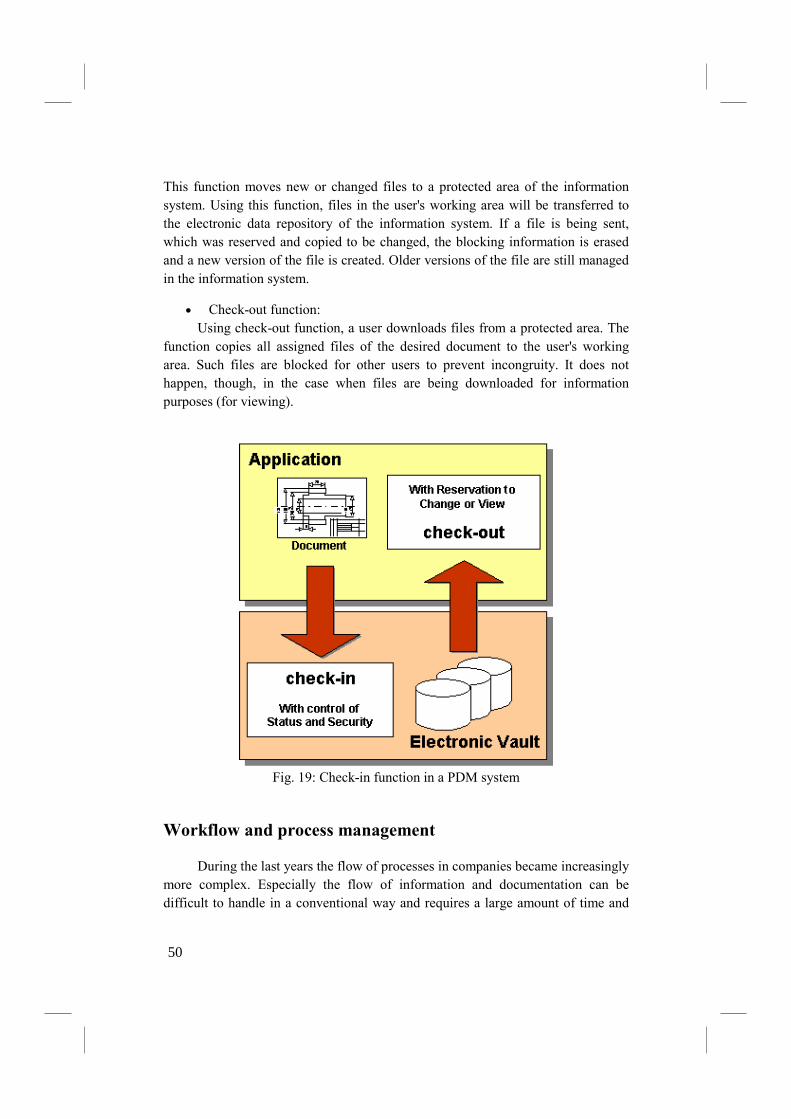
This function moves new or changed files to a protected area of the information
system. Using this function, files in the user's working area will be transferred to
the electronic data repository of the information system. If a file is being sent,
which was reserved and copied to be changed, the blocking information is erased
and a new version of the file is created. Older versions of the file are still managed
in the information system.
• Check-out function:
Using check-out function, a user downloads files from a protected area. The
function copies all assigned files of the desired document to the user's working
area. Such files are blocked for other users to prevent incongruity. It does not
happen, though, in the case when files are being downloaded for information
purposes (for viewing).
Fig. 19: Check-in function in a PDM system
Workflow and process management
During the last years the flow of processes in companies became increasingly
more complex. Especially the flow of information and documentation can be
difficult to handle in a conventional way and requires a large amount of time and
50
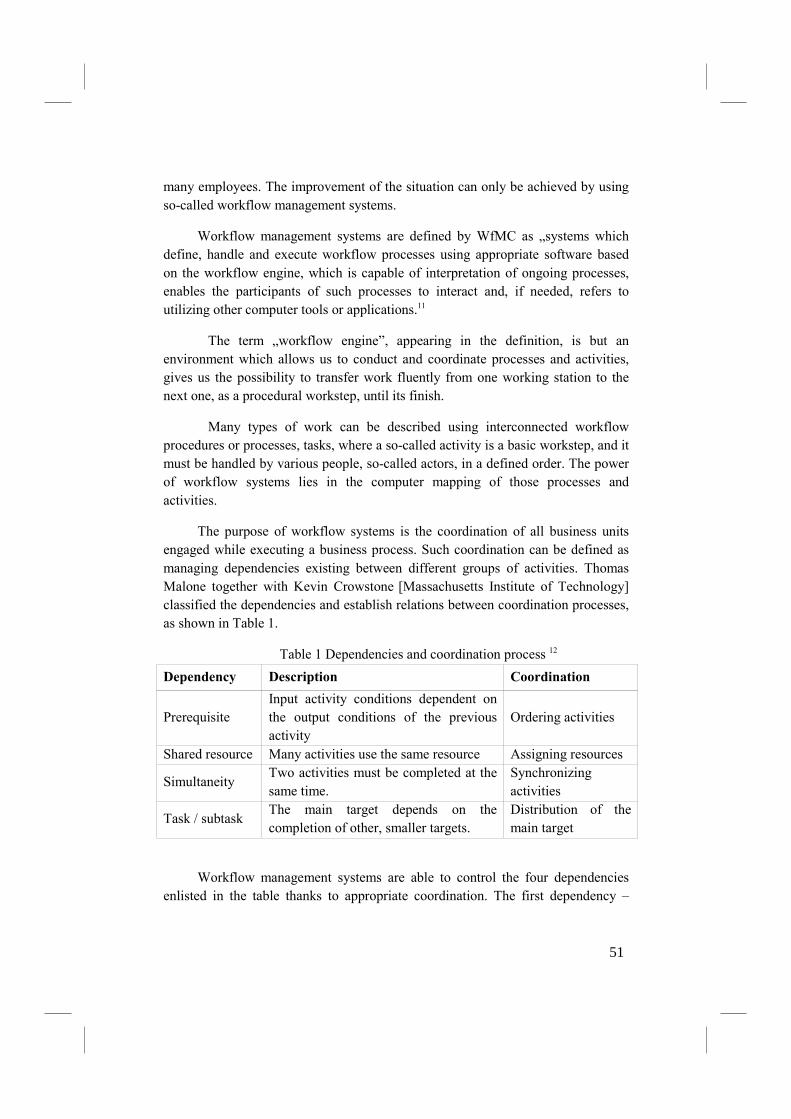
many employees. The improvement of the situation can only be achieved by using
so-called workflow management systems.
Workflow management systems are defined by WfMC as „systems which
define, handle and execute workflow processes using appropriate software based
on the workflow engine, which is capable of interpretation of ongoing processes,
enables the participants of such processes to interact and, if needed, refers to
utilizing other computer tools or applications.11
The term „workflow engine”, appearing in the definition, is but an
environment which allows us to conduct and coordinate processes and activities,
gives us the possibility to transfer work fluently from one working station to the
next one, as a procedural workstep, until its finish.
Many types of work can be described using interconnected workflow
procedures or processes, tasks, where a so-called activity is a basic workstep, and it
must be handled by various people, so-called actors, in a defined order. The power
of workflow systems lies in the computer mapping of those processes and
activities.
The purpose of workflow systems is the coordination of all business units
engaged while executing a business process. Such coordination can be defined as
managing dependencies existing between different groups of activities. Thomas
Malone together with Kevin Crowstone [Massachusetts Institute of Technology]
classified the dependencies and establish relations between coordination processes,
as shown in Table 1.
Table 1 Dependencies and coordination process 12
Dependency Description Coordination
Prerequisite
Input activity conditions dependent on
the output conditions of the previous
activity
Ordering activities
Shared resource Many activities use the same resource Assigning resources
Simultaneity Two activities must be completed at the
same time.
Synchronizing
activities
Task / subtask The main target depends on the
completion of other, smaller targets.
Distribution of the
main target
Workflow management systems are able to control the four dependencies
enlisted in the table thanks to appropriate coordination. The first dependency –
51
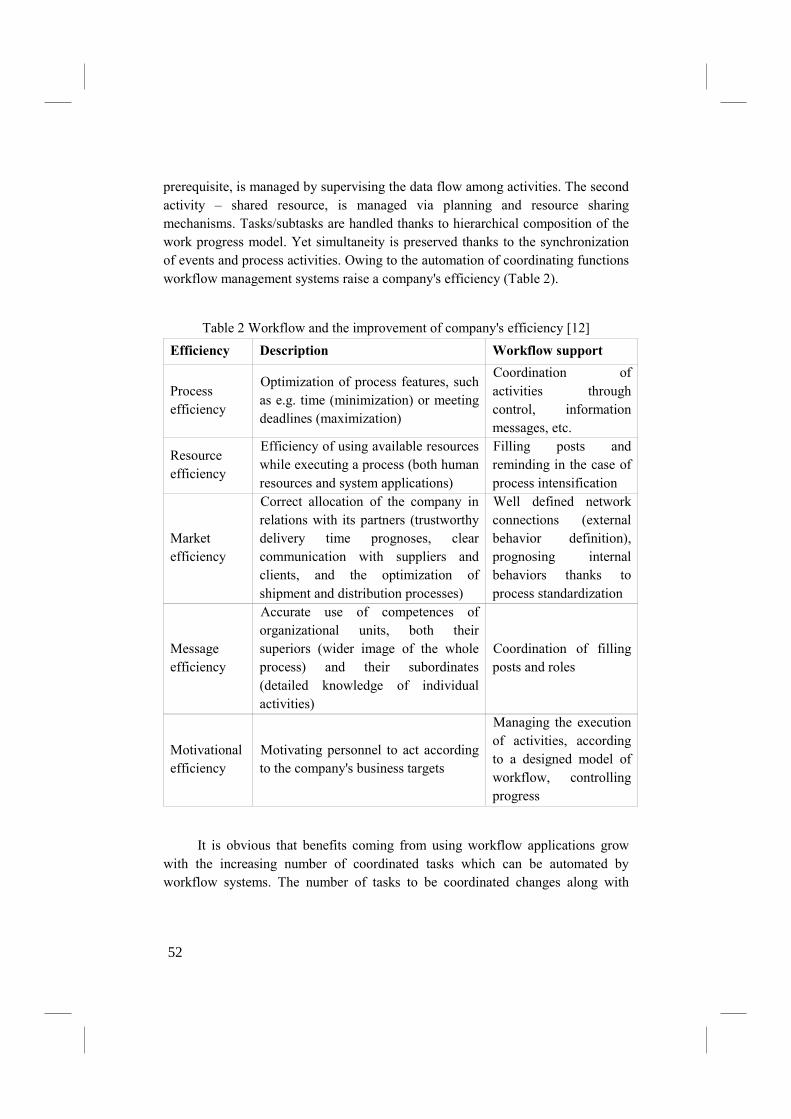
prerequisite, is managed by supervising the data flow among activities. The second
activity – shared resource, is managed via planning and resource sharing
mechanisms. Tasks/subtasks are handled thanks to hierarchical composition of the
work progress model. Yet simultaneity is preserved thanks to the synchronization
of events and process activities. Owing to the automation of coordinating functions
workflow management systems raise a company's efficiency (Table 2).
Table 2 Workflow and the improvement of company's efficiency [12]
Efficiency Description Workflow support
Process
efficiency
Optimization of process features, such
as e.g. time (minimization) or meeting
deadlines (maximization)
Coordination of
activities through
control, information
messages, etc.
Resource
efficiency
Efficiency of using available resources
while executing a process (both human
resources and system applications)
Filling posts and
reminding in the case of
process intensification
Market
efficiency
Correct allocation of the company in
relations with its partners (trustworthy
delivery time prognoses, clear
communication with suppliers and
clients, and the optimization of
shipment and distribution processes)
Well defined network
connections (external
behavior definition),
prognosing internal
behaviors thanks to
process standardization
Message
efficiency
Accurate use of competences of
organizational units, both their
superiors (wider image of the whole
process) and their subordinates
(detailed knowledge of individual
activities)
Coordination of filling
posts and roles
Motivational
efficiency
Motivating personnel to act according
to the company's business targets
Managing the execution
of activities, according
to a designed model of
workflow, controlling
progress
It is obvious that benefits coming from using workflow applications grow
with the increasing number of coordinated tasks which can be automated by
workflow systems. The number of tasks to be coordinated changes along with
52
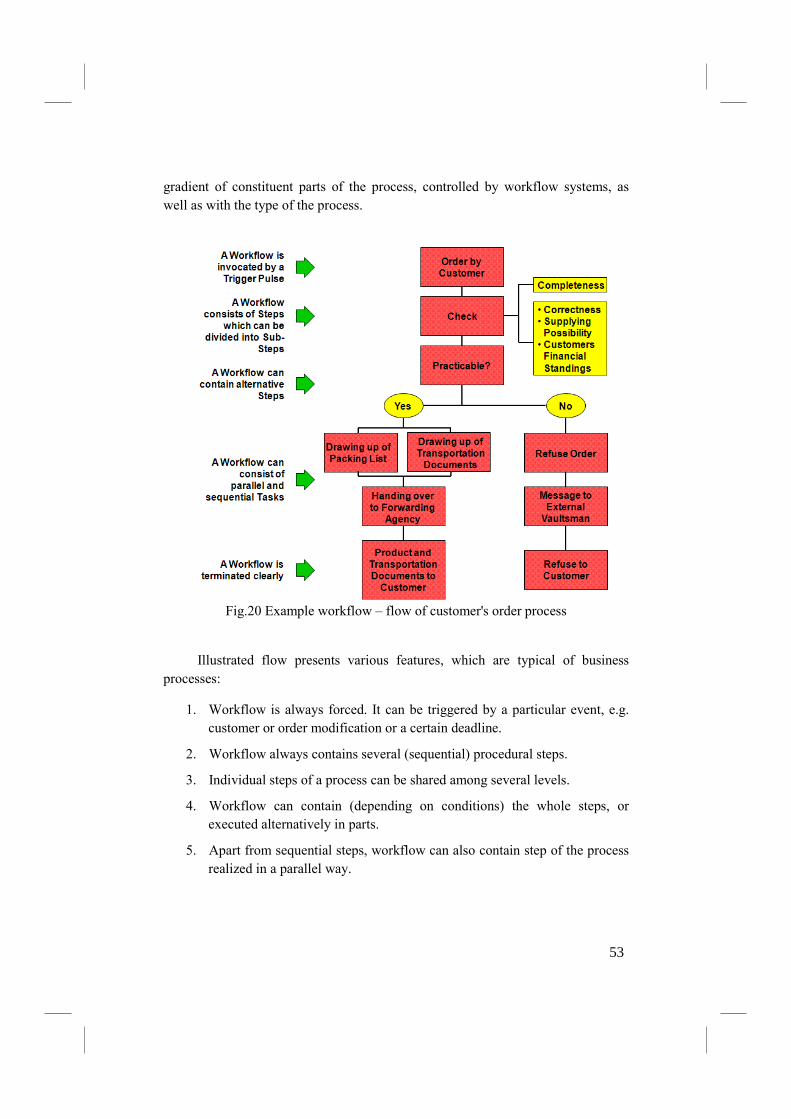
gradient of constituent parts of the process, controlled by workflow systems, as
well as with the type of the process.
Fig.20 Example workflow – flow of customer's order process
Illustrated flow presents various features, which are typical of business
processes:
1. Workflow is always forced. It can be triggered by a particular event, e.g.
customer or order modification or a certain deadline.
2. Workflow always contains several (sequential) procedural steps.
3. Individual steps of a process can be shared among several levels.
4. Workflow can contain (depending on conditions) the whole steps, or
executed alternatively in parts.
5. Apart from sequential steps, workflow can also contain step of the process
realized in a parallel way.
53
6. Workflow is always closed, either after reaching desired results or by
aborting the process.
In practice, there is plenty of various types of business processes. They may
be characterized by various attributes. Below, the most important workflow
attributes are briefly described:
• Level of process complexity depends on quality and number of variants of
its steps, as well as on the existing dependency between those steps. The
level of complexity is high, if the number of parallel or alternative steps is
high.
• Detail level describes the decomposition of the process into partial steps. If
the steps contain large subtasks, the detail level is high.
• Level of work division means the number of employees needed to reach
desired results.
• Process integration means the quality of existing interfaces between
various process steps (shared data, resources, employees).
• Dynamics of the workflow illustrates the level of changes dependent on the
process, caused by other steps of the process.
• The speed of tasks is a further attribute describing how often a certain
workflow is performed.
Based on two business processes, Fig. 21 presents different characteristics of
the aforesaid attributes.
54
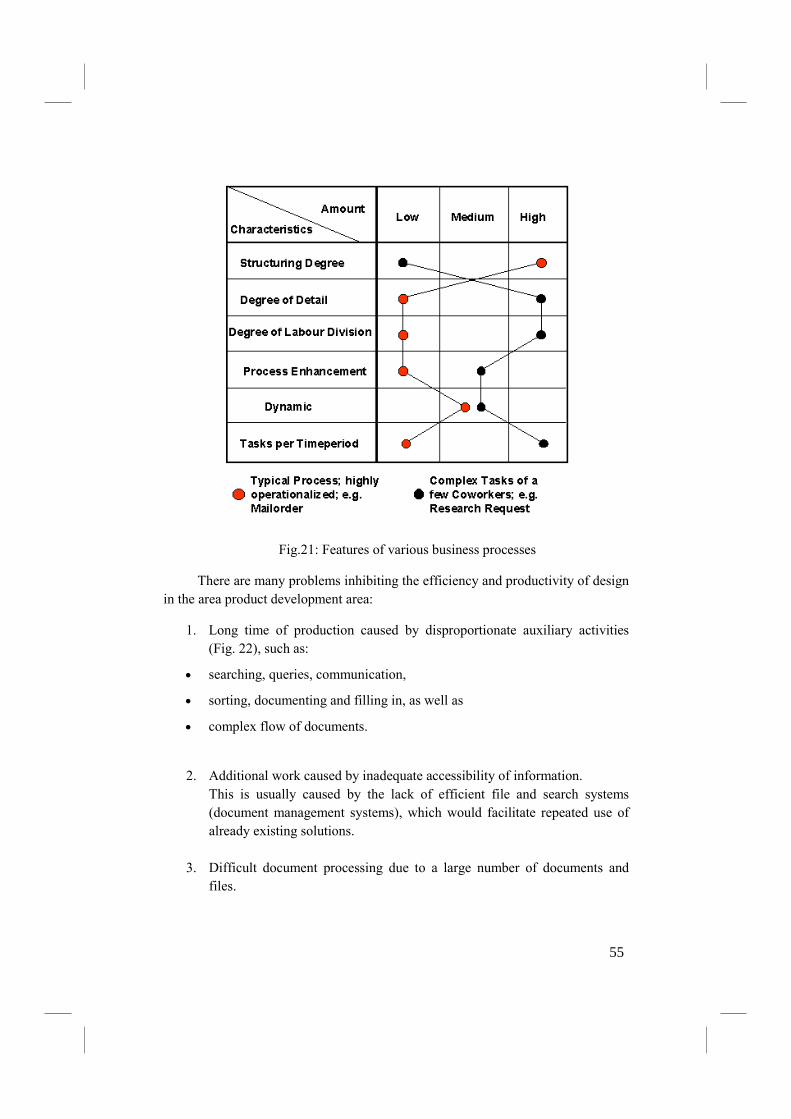
Fig.21: Features of various business processes
There are many problems inhibiting the efficiency and productivity of design
in the area product development area:
1. Long time of production caused by disproportionate auxiliary activities
(Fig. 22), such as:
• searching, queries, communication,
• sorting, documenting and filling in, as well as
• complex flow of documents.
2. Additional work caused by inadequate accessibility of information.
This is usually caused by the lack of efficient file and search systems
(document management systems), which would facilitate repeated use of
already existing solutions.
3. Difficult document processing due to a large number of documents and
files.
55
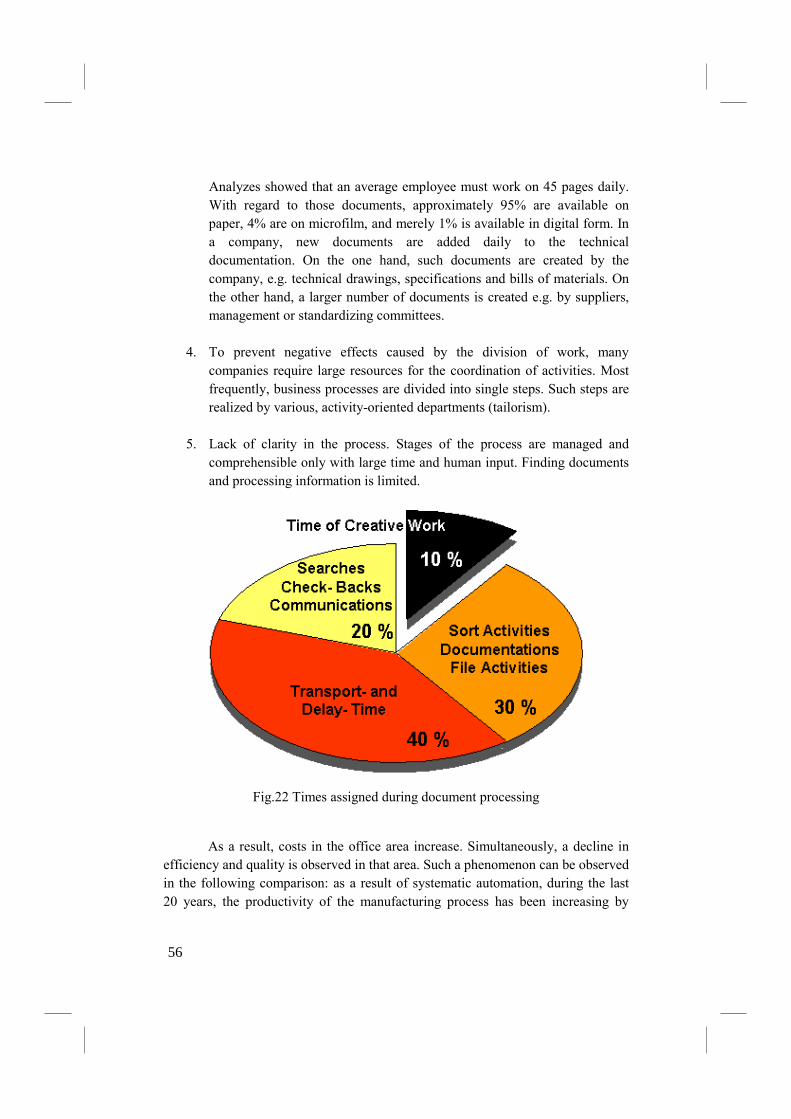
Analyzes showed that an average employee must work on 45 pages daily.
With regard to those documents, approximately 95% are available on
paper, 4% are on microfilm, and merely 1% is available in digital form. In
a company, new documents are added daily to the technical
documentation. On the one hand, such documents are created by the
company, e.g. technical drawings, specifications and bills of materials. On
the other hand, a larger number of documents is created e.g. by suppliers,
management or standardizing committees.
4. To prevent negative effects caused by the division of work, many
companies require large resources for the coordination of activities. Most
frequently, business processes are divided into single steps. Such steps are
realized by various, activity-oriented departments (tailorism).
5. Lack of clarity in the process. Stages of the process are managed and
comprehensible only with large time and human input. Finding documents
and processing information is limited.
Fig.22 Times assigned during document processing
As a result, costs in the office area increase. Simultaneously, a decline in
efficiency and quality is observed in that area. Such a phenomenon can be observed
in the following comparison: as a result of systematic automation, during the last
20 years, the productivity of the manufacturing process has been increasing by
56
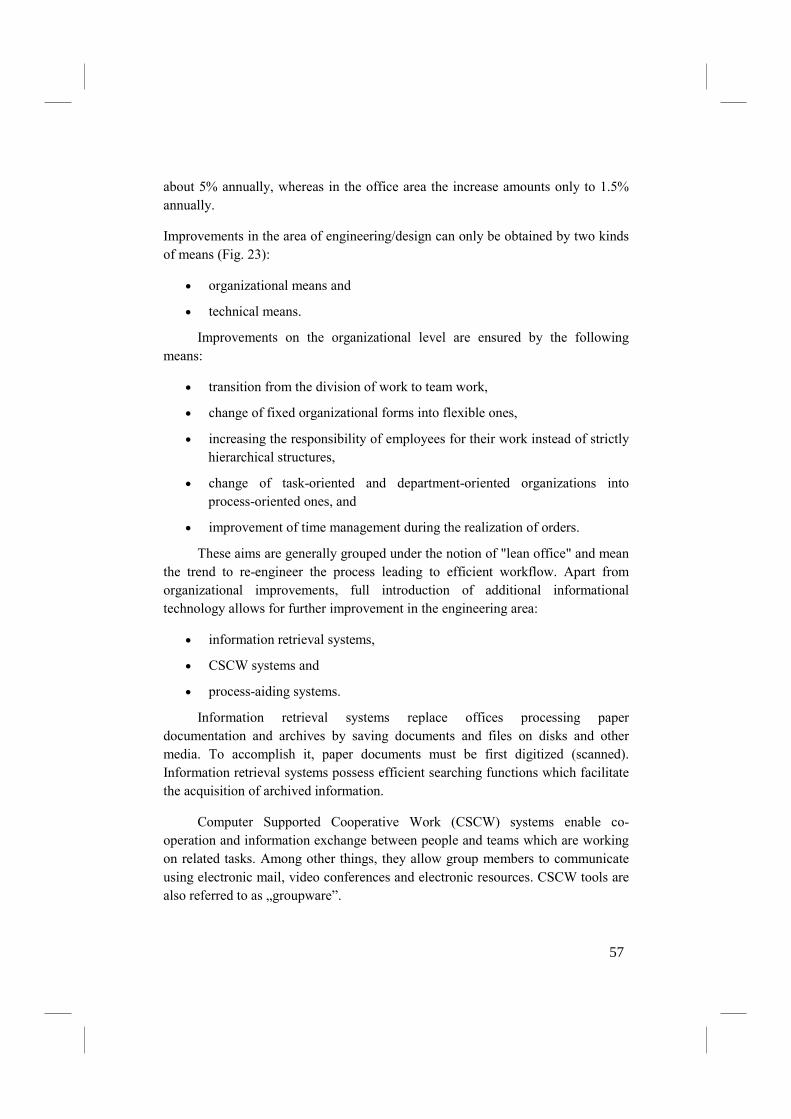
about 5% annually, whereas in the office area the increase amounts only to 1.5%
annually.
Improvements in the area of engineering/design can only be obtained by two kinds
of means (Fig. 23):
• organizational means and
• technical means.
Improvements on the organizational level are ensured by the following
means:
• transition from the division of work to team work,
• change of fixed organizational forms into flexible ones,
• increasing the responsibility of employees for their work instead of strictly
hierarchical structures,
• change of task-oriented and department-oriented organizations into
process-oriented ones, and
• improvement of time management during the realization of orders.
These aims are generally grouped under the notion of "lean office" and mean
the trend to re-engineer the process leading to efficient workflow. Apart from
organizational improvements, full introduction of additional informational
technology allows for further improvement in the engineering area:
• information retrieval systems,
• CSCW systems and
• process-aiding systems.
Information retrieval systems replace offices processing paper
documentation and archives by saving documents and files on disks and other
media. To accomplish it, paper documents must be first digitized (scanned).
Information retrieval systems possess efficient searching functions which facilitate
the acquisition of archived information.
Computer Supported Cooperative Work (CSCW) systems enable co-
operation and information exchange between people and teams which are working
on related tasks. Among other things, they allow group members to communicate
using electronic mail, video conferences and electronic resources. CSCW tools are
also referred to as „groupware”.
57
Process-aiding systems enable automatic workflow. They aid employees and
allow for the processing of tasks and documents in an integrated and complex way
("workflow automation").
Fig.23 Possibilities of improvement in engineering area
In PDM systems, workflow management module enables controlling the
flow of information and documents in a company. All the flows of information
and documents are defined on the the company level and later modeled within a
PDM system. The flow of work, information and documents can be based on the
flow models preceded by analysis of the company, its hitherto flows or standard
flows.
User's resources are not only used for storing documentation created with
them, but they also allow for transferring data between departments or people in
logical order. Most frequently, it occurs basing on the status of the document, e.g.:
notified, treated, checked, approved. If a document reaches approval status in one
group, it can be used by the next group in the queue. It happens, though, that
employees from other departments must be consulted and the document has not yet
been approved. In such a situation PDM systems make it possible to access the
documents without the right to modify them.
The workflow management module performs the following tasks:
• provides information about tasks that were, are and will be performed
and about data that were used in subsequent steps;
58
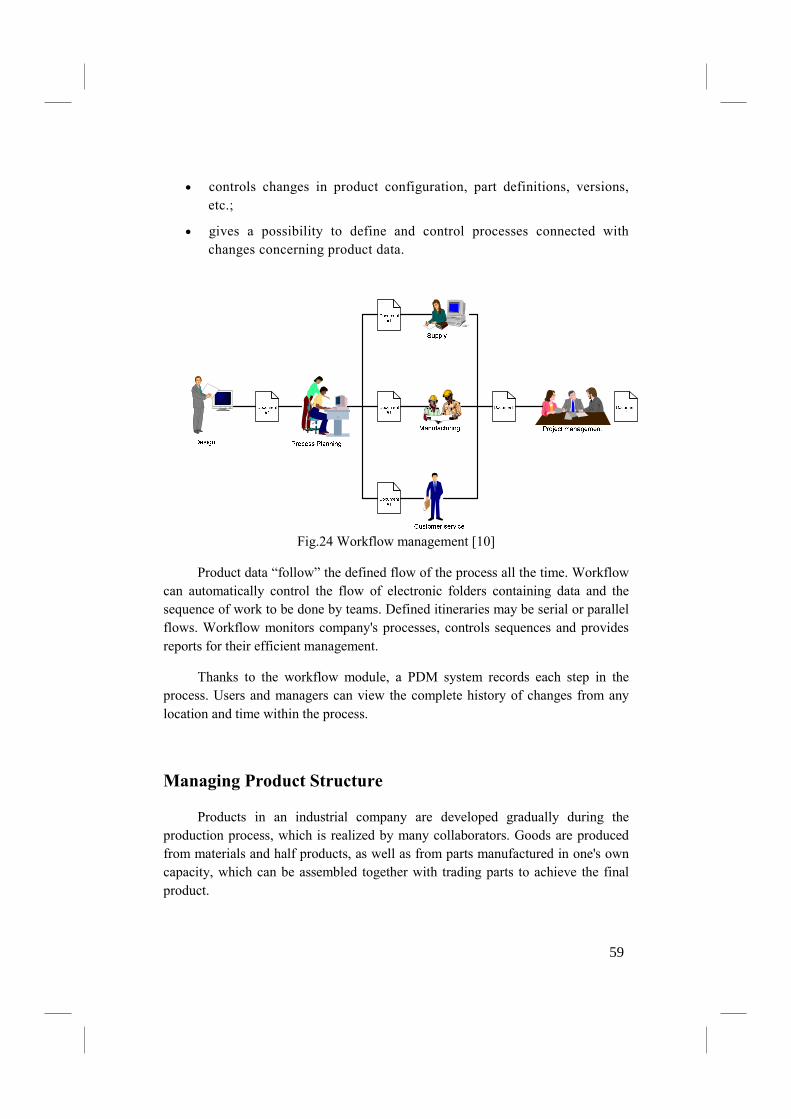
• controls changes in product configuration, part definitions, versions,
etc.;
• gives a possibility to define and control processes connected with
changes concerning product data.
Fig.24 Workflow management [10]
Product data “follow” the defined flow of the process all the time. Workflow
can automatically control the flow of electronic folders containing data and the
sequence of work to be done by teams. Defined itineraries may be serial or parallel
flows. Workflow monitors company's processes, controls sequences and provides
reports for their efficient management.
Thanks to the workflow module, a PDM system records each step in the
process. Users and managers can view the complete history of changes from any
location and time within the process.
Managing Product Structure
Products in an industrial company are developed gradually during the
production process, which is realized by many collaborators. Goods are produced
from materials and half products, as well as from parts manufactured in one's own
capacity, which can be assembled together with trading parts to achieve the final
product.
59
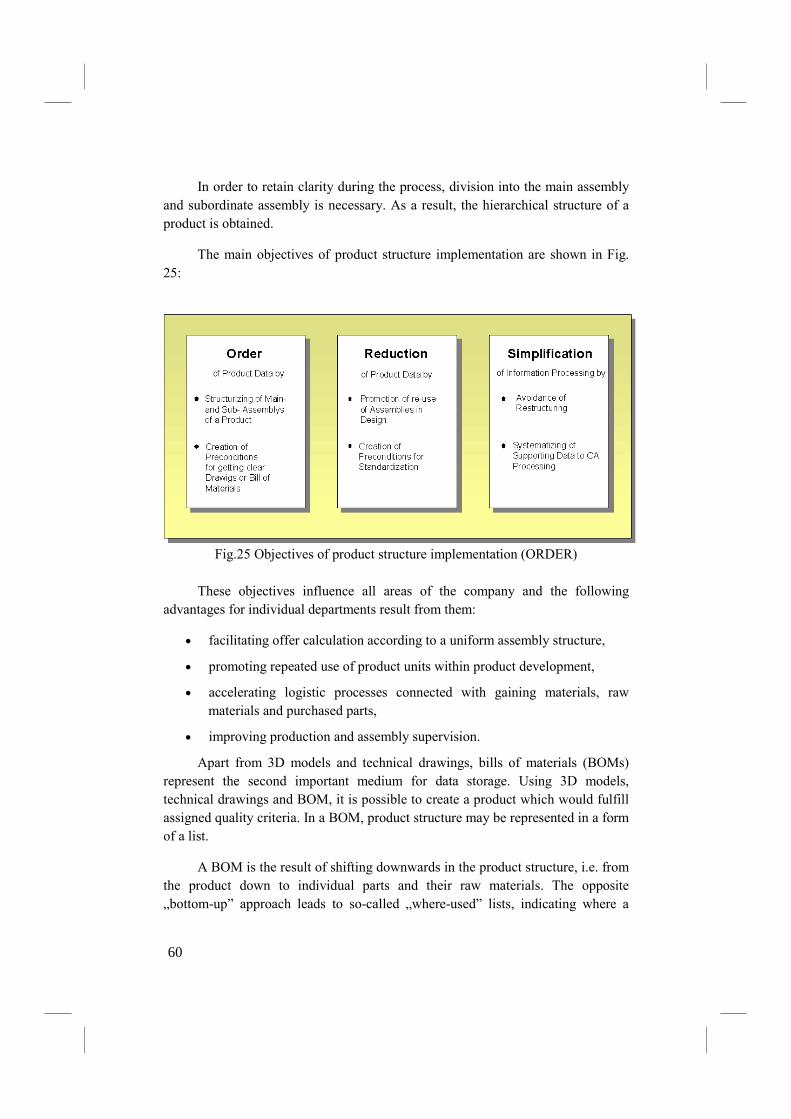
In order to retain clarity during the process, division into the main assembly
and subordinate assembly is necessary. As a result, the hierarchical structure of a
product is obtained.
The main objectives of product structure implementation are shown in Fig.
25:
Fig.25 Objectives of product structure implementation (ORDER)
These objectives influence all areas of the company and the following
advantages for individual departments result from them:
• facilitating offer calculation according to a uniform assembly structure,
• promoting repeated use of product units within product development,
• accelerating logistic processes connected with gaining materials, raw
materials and purchased parts,
• improving production and assembly supervision.
Apart from 3D models and technical drawings, bills of materials (BOMs)
represent the second important medium for data storage. Using 3D models,
technical drawings and BOM, it is possible to create a product which would fulfill
assigned quality criteria. In a BOM, product structure may be represented in a form
of a list.
A BOM is the result of shifting downwards in the product structure, i.e. from
the product down to individual parts and their raw materials. The opposite
„bottom-up” approach leads to so-called „where-used” lists, indicating where a
60
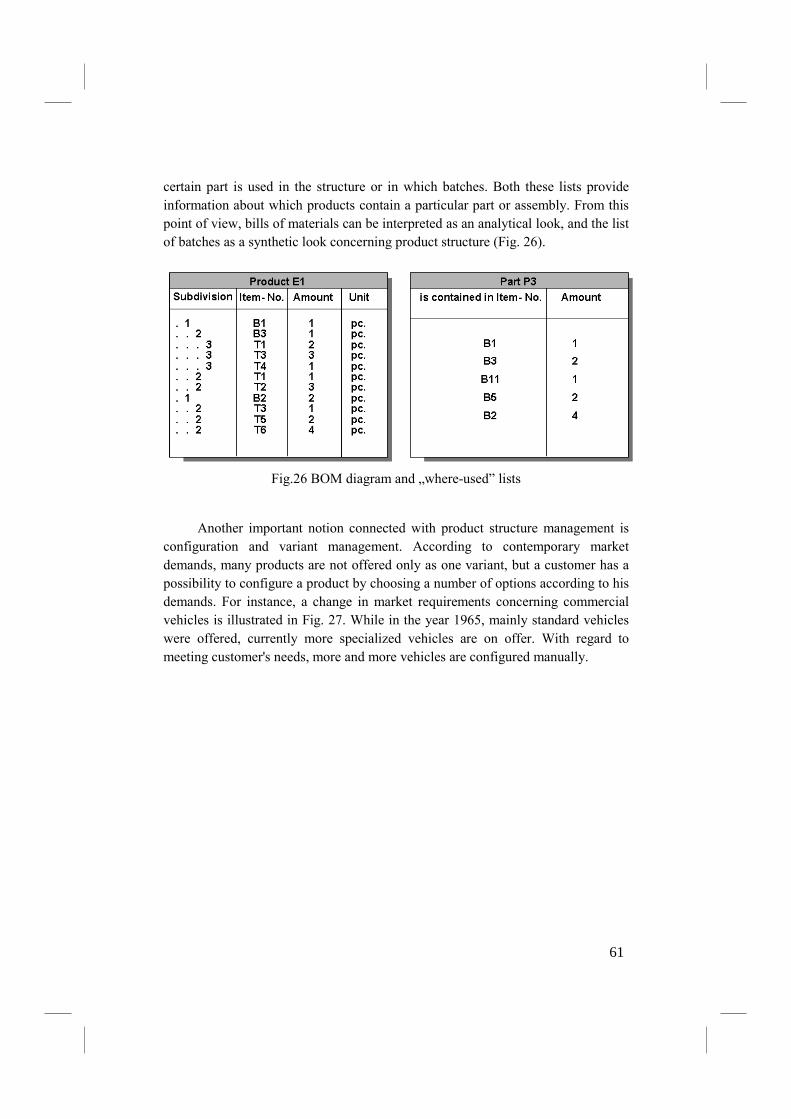
certain part is used in the structure or in which batches. Both these lists provide
information about which products contain a particular part or assembly. From this
point of view, bills of materials can be interpreted as an analytical look, and the list
of batches as a synthetic look concerning product structure (Fig. 26).
Fig.26 BOM diagram and „where-used” lists
Another important notion connected with product structure management is
configuration and variant management. According to contemporary market
demands, many products are not offered only as one variant, but a customer has a
possibility to configure a product by choosing a number of options according to his
demands. For instance, a change in market requirements concerning commercial
vehicles is illustrated in Fig. 27. While in the year 1965, mainly standard vehicles
were offered, currently more specialized vehicles are on offer. With regard to
meeting customer's needs, more and more vehicles are configured manually.
61
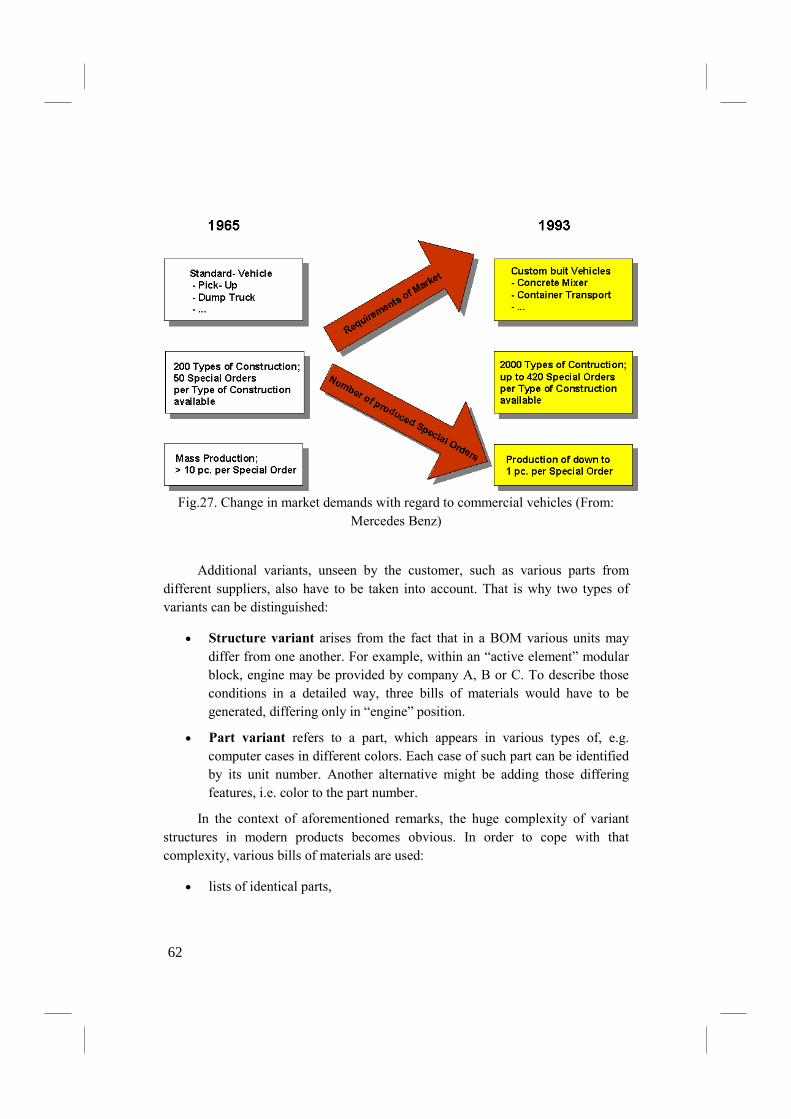
Fig.27. Change in market demands with regard to commercial vehicles (From:
Mercedes Benz)
Additional variants, unseen by the customer, such as various parts from
different suppliers, also have to be taken into account. That is why two types of
variants can be distinguished:
• Structure variant arises from the fact that in a BOM various units may
differ from one another. For example, within an “active element” modular
block, engine may be provided by company A, B or C. To describe those
conditions in a detailed way, three bills of materials would have to be
generated, differing only in “engine” position.
• Part variant refers to a part, which appears in various types of, e.g.
computer cases in different colors. Each case of such part can be identified
by its unit number. Another alternative might be adding those differing
features, i.e. color to the part number.
In the context of aforementioned remarks, the huge complexity of variant
structures in modern products becomes obvious. In order to cope with that
complexity, various bills of materials are used:
• lists of identical parts,
62
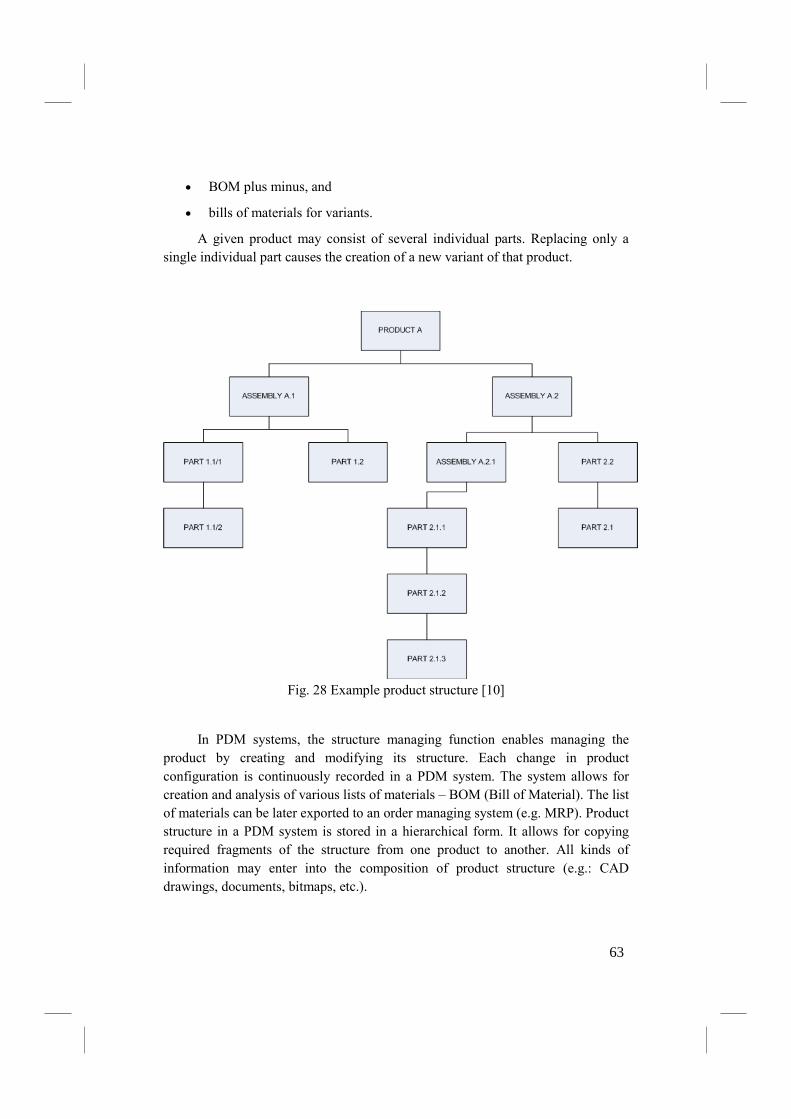
• BOM plus minus, and
• bills of materials for variants.
A given product may consist of several individual parts. Replacing only a
single individual part causes the creation of a new variant of that product.
Fig. 28 Example product structure [10]
In PDM systems, the structure managing function enables managing the
product by creating and modifying its structure. Each change in product
configuration is continuously recorded in a PDM system. The system allows for
creation and analysis of various lists of materials – BOM (Bill of Material). The list
of materials can be later exported to an order managing system (e.g. MRP). Product
structure in a PDM system is stored in a hierarchical form. It allows for copying
required fragments of the structure from one product to another. All kinds of
information may enter into the composition of product structure (e.g.: CAD
drawings, documents, bitmaps, etc.).
63
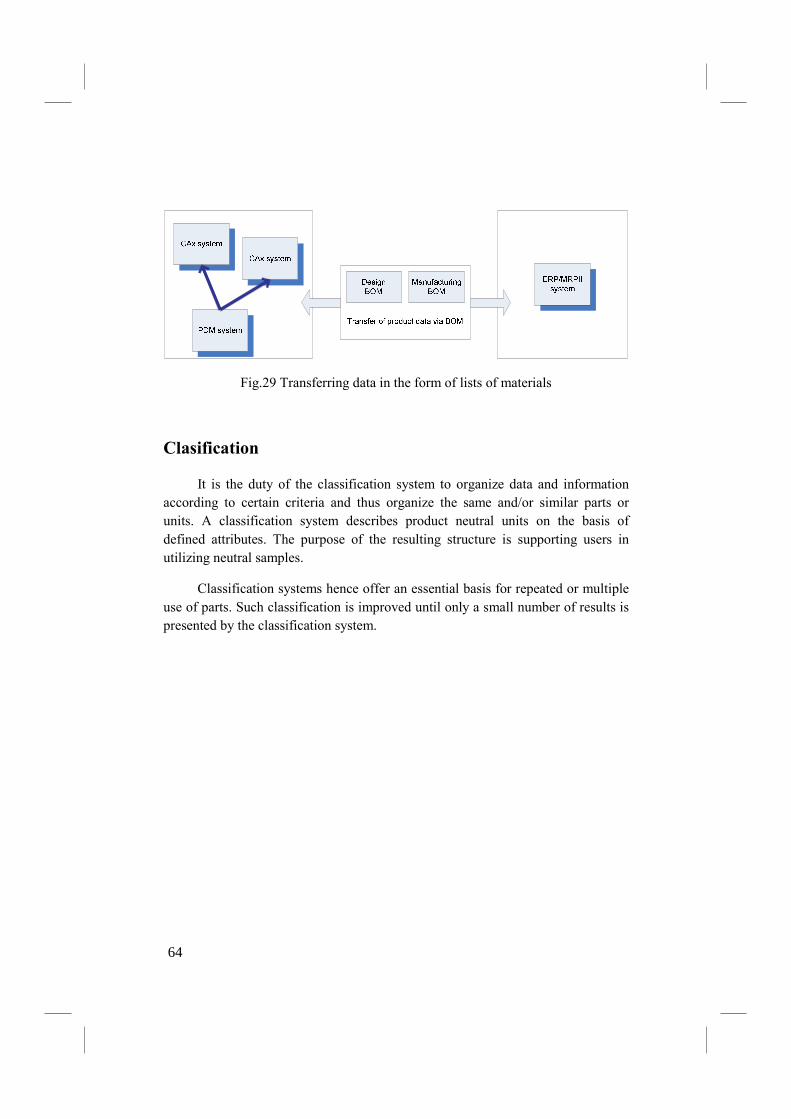
Fig.29 Transferring data in the form of lists of materials
Clasification
It is the duty of the classification system to organize data and information
according to certain criteria and thus organize the same and/or similar parts or
units. A classification system describes product neutral units on the basis of
defined attributes. The purpose of the resulting structure is supporting users in
utilizing neutral samples.
Classification systems hence offer an essential basis for repeated or multiple
use of parts. Such classification is improved until only a small number of results is
presented by the classification system.
64
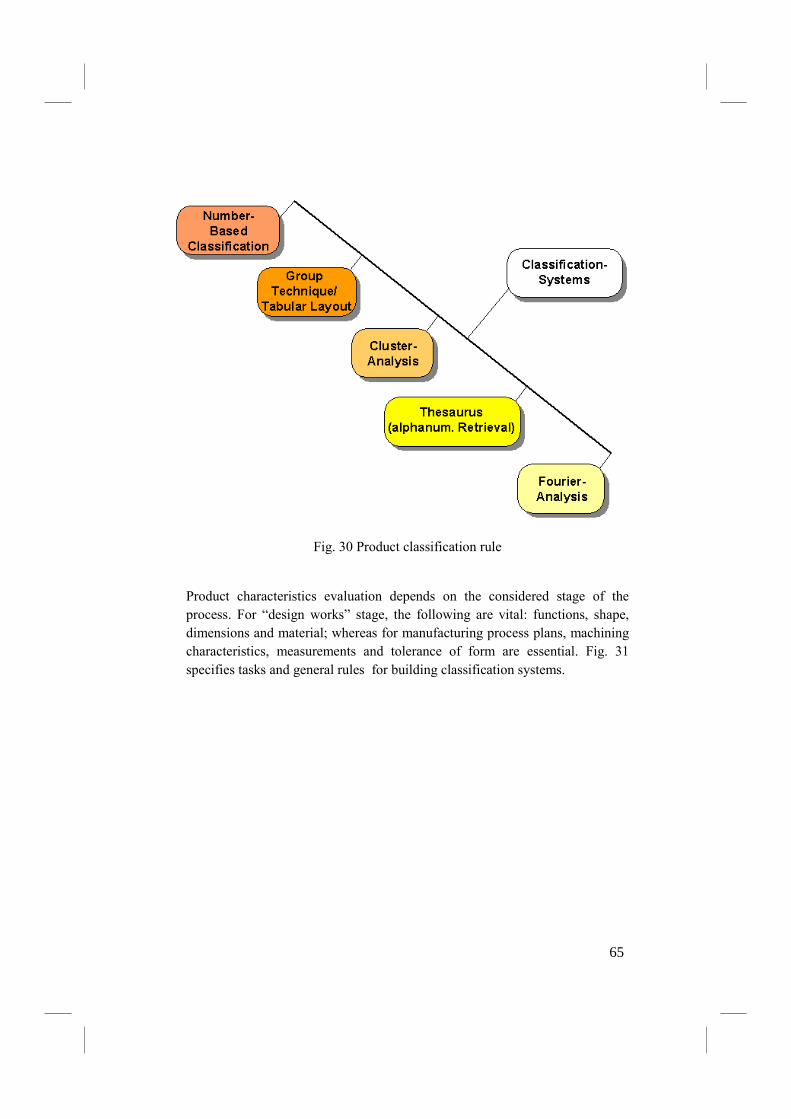
Fig. 30 Product classification rule
Product characteristics evaluation depends on the considered stage of the
process. For “design works” stage, the following are vital: functions, shape,
dimensions and material; whereas for manufacturing process plans, machining
characteristics, measurements and tolerance of form are essential. Fig. 31
specifies tasks and general rules for building classification systems.
65
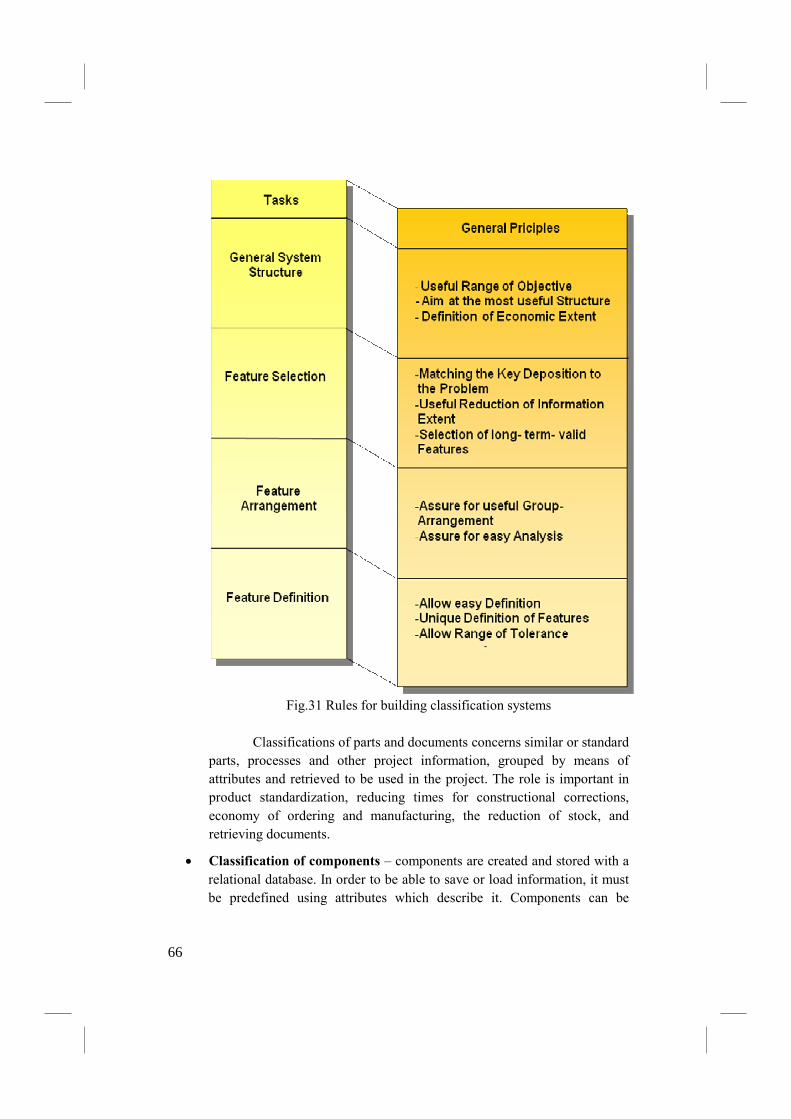
Fig.31 Rules for building classification systems
Classifications of parts and documents concerns similar or standard
parts, processes and other project information, grouped by means of
attributes and retrieved to be used in the project. The role is important in
product standardization, reducing times for constructional corrections,
economy of ordering and manufacturing, the reduction of stock, and
retrieving documents.
• Classification of components – components are created and stored with a
relational database. In order to be able to save or load information, it must
be predefined using attributes which describe it. Components can be
66
grouped so as to facilitate access to them and suit company's needs
[13];The following classification attributes can occur: shape, material,
numbers of drawings and other features allowing for the classification of
elements. It enables the user for an easier retrieval of product data which
are identical or similar to the required data.
• Classification of documents – documents can be classified according to
the character of their use, e.g.: drawings, 3D models, FEA files. Each of
these groups can have different attributes: part, number, author, date. PDM
systems can also save relations occurring between documents. The
majority of systems enables to define groups only once, during
implementation. Newer systems allow their users for defining the structure
of the documentation at any moment, adjusting it to organizational
changes;
Functions of PDM classification provide an effective mechanisms for
retrieving standard and similar parts in catalogs and databases belonging to
other systems.
67
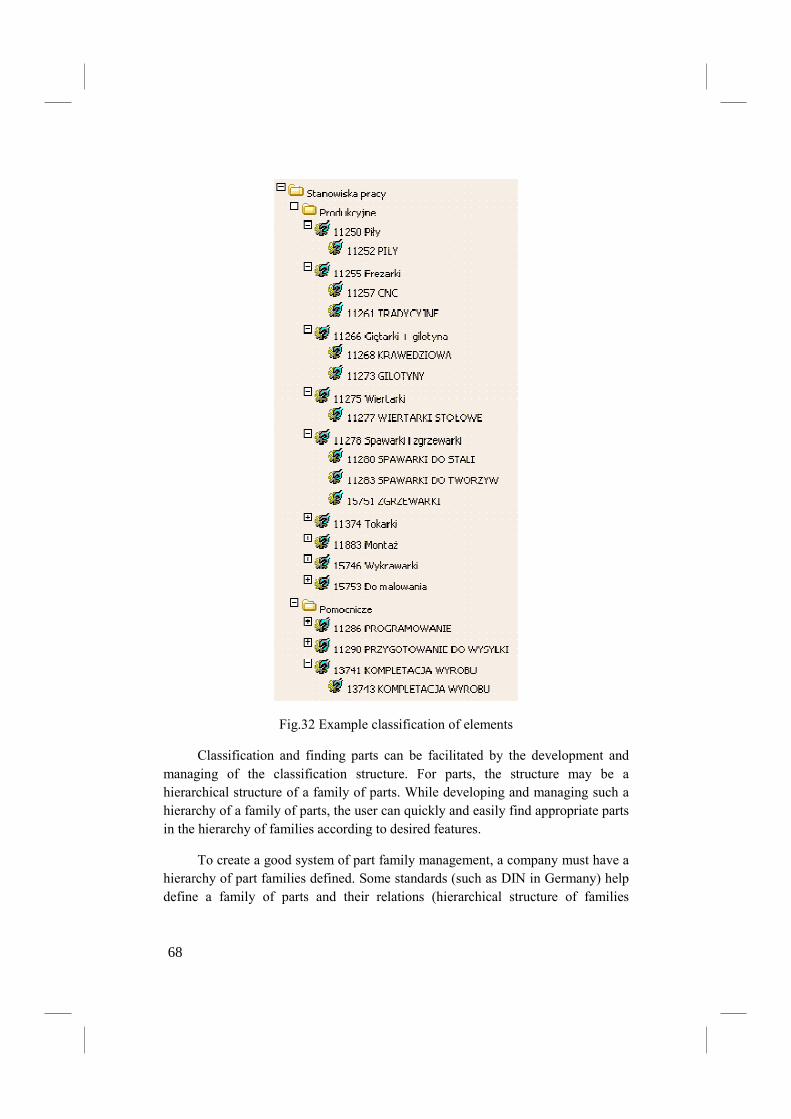
Fig.32 Example classification of elements
Classification and finding parts can be facilitated by the development and
managing of the classification structure. For parts, the structure may be a
hierarchical structure of a family of parts. While developing and managing such a
hierarchy of a family of parts, the user can quickly and easily find appropriate parts
in the hierarchy of families according to desired features.
To create a good system of part family management, a company must have a
hierarchy of part families defined. Some standards (such as DIN in Germany) help
define a family of parts and their relations (hierarchical structure of families
68
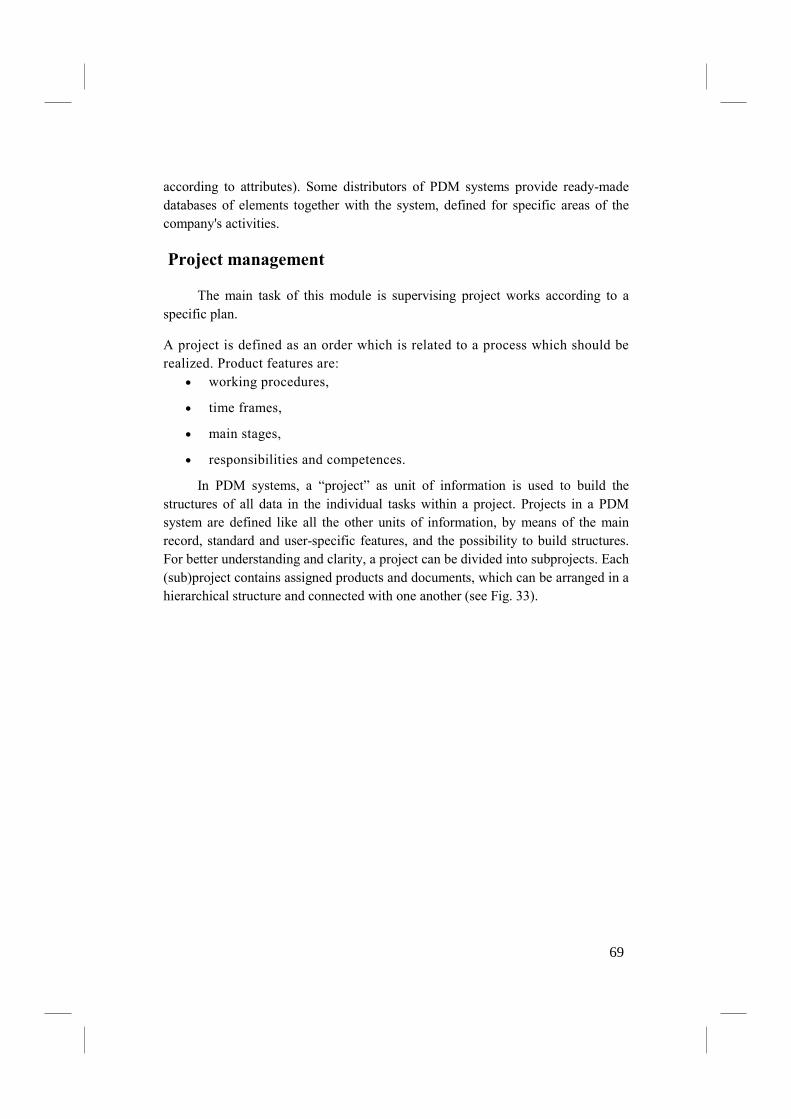
according to attributes). Some distributors of PDM systems provide ready-made
databases of elements together with the system, defined for specific areas of the
company's activities.
Project management
The main task of this module is supervising project works according to a
specific plan.
A project is defined as an order which is related to a process which should be
realized. Product features are:
• working procedures,
• time frames,
• main stages,
• responsibilities and competences.
In PDM systems, a “project” as unit of information is used to build the
structures of all data in the individual tasks within a project. Projects in a PDM
system are defined like all the other units of information, by means of the main
record, standard and user-specific features, and the possibility to build structures.
For better understanding and clarity, a project can be divided into subprojects. Each
(sub)project contains assigned products and documents, which can be arranged in a
hierarchical structure and connected with one another (see Fig. 33).
69
Fig.33 Multidimensional structures between projects – product and documents
A PDM system allows for programming any cycle of information connected
with a given project. While making the project, the system creates the history of the
course of the project. Monitoring the progress of work enables the manager for
continuous supervision of the undertaking. Each stage of the project must be
approved or the system will not allow the next stage to begin. In the system, serial
and parallel flows can be defined, hence it is possible to conduct work in a way this
is compliant with the Concurrent Engineering.
Change management
Engineering Change Management 14 is one of the most vexing issues within
most organizations. While “best” practices would have us freeze the design early in
the development cycle, the reality is that most organizations don’t have the luxury
of doing this. If the change requirements come from the customers, then they have
little or no choice but to make the changes. However, even if that is not the case,
there generally is additional information gained while the product is being designed
that requires changes to be made. Assumptions about the resulting functionality of
a specific design feature are proven to be flawed or suboptimal. Therefore, most
70
organizations have to have a change management system in place in order to
implement the changes within their design organization correctly and efficiently.
However, this is not simply an issue for engineering. As engineering changes
occur, there are implications for purchasing, manufacturing and service areas as the
functionality and specifications of the product change. As these changes occur later
into the release cycle of the product, the importance to these other functions of
understanding the changes that are occurring increases dramatically.
The issue with a number of organizations, even when they have excellent
change management within engineering, is that the information about these
changes is not conveyed to the other functional areas in a comprehensive or timely
fashion. In a number of organizations, this information is batched up and conveyed
only AT specific intervals, meaning that valuable time is lost in other functional
areas, such as purchasing, manufacturing, or service, to reach to or even have
visibility of the changes that are occurring.
The Product Lifecycle Management approach that ties all of these functional
areas into a common repository of information is required in order to process
engineering change requests efficiently and effectively. Especially for those
organizations where changes occur later into the development cycle, the
requirement that they have visibility as quickly as these change requirements are
known is of paramount importance. This is so as not to waste time, energy, or
material on working on older versions that will need to be redone.
CAD Integration
PLM operate very widely with all kinds of applications, of which CAD is but one.
CAD systems can be 2D or, increasingly, 3D design software. There are many
specialized CAD applications, for example for mechanical planning, electrical
engineering, electronics design, hydraulics planning, pipe planning and
shipbuilding. However, the division of labor between CAD and PLM systems is
clear: information that has been produced by a CAD system is controlled by a PLM
system. The PLM does not contain any features related to the actual modeling and
engineering work.
At its simplest, a PLM system can serve as a file vault for documentation produced
by a CAD system. There might not be strong integration between CAD and PLM,
and the created documentation might be imported manually into the PLM, with the
designer moving drawings into the PLM system one by one.
From the designer’s point of view, a somewhat easier approach is to have the CAD
system connected to PLM so that the created documentation is saved directly into
PLM without any intermediate stages. In practice, the engineers are constantly
71
connected to PLM. The PLM user interface can be integrated into the CAD user
interface.
Integration is not restricted to drawings; it can cover all other created information
including:
• Individual 3D –models
• Structures of models: Assemblies and subassemblies
• Items
• Item structures
• Drawings: workshop drawings, assembly drawings, exploded drawings etc.
Strong integration allows product data produced with a CAD system to be
controlled by the PLM system. In such cases, the PLM user interface is usually
integrated directly into the user interface of the CAD system. The designer need
not operate the PLM user interface at all. All information is handled directly
through the CAD user interface, which is connected to the PLM databases. For
example, when an engineer creates part lists or fills up information in document
sheet info fields, all the information can be taken directly from the PLM item
database.
A company might use many different CAD systems, but these can all be integrated
with the same PLM system. This makes actual concurrent engineering possible.
Several persons, or geographically different organizations, can work with the same
CAD assemblage and they can all see the others’ engineering data. At the same
time, the PLM system ensures that only one person at a time can edit a particular
file.
ERP Integration
Traditionally, PLM systems have been used in the product development process,
just as ERP systems have been used in the production process. PLM is the system
for product data producers; ERP in turn is a system for product data consumers.
The PLM system manages product items and item structures, but seldom the stock
levels for warehouse items. This information is controlled with the help of ERP
systems but the basic information on items may be read into ERP from the PLM
system.
ERP systems have largely developed from earlier MRP (Material Requirements
Planning) systems, which were used for calculating material needs for production.
Modern ERP systems are often module based; different modules have different
user interfaces and different user groups. For example, the following modules can
be used:
72
• Manufacturing module
• Procurement module
• Logistics module
• Financial module
• Maintenance module
• Sales module
Different modules manage different operative functions within their particular
fields, covering all kinds of issues needed in the daily control of the business:
customer data, purchases, backlog of orders, warehouse items, bill of materials,
delivered products, billing, procurement control data, subcontracting data, and so
on. However, much of the necessary basic information, and the updating of that
information, may be located in the databases of a PLM system.
In practice, the ERP system must often be integrated with a PLM system.
Depending on the databases and the needs of the company, the link can be by
transfer file, database or middleware integration.
Workers’ assignments define how their daily work is divided between different
systems. Organizations that work largely with purchase transactions, orders,
inventories, deliveries and similar operations will probably work more with ERP
systems. These include, for example, production, purchase and maintenance.
For those involved in producing product information, such as product development
and marketing, the system is more likely to be PLM. However, integration of these
systems provides all organizations with access to product data as well as operative
business data.
System Functions
Communication and �otifications
This function aims at informing the system user about the state of processes
taking place in the system. The tasks of this the function are, among others,
informing users about the state of design work (e.g.: transferring information about
documents waiting for constructor's approval). The function also works as
electronic mail, through which communication of the system users occurs. The
main tasks of the module is to minimize time losses arising from sending messages,
documents and data among system users.
Data Transport
All data are saved and available in a PDM system. The system records data
in its database, and when data are retrieved from a different location, the system
73
creates links to such data. In reality, a user does not have to know the operating
system commands, file locations and directories to find a particular document or
data for the system allows them to be found easily by means of a built-in viewer.
The main premise of the module is isolating the user from the system.
Data Translation
Data translators, used for changing data formats depending on the systems
between which they are interchanged, are integrated within PDM systems. It is a
useful function as it relieves the user from the knowledge of the complicated
structures of input and output data for individual systems. Currently, PDM systems
contain fully professional translators capable of loading and saving the majority of
data formats without introducing errors into the translation.
System Administration
Administrator sets up system operational parameters and monitors their
settings. He is obliged to:
• assign and change users' statuses;
• archiving data;
• control of system performance
PLM system structure
The model of a complete PLM solution, proposed by CIMdata looks as
follows:
74
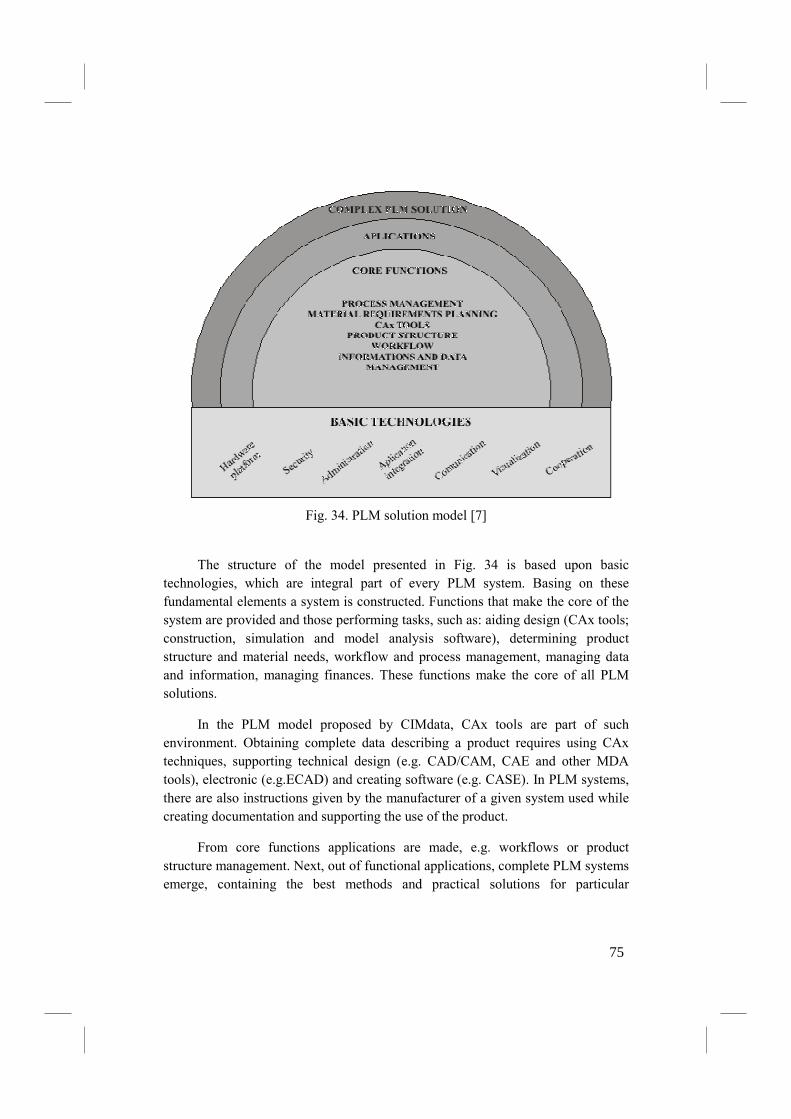
Fig. 34. PLM solution model [7]
The structure of the model presented in Fig. 34 is based upon basic
technologies, which are integral part of every PLM system. Basing on these
fundamental elements a system is constructed. Functions that make the core of the
system are provided and those performing tasks, such as: aiding design (CAx tools;
construction, simulation and model analysis software), determining product
structure and material needs, workflow and process management, managing data
and information, managing finances. These functions make the core of all PLM
solutions.
In the PLM model proposed by CIMdata, CAx tools are part of such
environment. Obtaining complete data describing a product requires using CAx
techniques, supporting technical design (e.g. CAD/CAM, CAE and other MDA
tools), electronic (e.g.ECAD) and creating software (e.g. CASE). In PLM systems,
there are also instructions given by the manufacturer of a given system used while
creating documentation and supporting the use of the product.
From core functions applications are made, e.g. workflows or product
structure management. Next, out of functional applications, complete PLM systems
emerge, containing the best methods and practical solutions for particular
75
companies. Such systems can be freely combined and modified for the needs of
various sectors of the industry or other users.
According to the definition by CIMdata, a PLM system should feature (it is
not a required standard):
1. Management:
• Data and information about the product
• Project chain
• Documents (all storage media, types and formats)
• Requirements (e.g. functions, aims, quality, costs, time, etc.)
• Classification of products and projects and families of products
• Infrastructure (e.g. machines, buildings, production lines)
• Service
2. Project and process management
3. Visualization
4. Control of supplies
5. Digital production control
6. Aided design (CAx tools)
7. Product testing
8. Using manufacturer's instructions, e.g.:
• Service manual
• User's manual
• Instructions for implementation
The structure of PLM systems mostly depends on user's requirements, e.g. in
a large number of industrial sectors, servicing capabilities are one of the most
important elements. In airplane industry, servicing is offered for 30 years, and a
manufacturer of drilling platforms has to ensure their efficient functioning for
twice as long.
The co-operation on the development of the product is gaining a constantly larger
value (managing project chain), which is currently at least as important as logistic
and production chains. Partners within project chains have to be able to share and
use resources and knowledge quickly and efficiently, and make decisions about
where to use them. The integration of desing processes largely increases the
efficiency of actions of all units co-working on the product development.
76
Position of PLM systems
Although PLM concerns many areas, it must be defined what is not included
in the scope of its possibilities – these are, among other things, solutions which are
very important for companies, such as: CRM, ERP and managing logistic chains.
PLM does not include systems facilitating other essential functions either, e.g.
marketing and sales, distribution, managing human resources, finances.
Application fulfilling such tasks can, however, co-operate with individual PLM
modules.
It is just like CRM whose traditional functions, focusing on managing
ordering and sales processes, are not part of PLM. Both those systems deal with
gathering information about customers' requirements, this is why, to a large extent,
they are integrated with one another. The range of integration means:
• Supplying information describing a product with regard to sales and
servicing, e.g. variants of products, ordering costs, etc.
• Introducing product data directly to the offer
• Acquiring information about new requirements, ideas for improvement and
errors which should be eliminated
• Tracking customers' requirements throughout the whole product lifecycle
• Analysis and assessment of the possibilities of individual sectors on the
market
• Conducting an advertising campaign simultaneously with product
development so as to shorten the time of launching
With ERP systems, whose main task is production, the situation is similar.
Therefore, during the last few years, work on data exchange has grown, e.g. with
SCM, CRM and currently PLM. One of the ways of development is providing new
systems with the combined potential of ERP and PLM.
The diagram below presents relations between described solutions for companies.
Central part belongs to the product lifecycle, which is defined by systems that co-
operate and integrate with one another.
77
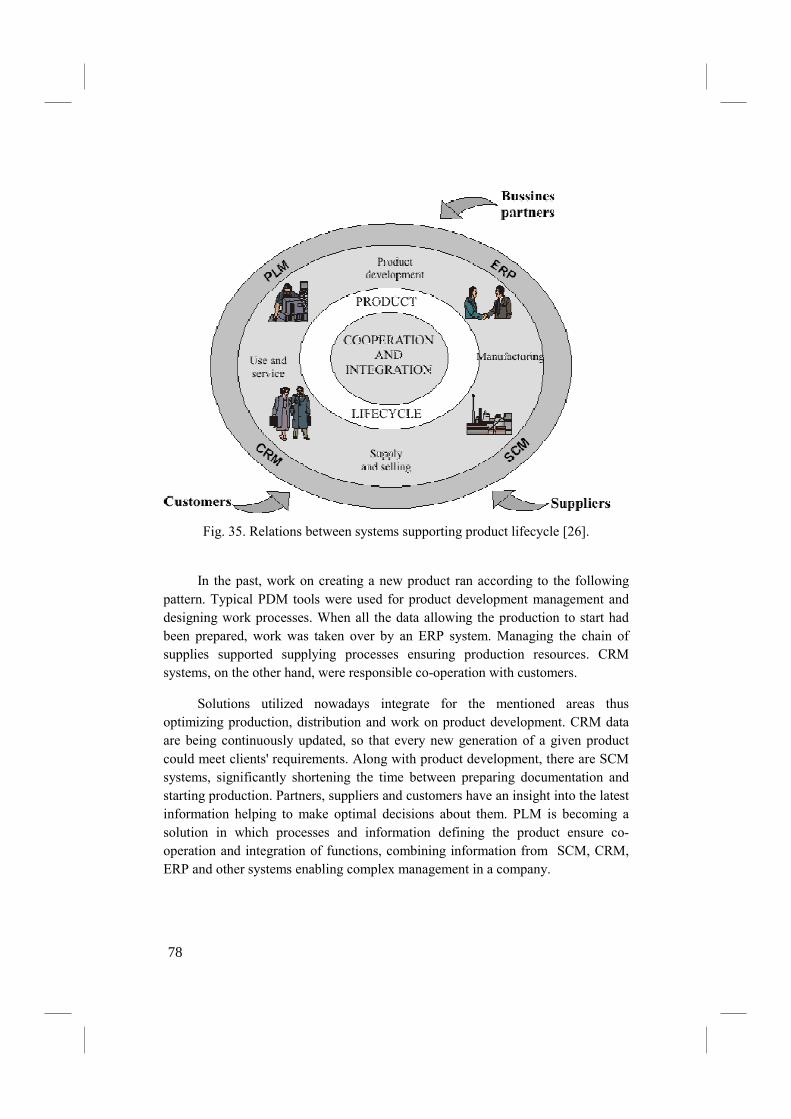
Fig. 35. Relations between systems supporting product lifecycle [26].
In the past, work on creating a new product ran according to the following
pattern. Typical PDM tools were used for product development management and
designing work processes. When all the data allowing the production to start had
been prepared, work was taken over by an ERP system. Managing the chain of
supplies supported supplying processes ensuring production resources. CRM
systems, on the other hand, were responsible co-operation with customers.
Solutions utilized nowadays integrate for the mentioned areas thus
optimizing production, distribution and work on product development. CRM data
are being continuously updated, so that every new generation of a given product
could meet clients' requirements. Along with product development, there are SCM
systems, significantly shortening the time between preparing documentation and
starting production. Partners, suppliers and customers have an insight into the latest
information helping to make optimal decisions about them. PLM is becoming a
solution in which processes and information defining the product ensure co-
operation and integration of functions, combining information from SCM, CRM,
ERP and other systems enabling complex management in a company.
78
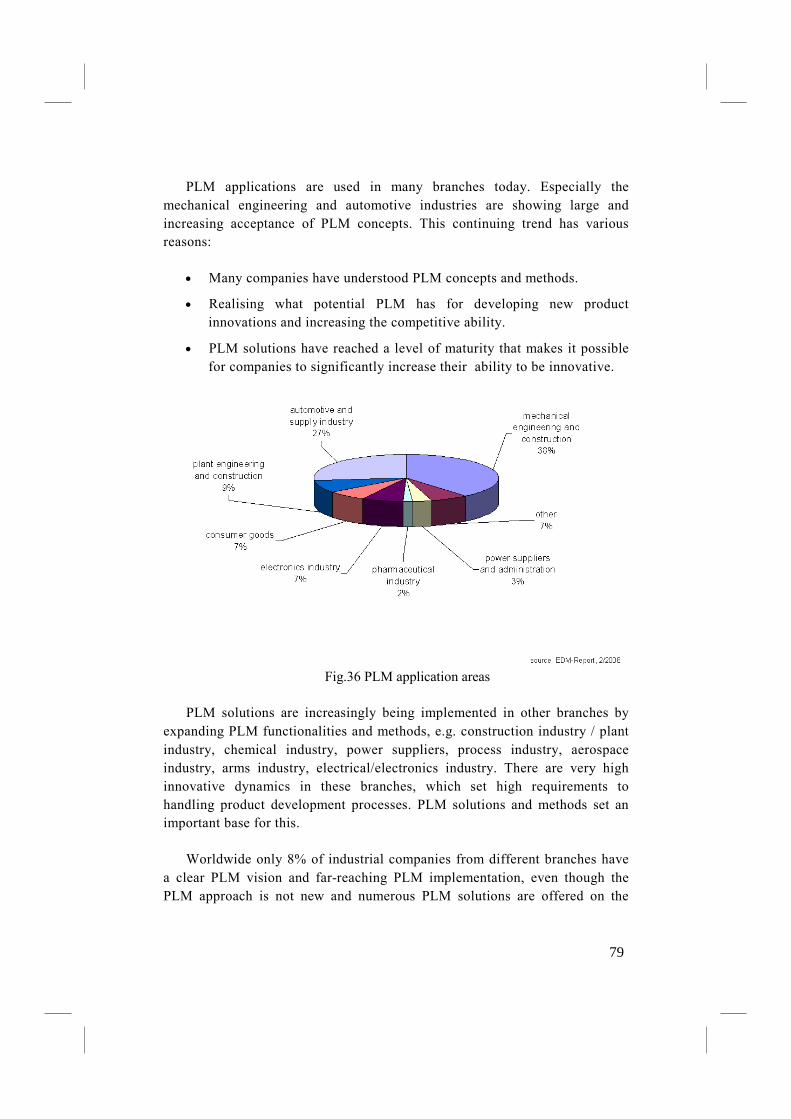
PLM applications are used in many branches today. Especially the
mechanical engineering and automotive industries are showing large and
increasing acceptance of PLM concepts. This continuing trend has various
reasons:
• Many companies have understood PLM concepts and methods.
• Realising what potential PLM has for developing new product
innovations and increasing the competitive ability.
• PLM solutions have reached a level of maturity that makes it possible
for companies to significantly increase their ability to be innovative.
Fig.36 PLM application areas
PLM solutions are increasingly being implemented in other branches by
expanding PLM functionalities and methods, e.g. construction industry / plant
industry, chemical industry, power suppliers, process industry, aerospace
industry, arms industry, electrical/electronics industry. There are very high
innovative dynamics in these branches, which set high requirements to
handling product development processes. PLM solutions and methods set an
important base for this.
Worldwide only 8% of industrial companies from different branches have
a clear PLM vision and far-reaching PLM implementation, even though the
PLM approach is not new and numerous PLM solutions are offered on the
79
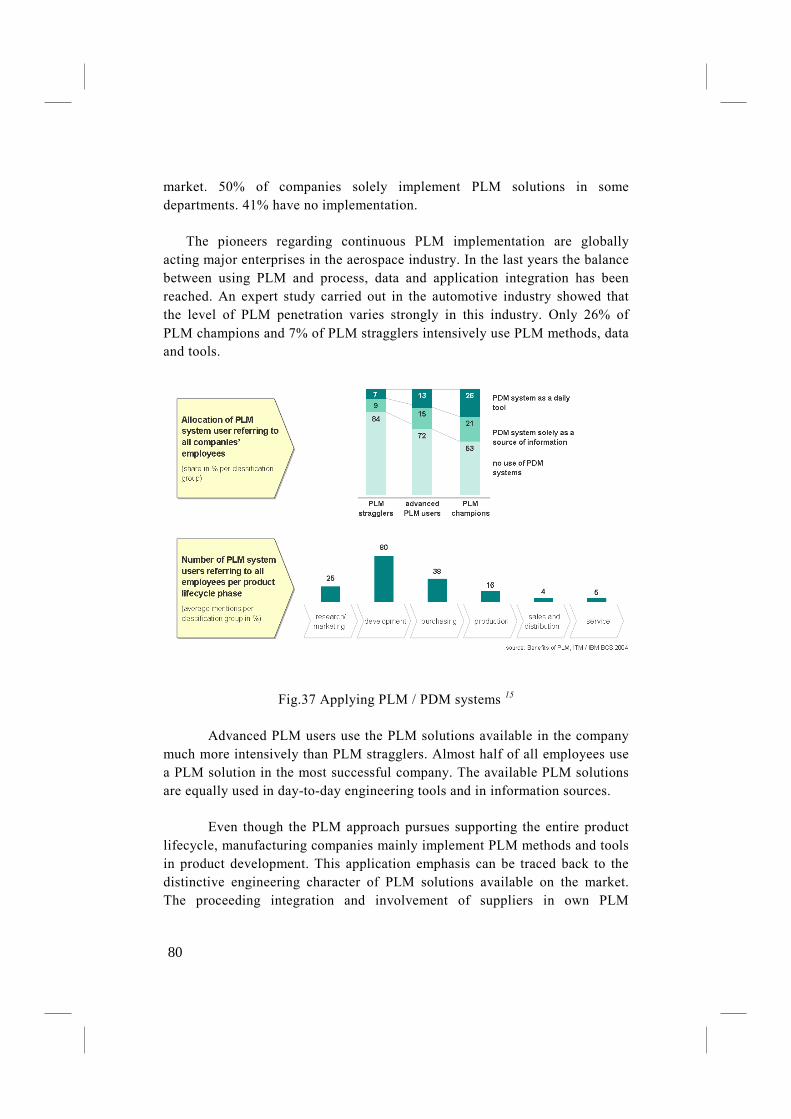
market. 50% of companies solely implement PLM solutions in some
departments. 41% have no implementation.
The pioneers regarding continuous PLM implementation are globally
acting major enterprises in the aerospace industry. In the last years the balance
between using PLM and process, data and application integration has been
reached. An expert study carried out in the automotive industry showed that
the level of PLM penetration varies strongly in this industry. Only 26% of
PLM champions and 7% of PLM stragglers intensively use PLM methods, data
and tools.
Fig.37 Applying PLM / PDM systems 15
Advanced PLM users use the PLM solutions available in the company
much more intensively than PLM stragglers. Almost half of all employees use
a PLM solution in the most successful company. The available PLM solutions
are equally used in day-to-day engineering tools and in information sources.
Even though the PLM approach pursues supporting the entire product
lifecycle, manufacturing companies mainly implement PLM methods and tools
in product development. This application emphasis can be traced back to the
distinctive engineering character of PLM solutions available on the market.
The proceeding integration and involvement of suppliers in own PLM
80

solutions has lead to PLM use in purchasing. Advanced PLM users
preferentially use PLM solutions as close-to-engineering integration solutions,
whilst PLM stragglers concentrate on company-wide document management.
81
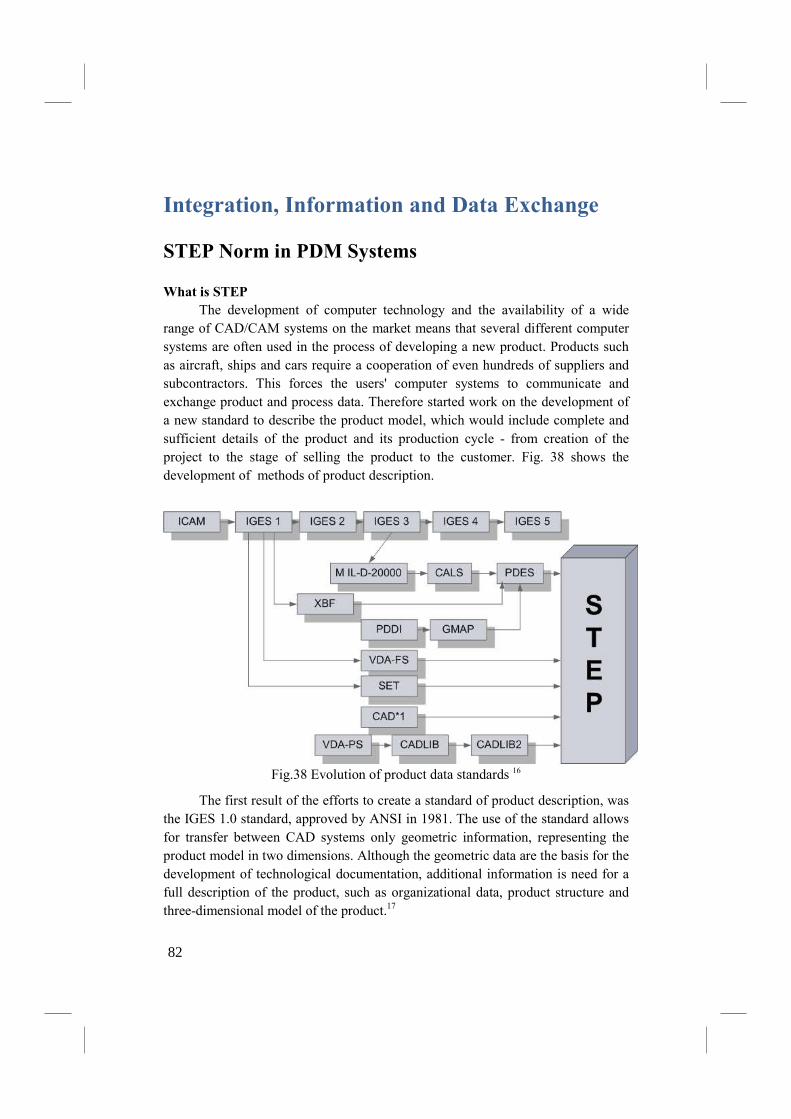
Integration, Information and Data Exchange
STEP �orm in PDM Systems
What is STEP
The development of computer technology and the availability of a wide
range of CAD/CAM systems on the market means that several different computer
systems are often used in the process of developing a new product. Products such
as aircraft, ships and cars require a cooperation of even hundreds of suppliers and
subcontractors. This forces the users' computer systems to communicate and
exchange product and process data. Therefore started work on the development of
a new standard to describe the product model, which would include complete and
sufficient details of the product and its production cycle - from creation of the
project to the stage of selling the product to the customer. Fig. 38 shows the
development of methods of product description.
Fig.38 Evolution of product data standards 16
The first result of the efforts to create a standard of product description, was
the IGES 1.0 standard, approved by ANSI in 1981. The use of the standard allows
for transfer between CAD systems only geometric information, representing the
product model in two dimensions. Although the geometric data are the basis for the
development of technological documentation, additional information is need for a
full description of the product, such as organizational data, product structure and
three-dimensional model of the product.17
82
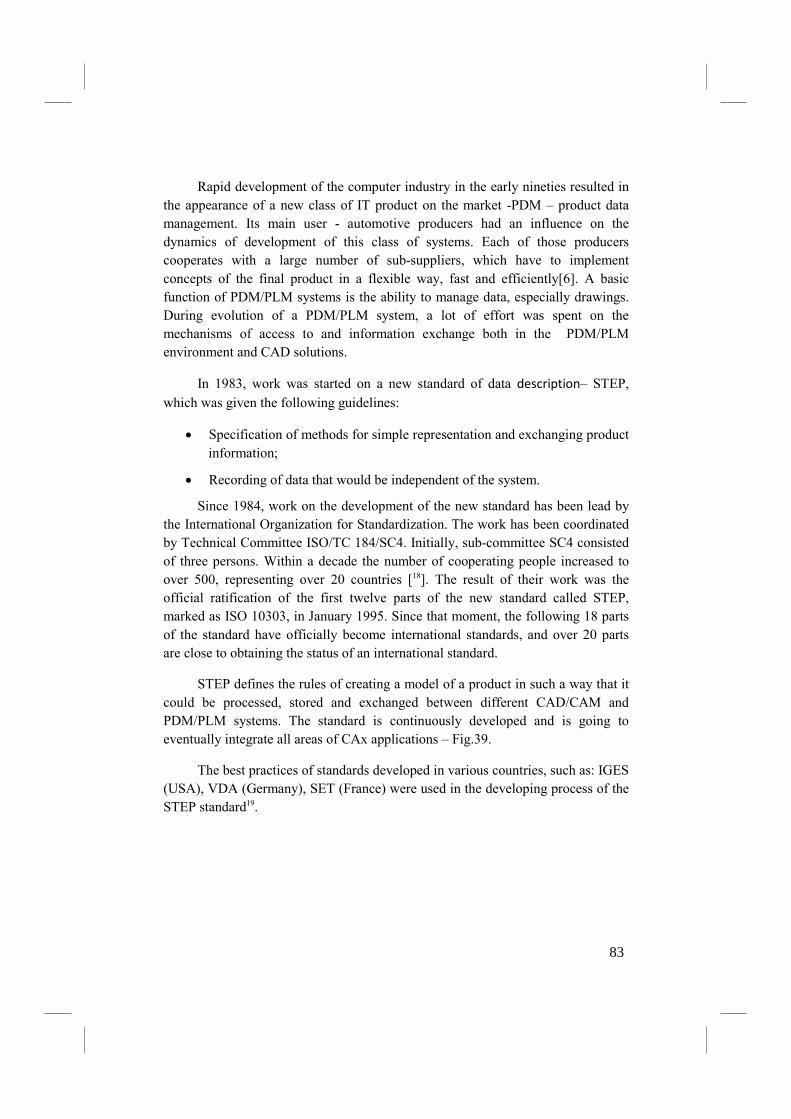
Rapid development of the computer industry in the early nineties resulted in
the appearance of a new class of IT product on the market -PDM – product data
management. Its main user - automotive producers had an influence on the
dynamics of development of this class of systems. Each of those producers
cooperates with a large number of sub-suppliers, which have to implement
concepts of the final product in a flexible way, fast and efficiently[6]. A basic
function of PDM/PLM systems is the ability to manage data, especially drawings.
During evolution of a PDM/PLM system, a lot of effort was spent on the
mechanisms of access to and information exchange both in the PDM/PLM
environment and CAD solutions.
In 1983, work was started on a new standard of data description– STEP,
which was given the following guidelines:
• Specification of methods for simple representation and exchanging product
information;
• Recording of data that would be independent of the system.
Since 1984, work on the development of the new standard has been lead by
the International Organization for Standardization. The work has been coordinated
by Technical Committee ISO/TC 184/SC4. Initially, sub-committee SC4 consisted
of three persons. Within a decade the number of cooperating people increased to
over 500, representing over 20 countries [18]. The result of their work was the
official ratification of the first twelve parts of the new standard called STEP,
marked as ISO 10303, in January 1995. Since that moment, the following 18 parts
of the standard have officially become international standards, and over 20 parts
are close to obtaining the status of an international standard.
STEP defines the rules of creating a model of a product in such a way that it
could be processed, stored and exchanged between different CAD/CAM and
PDM/PLM systems. The standard is continuously developed and is going to
eventually integrate all areas of CAx applications – Fig.39.
The best practices of standards developed in various countries, such as: IGES
(USA), VDA (Germany), SET (France) were used in the developing process of the
STEP standard19.
83
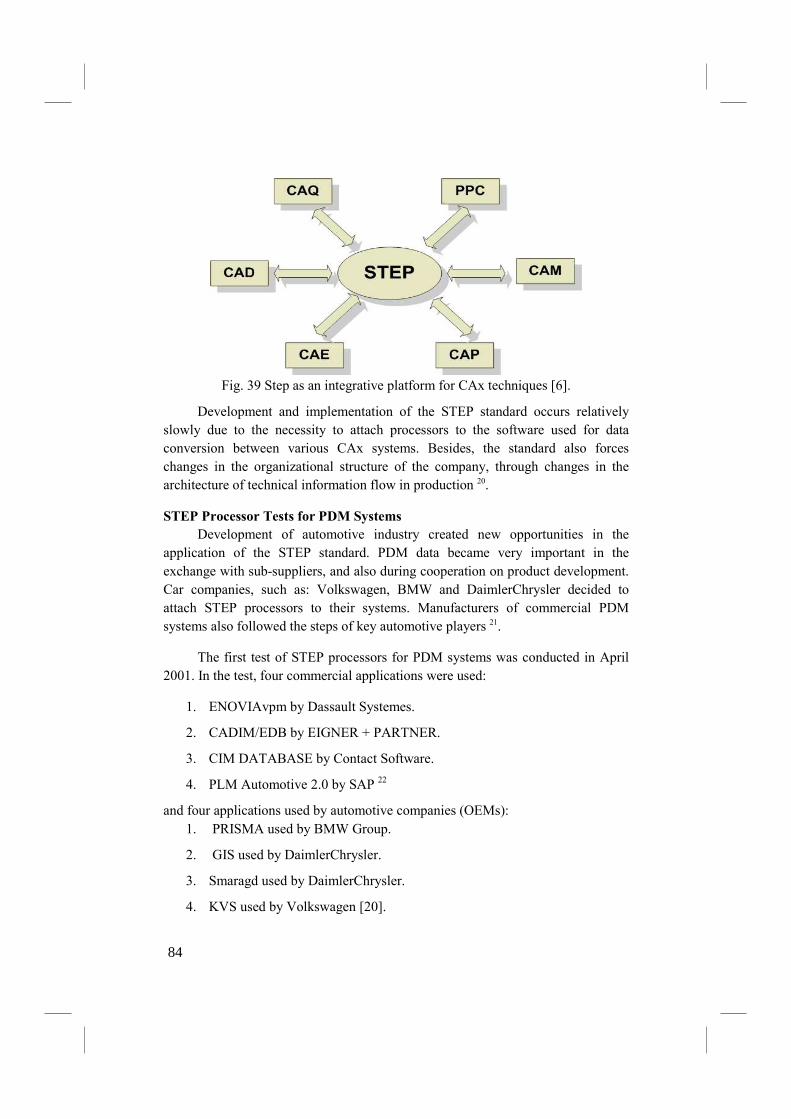
Fig. 39 Step as an integrative platform for CAx techniques [6].
Development and implementation of the STEP standard occurs relatively
slowly due to the necessity to attach processors to the software used for data
conversion between various CAx systems. Besides, the standard also forces
changes in the organizational structure of the company, through changes in the
architecture of technical information flow in production 20.
STEP Processor Tests for PDM Systems
Development of automotive industry created new opportunities in the
application of the STEP standard. PDM data became very important in the
exchange with sub-suppliers, and also during cooperation on product development.
Car companies, such as: Volkswagen, BMW and DaimlerChrysler decided to
attach STEP processors to their systems. Manufacturers of commercial PDM
systems also followed the steps of key automotive players 21.
The first test of STEP processors for PDM systems was conducted in April
2001. In the test, four commercial applications were used:
1. ENOVIAvpm by Dassault Systemes.
2. CADIM/EDB by EIGNER + PARTNER.
3. CIM DATABASE by Contact Software.
4. PLM Automotive 2.0 by SAP 22
and four applications used by automotive companies (OEMs):
1. PRISMA used by BMW Group.
2. GIS used by DaimlerChrysler.
3. Smaragd used by DaimlerChrysler.
4. KVS used by Volkswagen [20].
84
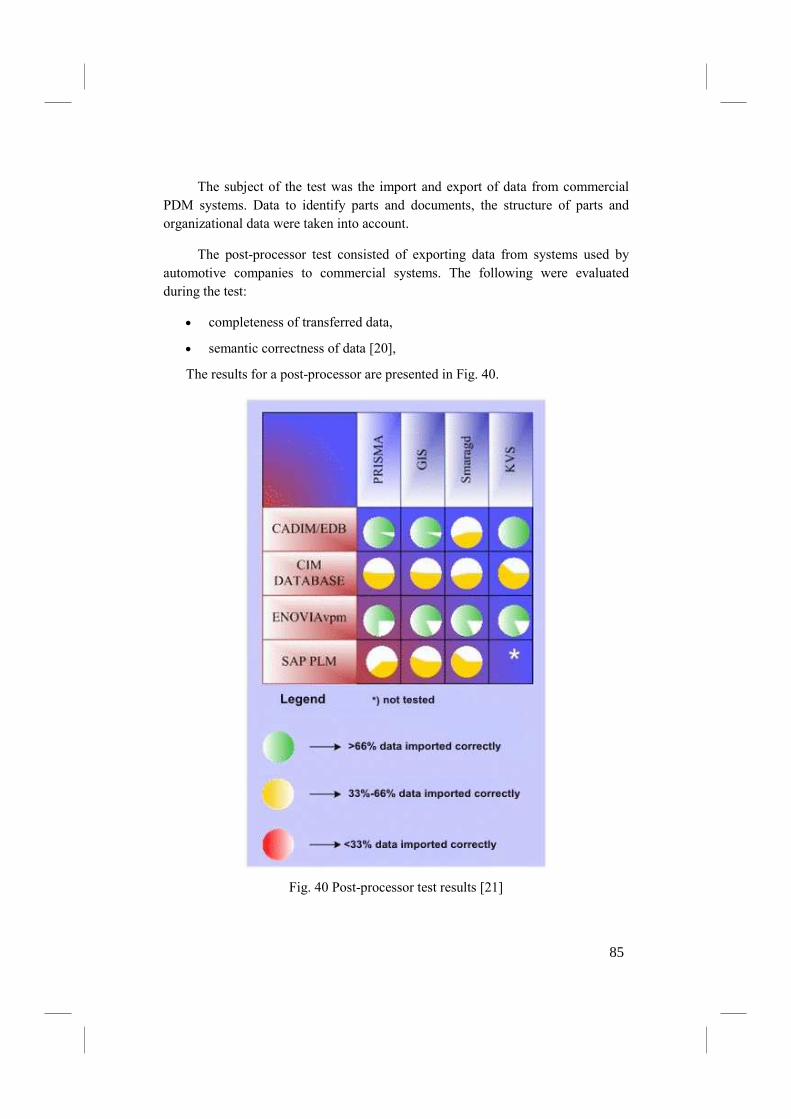
The subject of the test was the import and export of data from commercial
PDM systems. Data to identify parts and documents, the structure of parts and
organizational data were taken into account.
The post-processor test consisted of exporting data from systems used by
automotive companies to commercial systems. The following were evaluated
during the test:
• completeness of transferred data,
• semantic correctness of data [20],
The results for a post-processor are presented in Fig. 40.
Fig. 40 Post-processor test results [21]
85
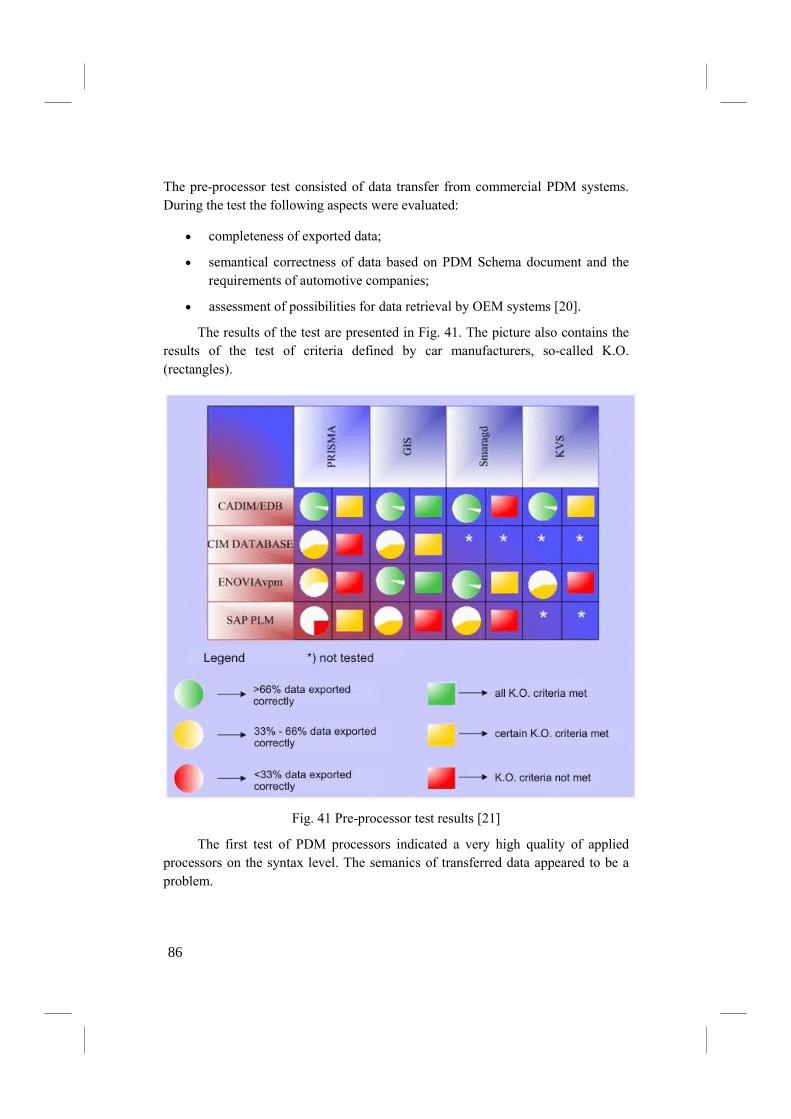
The pre-processor test consisted of data transfer from commercial PDM systems.
During the test the following aspects were evaluated:
• completeness of exported data;
• semantical correctness of data based on PDM Schema document and the
requirements of automotive companies;
• assessment of possibilities for data retrieval by OEM systems [20].
The results of the test are presented in Fig. 41. The picture also contains the
results of the test of criteria defined by car manufacturers, so-called K.O.
(rectangles).
Fig. 41 Pre-processor test results [21]
The first test of PDM processors indicated a very high quality of applied
processors on the syntax level. The semanics of transferred data appeared to be a
problem.
86
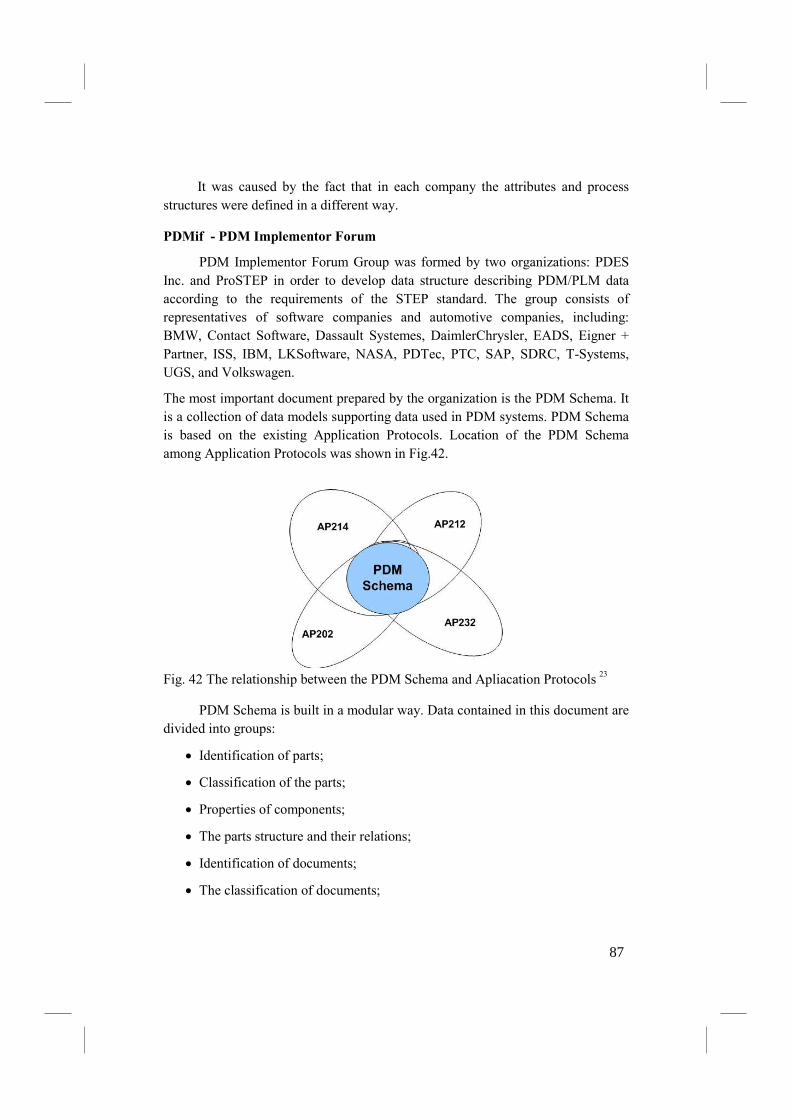
It was caused by the fact that in each company the attributes and process
structures were defined in a different way.
PDMif - PDM Implementor Forum
PDM Implementor Forum Group was formed by two organizations: PDES
Inc. and ProSTEP in order to develop data structure describing PDM/PLM data
according to the requirements of the STEP standard. The group consists of
representatives of software companies and automotive companies, including:
BMW, Contact Software, Dassault Systemes, DaimlerChrysler, EADS, Eigner +
Partner, ISS, IBM, LKSoftware, NASA, PDTec, PTC, SAP, SDRC, T-Systems,
UGS, and Volkswagen.
The most important document prepared by the organization is the PDM Schema. It
is a collection of data models supporting data used in PDM systems. PDM Schema
is based on the existing Application Protocols. Location of the PDM Schema
among Application Protocols was shown in Fig.42.
Fig. 42 The relationship between the PDM Schema and Apliacation Protocols
23
PDM Schema is built in a modular way. Data contained in this document are
divided into groups:
• Identification of parts;
• Classification of the parts;
• Properties of components;
• The parts structure and their relations;
• Identification of documents;
• The classification of documents;
87
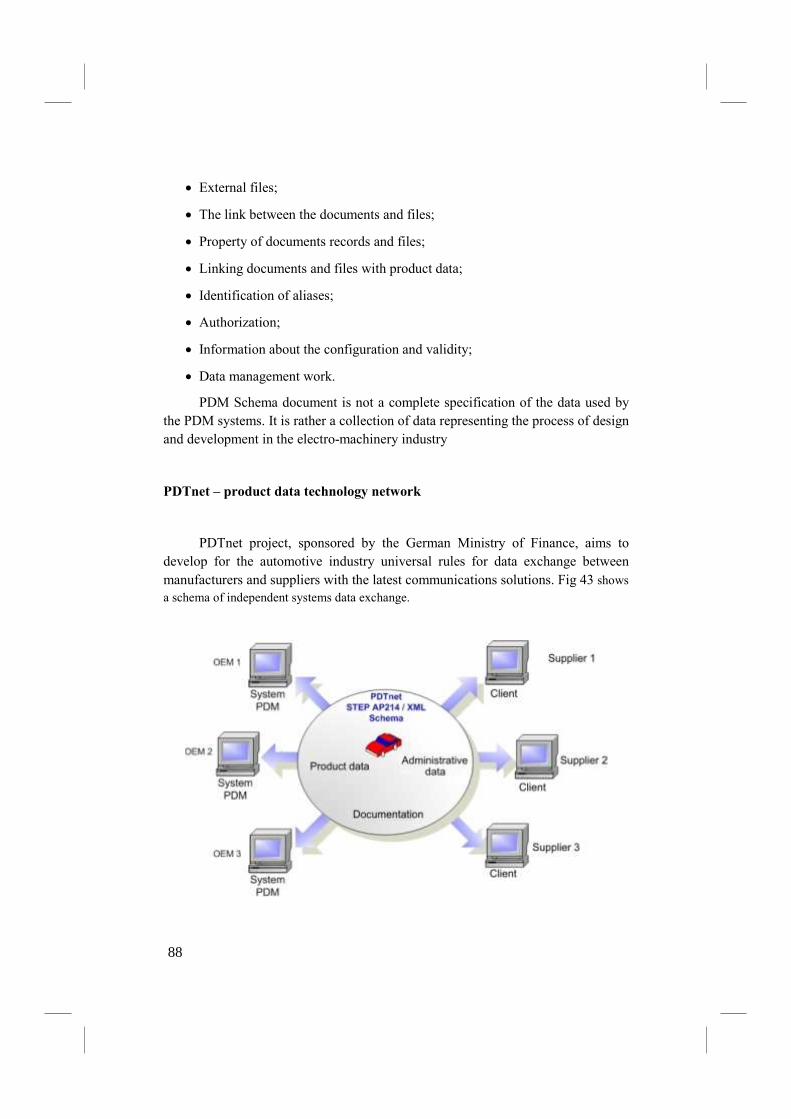
• External files;
• The link between the documents and files;
• Property of documents records and files;
• Linking documents and files with product data;
• Identification of aliases;
• Authorization;
• Information about the configuration and validity;
• Data management work.
PDM Schema document is not a complete specification of the data used by
the PDM systems. It is rather a collection of data representing the process of design
and development in the electro-machinery industry
PDTnet – product data technology network
PDTnet project, sponsored by the German Ministry of Finance, aims to
develop for the automotive industry universal rules for data exchange between
manufacturers and suppliers with the latest communications solutions. Fig 43 shows
a schema of independent systems data exchange.
88
Fig.43. Network integration of the PDM data using a neutral standard of data
describing 24
Work on the project is mainly focused on:
• development of standard specifications for the product and communication
on the basis of the Application Protocol AP 214;
• development of neutral communication protocol used to exchange product
data between a manufacturer and a supplier based on XML technology and
the definition of data model according STEP standard;
• implementation of a pilot version of the neutral protocol for PDM server and
client based on XML technology. [24]
BMW Group, DaimlerChrysler, Volkswagen, Deutsche Telekom AG, VDA eV,
IBM Deutschland are involved in the work on the project.
The partners of the development of PDTnet project were divided into two groups
depending on the way of data transfer: PDM data transfer using the file and data
transfer using available Internet technologies.
The first group works on specifications for the transmission of assembly and
administrative data and documentation. The work is realized by: DaimlerChrysler,
Keiper, Behr and ContinentalTeves.
The second group develops a system to transfer data based on STEP AP214
standard with the use of Internet technologies (XML). The result of the work is the
document: PDTnet STEP AP214 / XML Schema. It defines the contents of the
Application Protocol AP214 using XML. The document contains the following
XML elements:
• the structure of the product;
• data and properties of the parts;
• documents;
• organizational data;
• information about changes and versions [25].
To enable data transmission using the standard, the server must be developed
which would have access to the PDM system and would be able to share data on
the network.
PDTnet Group is also involved in work on developing an international
standard STEP data describing using XML (ISO 10303, Part 28). The project
89
specifies a number of applications describing the use of the interface by the
manufacturers and suppliers:
• Authorization - each client uses the server must be authorized. To pass the
login, the client must first establish a collaboration with the entity with which
it wants to cooperate. Shared data depend on industry sectors which are
represented by the client or the information it needs (projects or
administrative data);
• Ability to review the structure of the product - the client has the ability to
review the structure of the product and additional information in a dynamic
way (interactive). The server provides information about the structure of the
product to which the client has access rights;
• Downloading data - server allows clients to download files and documents
(eg. CAD files). Transfer can take place at customer request or
asynchronously;
• Input data - server allows to upload the data by the client to the PDM
system. This operation is very complicated because of the variety of
decisions that a client can take (the data creation / deletion of data);
• Generation of data in response to a query - the server generates a list of
data (eg. product structure), as a result of customer queries;
• Change log - customers can be at any time informed of the changes in the
data. Information about changes can be communicated by mail or directly
through the network [25];
One of the factors that has had the greatest impact on the development of
STEP standards has been the progress in the development of information
technology. This enabled the development of software solutions used in product
design and business management, and sharing information through a network of
internet / intranet. However, despite such a strong technological support for the
STEP standard, it is still little known and applied. The reason for this is a very
small number of centers that would popularize the practical application of the
standards and the lack of literature which would enable those interested to refer to
the STEP standard.
90
PLM implementation
Verification of Costs Related to PDM/PLM Systems
[26]
A commonly asked question about how to verify/examine costs related to
investing in PDM/PLM systems is: what is the return time for such an investment
or what are typical advantages of implementing a PDM/PLM system. Assessment
of economic benefits from introducing a PDM/PLM system is connected with two
basic elements: branch of industry, in which the system is to be implemented, and
the possibility and capability of measuring advantages, which are uneasily
perceptible, to make financial calculations concerning the investment.
Information about the branch of industry is essential as there are several lines
(such as airplane, automotive, or electronic market leaders), where companies feel
they have to introduce a PDM/PLM systems because their competitors use one or
because their clients require them to do so. In such a situation, verification of such
undertaking plays a much less important role and the implementation of a
PDM/PLM system and its choice is based most of all on technical capabilities of a
given PDM/PLM system, which should meet the short- and long-term requirements
concerning data management.
Although that is the way it happens in practice, it should be mentioned that
such actions do not always lead to the best results for the users, as they are not
trying to understand how they are going to use the new system or how they are
going to measure benefits arising from its implementation. “You get as much as
you can check”, and that is why the users which are incapable of defining methods
of evaluating business advantages of introducing a PDM/PLM system will not be
in favor of implementing solutions improving business processes. Such users can
only evaluate success of the undertaking by determining the number of installed
PDM/PLM workstations, and that may be irrelevant to business requirements, such
as the reduction of product development time or increasing product's quality. Even
in trades where the verification of costs and advantages appears unnecessary it is
worthwhile to define a method to measure the effects of the undertaking.
In most industrial sectors, the question about verification and assessment of
the implementation costs of a PDM/PLM system must be addressed precisely and
with all details, and the answer must be reliable. Most of all, it must be shown that
91
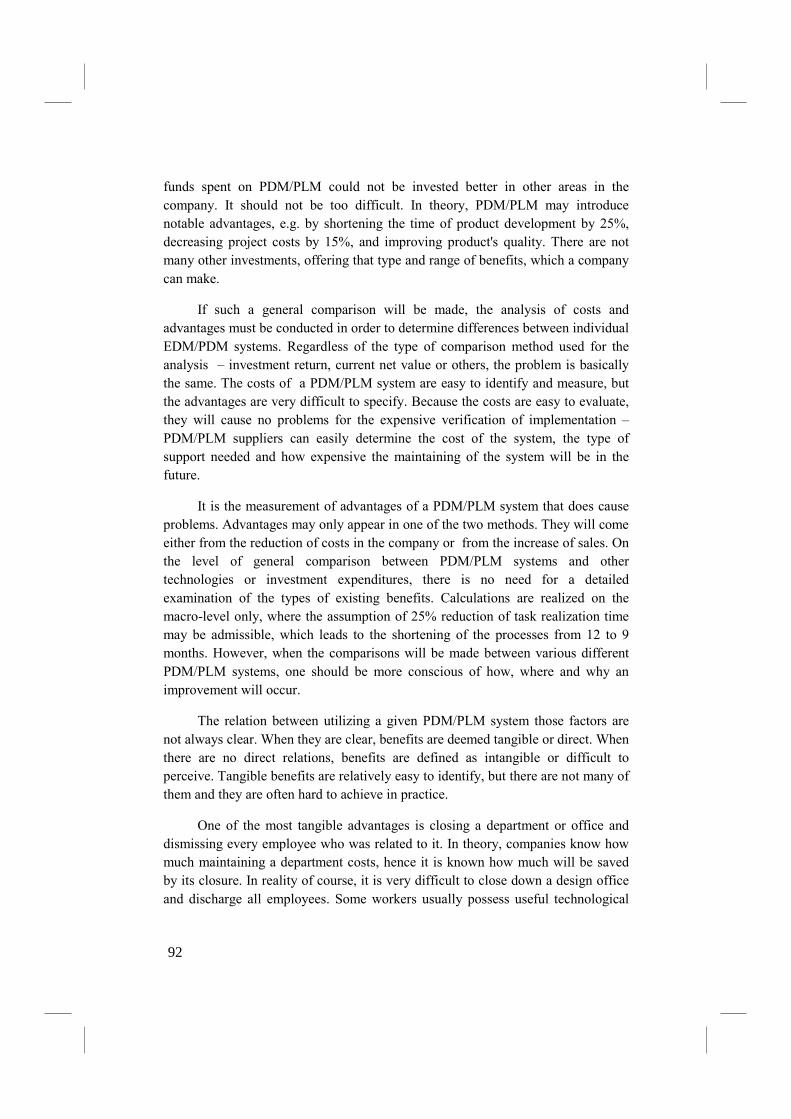
funds spent on PDM/PLM could not be invested better in other areas in the
company. It should not be too difficult. In theory, PDM/PLM may introduce
notable advantages, e.g. by shortening the time of product development by 25%,
decreasing project costs by 15%, and improving product's quality. There are not
many other investments, offering that type and range of benefits, which a company
can make.
If such a general comparison will be made, the analysis of costs and
advantages must be conducted in order to determine differences between individual
EDM/PDM systems. Regardless of the type of comparison method used for the
analysis – investment return, current net value or others, the problem is basically
the same. The costs of a PDM/PLM system are easy to identify and measure, but
the advantages are very difficult to specify. Because the costs are easy to evaluate,
they will cause no problems for the expensive verification of implementation –
PDM/PLM suppliers can easily determine the cost of the system, the type of
support needed and how expensive the maintaining of the system will be in the
future.
It is the measurement of advantages of a PDM/PLM system that does cause
problems. Advantages may only appear in one of the two methods. They will come
either from the reduction of costs in the company or from the increase of sales. On
the level of general comparison between PDM/PLM systems and other
technologies or investment expenditures, there is no need for a detailed
examination of the types of existing benefits. Calculations are realized on the
macro-level only, where the assumption of 25% reduction of task realization time
may be admissible, which leads to the shortening of the processes from 12 to 9
months. However, when the comparisons will be made between various different
PDM/PLM systems, one should be more conscious of how, where and why an
improvement will occur.
The relation between utilizing a given PDM/PLM system those factors are
not always clear. When they are clear, benefits are deemed tangible or direct. When
there are no direct relations, benefits are defined as intangible or difficult to
perceive. Tangible benefits are relatively easy to identify, but there are not many of
them and they are often hard to achieve in practice.
One of the most tangible advantages is closing a department or office and
dismissing every employee who was related to it. In theory, companies know how
much maintaining a department costs, hence it is known how much will be saved
by its closure. In reality of course, it is very difficult to close down a design office
and discharge all employees. Some workers usually possess useful technological
92
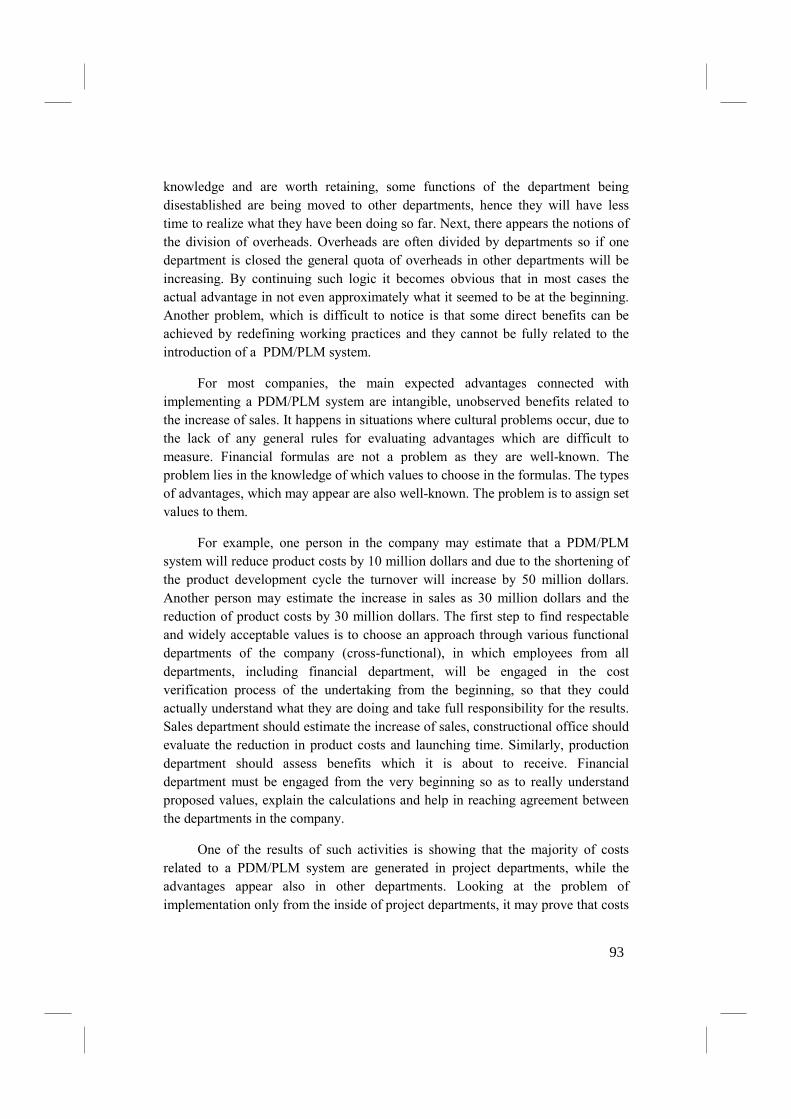
knowledge and are worth retaining, some functions of the department being
disestablished are being moved to other departments, hence they will have less
time to realize what they have been doing so far. Next, there appears the notions of
the division of overheads. Overheads are often divided by departments so if one
department is closed the general quota of overheads in other departments will be
increasing. By continuing such logic it becomes obvious that in most cases the
actual advantage in not even approximately what it seemed to be at the beginning.
Another problem, which is difficult to notice is that some direct benefits can be
achieved by redefining working practices and they cannot be fully related to the
introduction of a PDM/PLM system.
For most companies, the main expected advantages connected with
implementing a PDM/PLM system are intangible, unobserved benefits related to
the increase of sales. It happens in situations where cultural problems occur, due to
the lack of any general rules for evaluating advantages which are difficult to
measure. Financial formulas are not a problem as they are well-known. The
problem lies in the knowledge of which values to choose in the formulas. The types
of advantages, which may appear are also well-known. The problem is to assign set
values to them.
For example, one person in the company may estimate that a PDM/PLM
system will reduce product costs by 10 million dollars and due to the shortening of
the product development cycle the turnover will increase by 50 million dollars.
Another person may estimate the increase in sales as 30 million dollars and the
reduction of product costs by 30 million dollars. The first step to find respectable
and widely acceptable values is to choose an approach through various functional
departments of the company (cross-functional), in which employees from all
departments, including financial department, will be engaged in the cost
verification process of the undertaking from the beginning, so that they could
actually understand what they are doing and take full responsibility for the results.
Sales department should estimate the increase of sales, constructional office should
evaluate the reduction in product costs and launching time. Similarly, production
department should assess benefits which it is about to receive. Financial
department must be engaged from the very beginning so as to really understand
proposed values, explain the calculations and help in reaching agreement between
the departments in the company.
One of the results of such activities is showing that the majority of costs
related to a PDM/PLM system are generated in project departments, while the
advantages appear also in other departments. Looking at the problem of
implementation only from the inside of project departments, it may prove that costs
93
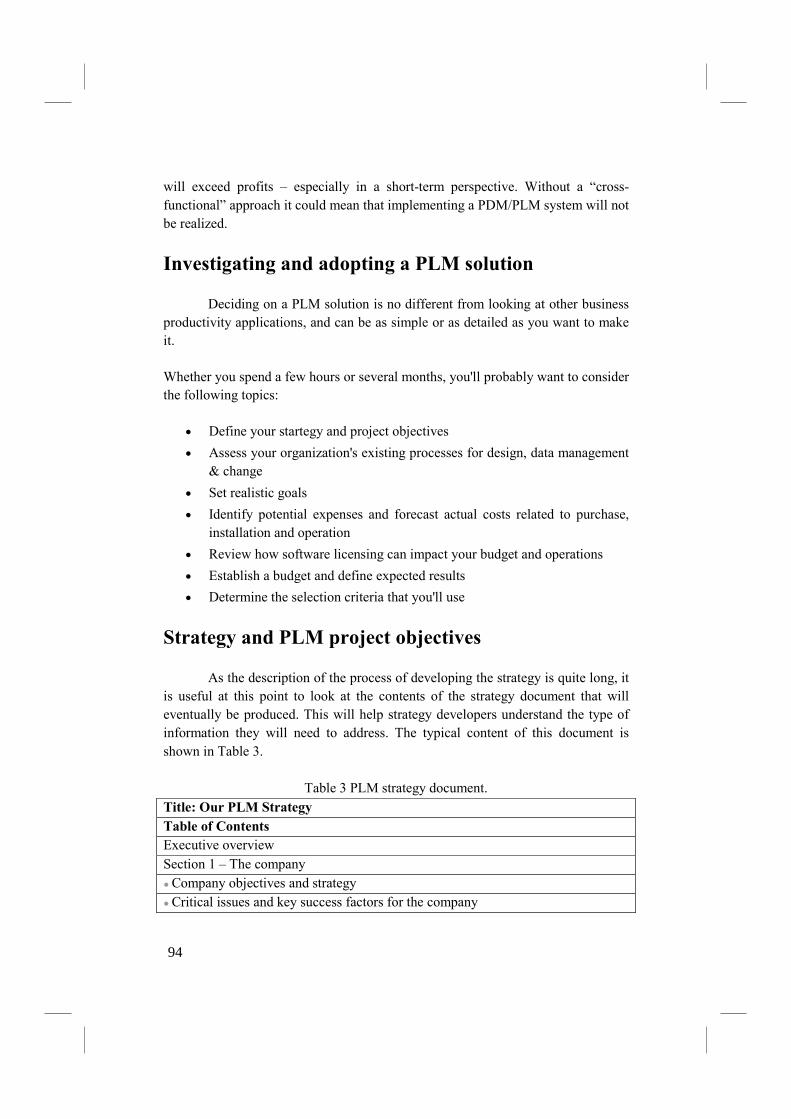
will exceed profits – especially in a short-term perspective. Without a “cross-
functional” approach it could mean that implementing a PDM/PLM system will not
be realized.
Investigating and adopting a PLM solution
Deciding on a PLM solution is no different from looking at other business
productivity applications, and can be as simple or as detailed as you want to make
it.
Whether you spend a few hours or several months, you'll probably want to consider
the following topics:
• Define your startegy and project objectives
• Assess your organization's existing processes for design, data management
& change
• Set realistic goals
• Identify potential expenses and forecast actual costs related to purchase,
installation and operation
• Review how software licensing can impact your budget and operations
• Establish a budget and define expected results
• Determine the selection criteria that you'll use
Strategy and PLM project objectives
As the description of the process of developing the strategy is quite long, it
is useful at this point to look at the contents of the strategy document that will
eventually be produced. This will help strategy developers understand the type of
information they will need to address. The typical content of this document is
shown in Table 3.
Table 3 PLM strategy document.
Title: Our PLM Strategy
Table of Contents
Executive overview
Section 1 – The company
● Company objectives and strategy
● Critical issues and key success factors for the company
94
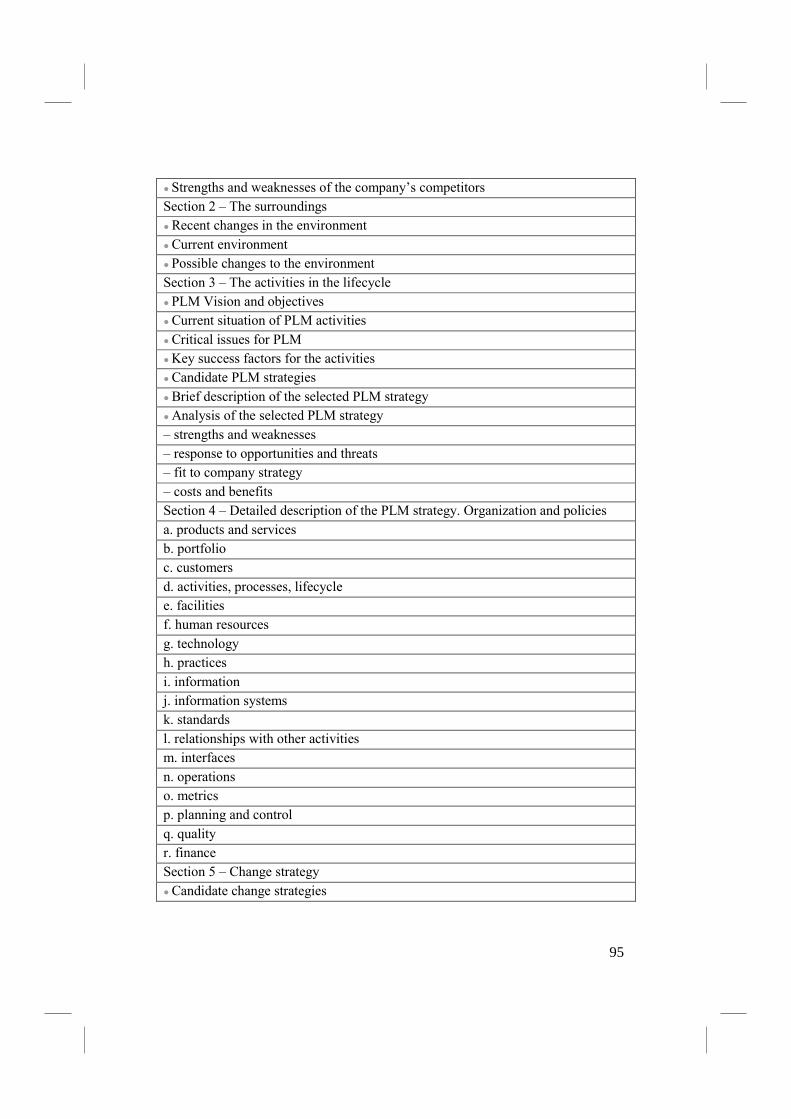
● Strengths and weaknesses of the company’s competitors
Section 2 – The surroundings
● Recent changes in the environment
● Current environment
● Possible changes to the environment
Section 3 – The activities in the lifecycle
● PLM Vision and objectives
● Current situation of PLM activities
● Critical issues for PLM
● Key success factors for the activities
● Candidate PLM strategies
● Brief description of the selected PLM strategy
● Analysis of the selected PLM strategy
– strengths and weaknesses
– response to opportunities and threats
– fit to company strategy
– costs and benefits
Section 4 – Detailed description of the PLM strategy. Organization and policies
a. products and services
b. portfolio
c. customers
d. activities, processes, lifecycle
e. facilities
f. human resources
g. technology
h. practices
i. information
j. information systems
k. standards
l. relationships with other activities
m. interfaces
n. operations
o. metrics
p. planning and control
q. quality
r. finance
Section 5 – Change strategy
● Candidate change strategies
95
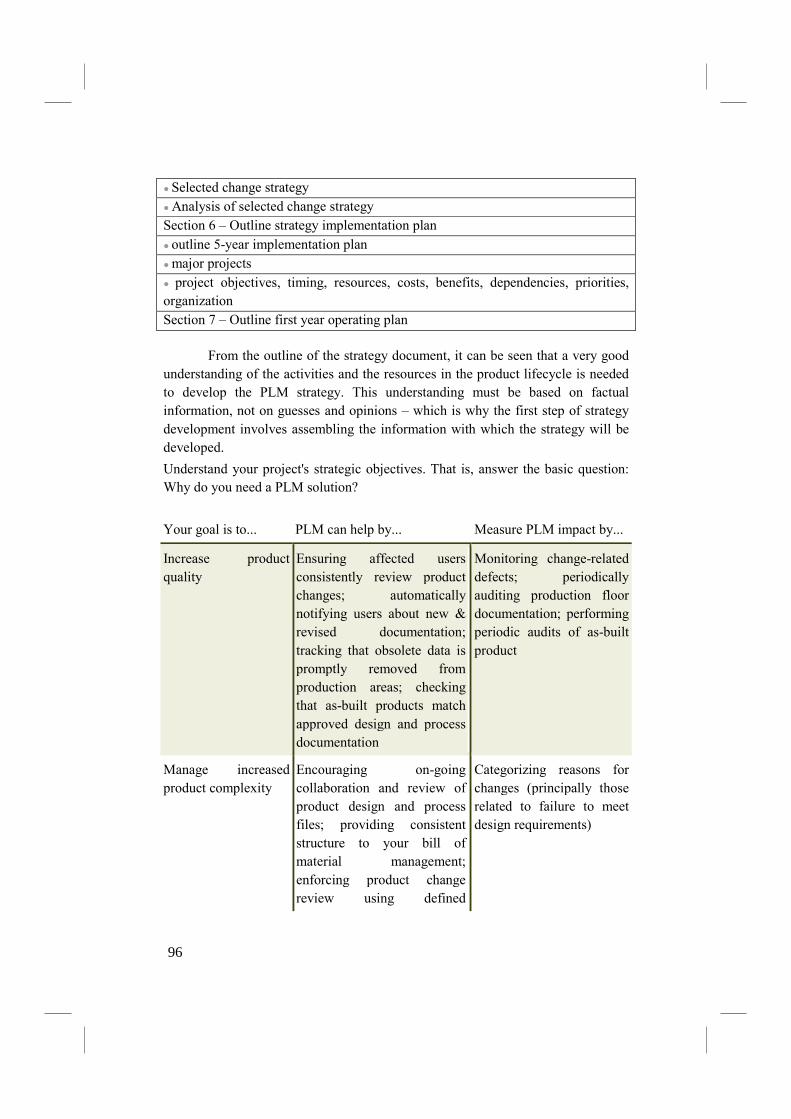
● Selected change strategy
● Analysis of selected change strategy
Section 6 – Outline strategy implementation plan
● outline 5-year implementation plan
● major projects
● project objectives, timing, resources, costs, benefits, dependencies, priorities,
organization
Section 7 – Outline first year operating plan
From the outline of the strategy document, it can be seen that a very good
understanding of the activities and the resources in the product lifecycle is needed
to develop the PLM strategy. This understanding must be based on factual
information, not on guesses and opinions – which is why the first step of strategy
development involves assembling the information with which the strategy will be
developed.
Understand your project's strategic objectives. That is, answer the basic question:
Why do you need a PLM solution?
Your goal is to... PLM can help by... Measure PLM impact by...
Increase product
quality
Ensuring affected users
consistently review product
changes; automatically
notifying users about new &
revised documentation;
tracking that obsolete data is
promptly removed from
production areas; checking
that as-built products match
approved design and process
documentation
Monitoring change-related
defects; periodically
auditing production floor
documentation; performing
periodic audits of as-built
product
Manage increased
product complexity
Encouraging on-going
collaboration and review of
product design and process
files; providing consistent
structure to your bill of
material management;
enforcing product change
review using defined
Categorizing reasons for
changes (principally those
related to failure to meet
design requirements)
96
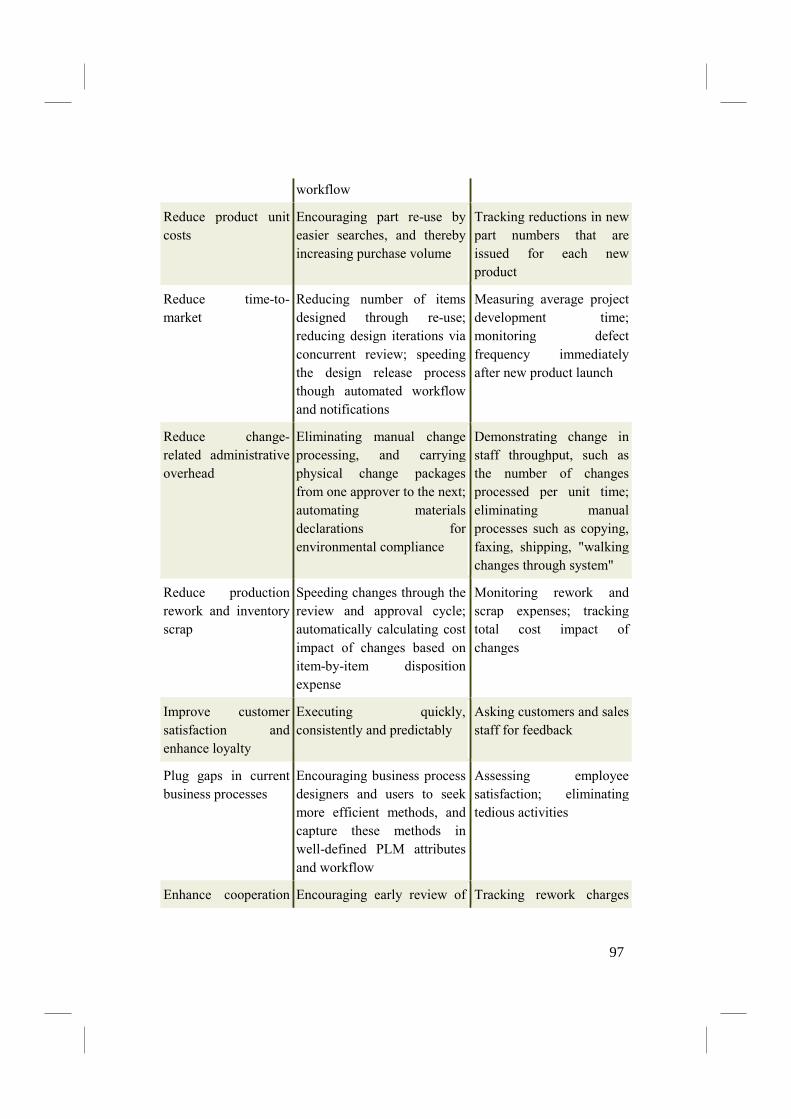
workflow
Reduce product unit
costs
Encouraging part re-use by
easier searches, and thereby
increasing purchase volume
Tracking reductions in new
part numbers that are
issued for each new
product
Reduce time-to-
market
Reducing number of items
designed through re-use;
reducing design iterations via
concurrent review; speeding
the design release process
though automated workflow
and notifications
Measuring average project
development time;
monitoring defect
frequency immediately
after new product launch
Reduce change-
related administrative
overhead
Eliminating manual change
processing, and carrying
physical change packages
from one approver to the next;
automating materials
declarations for
environmental compliance
Demonstrating change in
staff throughput, such as
the number of changes
processed per unit time;
eliminating manual
processes such as copying,
faxing, shipping, "walking
changes through system"
Reduce production
rework and inventory
scrap
Speeding changes through the
review and approval cycle;
automatically calculating cost
impact of changes based on
item-by-item disposition
expense
Monitoring rework and
scrap expenses; tracking
total cost impact of
changes
Improve customer
satisfaction and
enhance loyalty
Executing quickly,
consistently and predictably
Asking customers and sales
staff for feedback
Plug gaps in current
business processes
Encouraging business process
designers and users to seek
more efficient methods, and
capture these methods in
well-defined PLM attributes
and workflow
Assessing employee
satisfaction; eliminating
tedious activities
Enhance cooperation Encouraging early review of Tracking rework charges
97
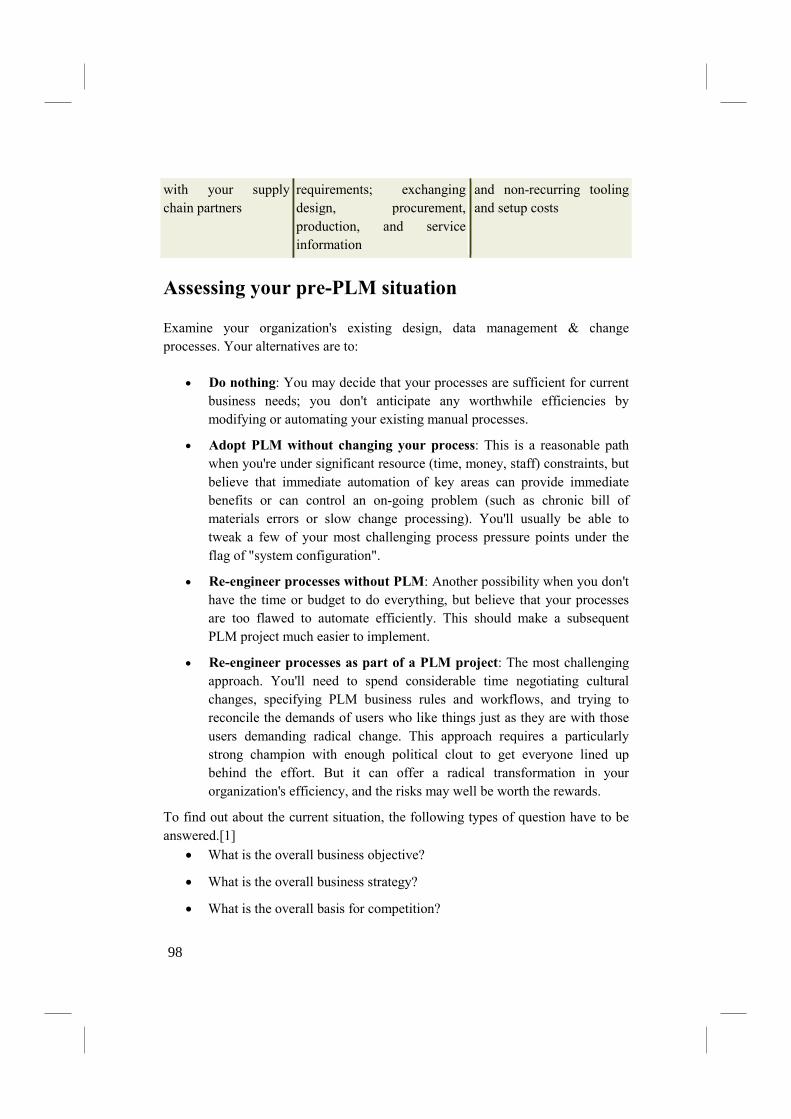
with your supply
chain partners
requirements; exchanging
design, procurement,
production, and service
information
and non-recurring tooling
and setup costs
Assessing your pre-PLM situation
Examine your organization's existing design, data management & change
processes. Your alternatives are to:
• Do nothing: You may decide that your processes are sufficient for current
business needs; you don't anticipate any worthwhile efficiencies by
modifying or automating your existing manual processes.
• Adopt PLM without changing your process: This is a reasonable path
when you're under significant resource (time, money, staff) constraints, but
believe that immediate automation of key areas can provide immediate
benefits or can control an on-going problem (such as chronic bill of
materials errors or slow change processing). You'll usually be able to
tweak a few of your most challenging process pressure points under the
flag of "system configuration".
• Re-engineer processes without PLM: Another possibility when you don't
have the time or budget to do everything, but believe that your processes
are too flawed to automate efficiently. This should make a subsequent
PLM project much easier to implement.
• Re-engineer processes as part of a PLM project: The most challenging
approach. You'll need to spend considerable time negotiating cultural
changes, specifying PLM business rules and workflows, and trying to
reconcile the demands of users who like things just as they are with those
users demanding radical change. This approach requires a particularly
strong champion with enough political clout to get everyone lined up
behind the effort. But it can offer a radical transformation in your
organization's efficiency, and the risks may well be worth the rewards.
To find out about the current situation, the following types of question have to be
answered.[1]
• What is the overall business objective?
• What is the overall business strategy?
• What is the overall basis for competition?
98
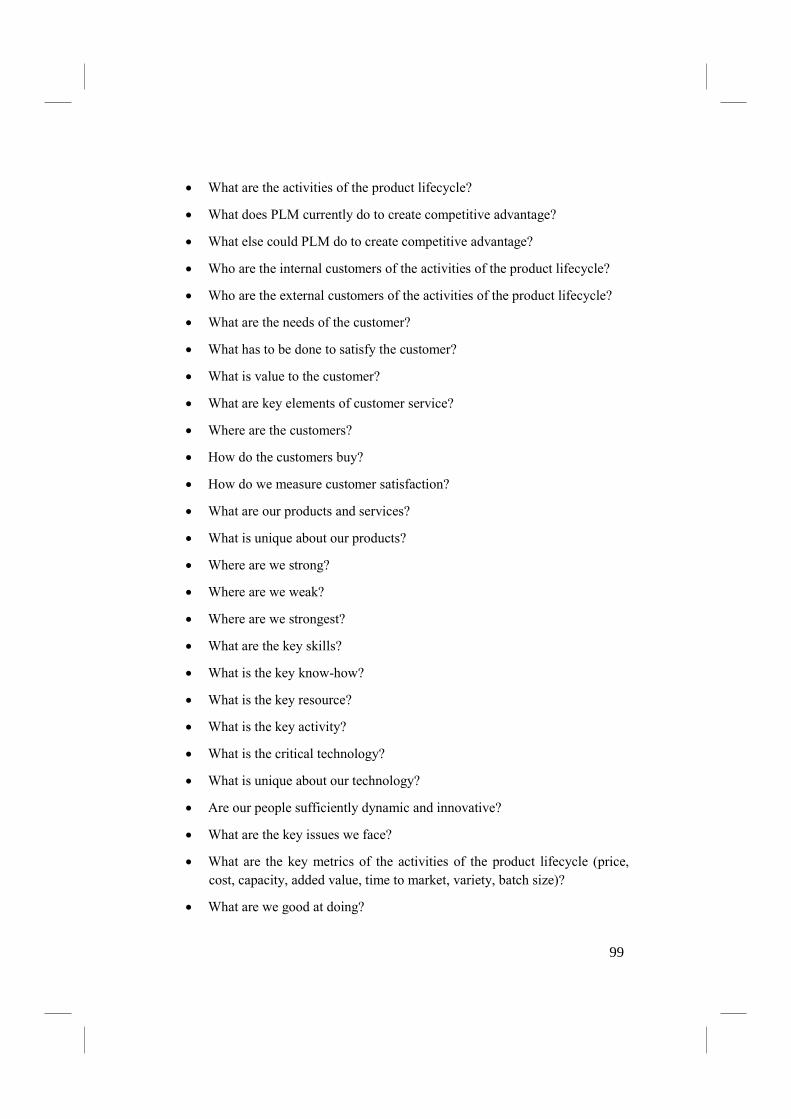
• What are the activities of the product lifecycle?
• What does PLM currently do to create competitive advantage?
• What else could PLM do to create competitive advantage?
• Who are the internal customers of the activities of the product lifecycle?
• Who are the external customers of the activities of the product lifecycle?
• What are the needs of the customer?
• What has to be done to satisfy the customer?
• What is value to the customer?
• What are key elements of customer service?
• Where are the customers?
• How do the customers buy?
• How do we measure customer satisfaction?
• What are our products and services?
• What is unique about our products?
• Where are we strong?
• Where are we weak?
• Where are we strongest?
• What are the key skills?
• What is the key know-how?
• What is the key resource?
• What is the key activity?
• What is the critical technology?
• What is unique about our technology?
• Are our people sufficiently dynamic and innovative?
• What are the key issues we face?
• What are the key metrics of the activities of the product lifecycle (price,
cost, capacity, added value, time to market, variety, batch size)?
• What are we good at doing?
99
• What could we be good at doing?
• What are we bad at doing?
• What and where are the current resources in the product lifecycle?
• How are they organised?
• Why are they organised like this?
• What are their roles?
• Who is responsible for the activities in the product lifecycle?
• What are our core capabilities?
• What key capabilities of the lifecycle are exploited?
• What key capabilities of the lifecycle could be exploited?
• Which of the products and services in the lifecycle are the most profitable?
• Who are the most important customers?
• What do the most important customers buy?
• Is competition price sensitive?
• How are we perceived by our customers?
• How do we communicate with our customers?
• How successful have we been in meeting our objectives in the past?
• What has prevented us from meeting our objectives?
• How do we view our current performance?
• What were our past strategies?
• How successful were they?
• How were they developed?
• How were they communicated?
• How were they implemented?
• What were our past plans?
• How successful were they?
• What assumptions have turned out to be invalid?
100
• What have been the major recent milestones in performance improvement?
• What went wrong? Why?
• What went right? Why?
• What has recently changed? What are its implications?
• What is currently changing? What are its implications?
• What are the basic beliefs of the people working in the lifecycle?
• What are the unwritten rules across the lifecycle?
• What are the fundamental assumptions?
• What gives us most problems?
• What should we do differently? What is stopping us from doing it?
• Is the product portfolio clear to everyone internally?
• Is there a clear plan for evolution of the products?
• What are our key processes?
• What are our key application systems?
• Are our processes clearly defined?
• Do we have our product data under control?
• Do we have our product workflow under control?
• How could we improve our product end-of-life activities?
• How could we improve our customer support activities?
• How good are we at making use of ideas generated internally and
externally?
• What and where are the current revenue sources in the lifecycle?
• Which products have performed worst? Why?
• Which development projects performed worst? Why?
• How often do we reuse parts?
• How well do we manage product development projects?
• How well do we manage product support projects?
• How well do we manage customer requirements?
101
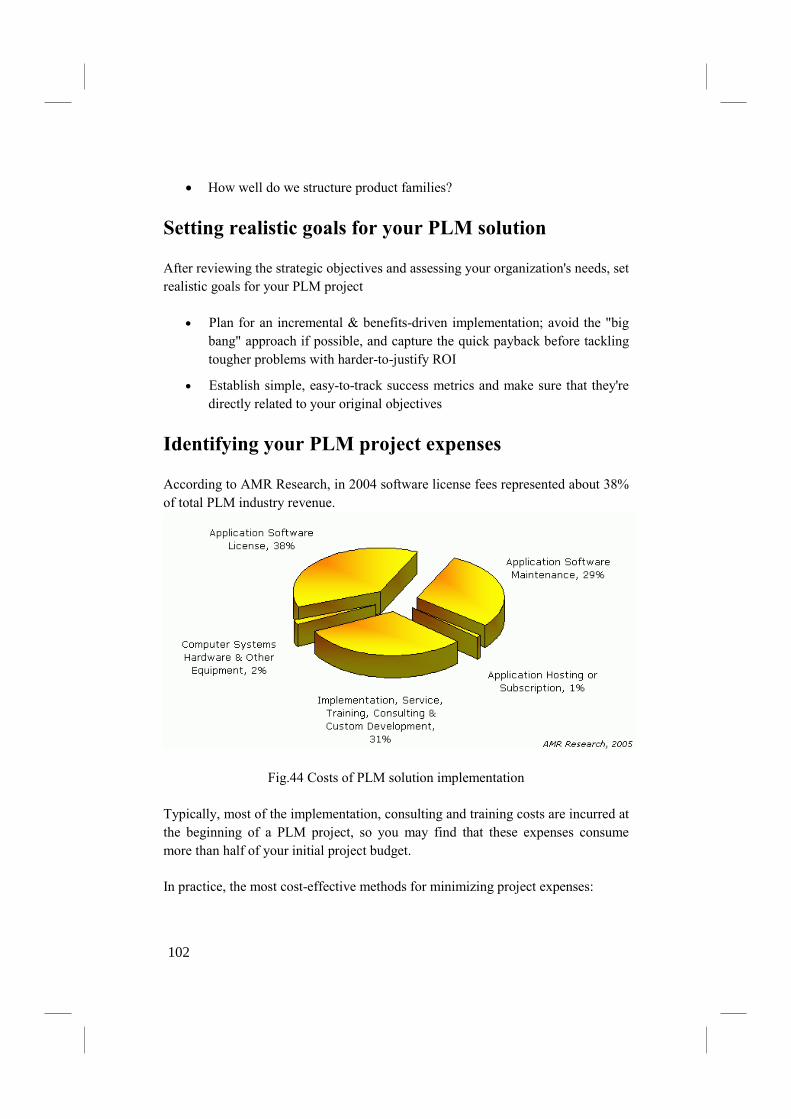
• How well do we structure product families?
Setting realistic goals for your PLM solution
After reviewing the strategic objectives and assessing your organization's needs, set
realistic goals for your PLM project
• Plan for an incremental & benefits-driven implementation; avoid the "big
bang" approach if possible, and capture the quick payback before tackling
tougher problems with harder-to-justify ROI
• Establish simple, easy-to-track success metrics and make sure that they're
directly related to your original objectives
Identifying your PLM project expenses
According to AMR Research, in 2004 software license fees represented about 38%
of total PLM industry revenue.
Fig.44 Costs of PLM solution implementation
Typically, most of the implementation, consulting and training costs are incurred at
the beginning of a PLM project, so you may find that these expenses consume
more than half of your initial project budget.
In practice, the most cost-effective methods for minimizing project expenses:
102
• Emphasize easy to use software Ensure that your installation,
configuration and training costs are as low as possible by choosing the
simplest, most user-friendly software that meets your needs. Most
reputable vendors will let you try before you buy.
• PLM will be a big win, so don't over-buy Minimize configuration
consulting and custom development work, principally through avoiding
enterprise integration projects that yield only minor productivity
improvements.
Forecasting your PLM project costs
There are many PLM solutions available. Some vendors will require an extensive
hardware, software and services investment; others are more sensitive to a limited
budget, and will try to work with existing hardware, low-cost (or free) databases,
and minimize the use of consultants.
This list suggests some possible expenses to explore:
• Staff time to research & evaluate alternatives
• Software solution costs
o per-user or concurrent-use client licenses
o per-CPU (or other) application license
o database license
o special administrator licenses
o annual maintenance, support, upgrades
• Hardware costs
o workstations
o application and/or database servers
o backup devices
• Special file viewers
• Downstream ERP file import or integration
• Network & bandwidth costs
• Deployment costs
o Consulting services for process reengineering and application
configuration
o Legacy data import and migration
o Pilot (proof of concept)
103
o Production deployment
Licensing methods: initial price versus lifetime cost
Before contacting vendors, consider the operational and financial aspects
of software licensing models carefully. Some vendors offer more than one
licensing approach. Decide what will work best for you and make your list
accordingly.
Traditional perpetual license, with annual maintenance
If you have the budget, this path is usually the simplest to manage as well
as cheapest over the long run because you have a definite control over your costs.
The alternative license methods all represent an on-going cost, and may bundle
financing costs into their monthly charges.
Perpetual licenses, as well as subscription licenses, let you tailor the configuration
to your exact needs and even customize the product and/or its interfaces. You have
complete control over performance, storage costs, maintenance and service
interruptions, and - most important - your critical product data. Furthermore, if
you're perfectly satisfied with the system that you have, the maintenance can
usually be stopped.
Subscription or lease
This is typically like a magazine subscription where you can buy for any
number of users, and can stop at the end of the subscription period. It's an
inexpensive way to get into PLM, since there are no large upfront software costs,
except (if needed) a database server license. You still get the operational benefits of
a perpetual license: high performance, typically a superior user interface, in-house
control of your critical product data, ability to tightly integrate your other systems.
Subscription licenses are sometimes preferred because they can be dropped if, for
instance, you only required a large number of licenses for a temporary project, or
you're concerned about unaccounted-for licenses installed on obsolete PCs. Some
subscription models allow you to convert to perpetual licenses after a certain period
("lease to own").
Internet ASP-based services
A PLM application service provider (ASP) hosts the entire PLM system
off-site, using a data center shared among all of its customers. A PLM ASP perhaps
104
offers the most financially attractive short-term PLM solution but comes with
significant longer-term risks. The per-user cost is initially reasonable if you aren't
particularly concerned with the total cost over 5 or 10 years.
The principal benefit of a PLM ASP is that the vendor handles the hardware and
software management tasks: acquisition, installation, maintenance, and upgrades.
Furthermore, the ASP defines a rather specific set of features that simplifies your
configuration choices. Finally, if you don't want to bring your legacy data into the
system, and can quickly make your configuration choices, you can have access to
your PLM system in a matter of hours.
As you'll see, we have reservations about a PLM ASP solution; a hosted
application may be perfect for incidental business processes (think "travel
reservations" or "HR benefits"), but it's a much tougher decision when applied to
mission-critical functions and irreplaceable proprietary data.
If limited budget or internal IT resources suggest a PLM ASP, you'll want to weigh
these issues:
• Your company's mission-critical data is not on site. This has two effects:
o How much do you know about the security, backup process,
operations skill, disaster recovery procedures, and financial
stability of your PLM ASP, and
o What happens to your productivity if your Internet connection or
PLM ASP goes down for a day?
• A PLM ASP solution typically implements a "one size fits most" approach,
and is much more limited in its configurability; make sure your business
processes won't be constrained.
• Usability will be limited by the browser-based user interface, and web
technology simply isn't as flexible and as powerful as native applications.
Can you imagine CAD or even a spreadsheet hosted on the web?
• Performance is determined by your Internet connection's available bit rate
and utilization, your vendor's available bit rate and utilization, the load on
datacenter computers, and the systems selected for the datacenter. If you
aren't happy with the system performance, upgrading will require more
analysis and negotiating. There's no guarantee that you'll get the
performance you need if your requirements exceed your vendor's abilities.
105
• There may be additional charges for exceeding contract limits for data
storage, processing time, or connection bandwidth.
• Upgrades and service downtimes are scheduled for the vendor's
convenience, not yours. Except during project "crunch time", this should
not be a significant issue if your office runs inside the typical workweek,
especially if you select a PLM ASP in your time zone.
• In most cases, all of the PLM ASP's clients share a common code base, so
you can't delay or skip an upgrade. Whether you're in the middle of a time-
critical project or simply satisfied with your software, you'll still be getting
your new upgrade (and possibly re-training, data conversion, and new
bugs) with everyone else.
• If you're not happy with your PLM ASP, check your service contract and
practice your diplomatic skills before asking for any help in moving your
data to a competing PLM system.
A PLM application service provider may be the only reasonable alternative for
your company, but you'll want to anticipate all of the ways the arrangement could
fail, and make appropriate contingency plans.
Establish a budget and calculate ROI
Establish a budget and figure the return on investment (ROI)
• Control costs at each stage of the project; savings accrue at each step as
you simplify your requirements
• If you are having trouble with justifying ROI
o Scale back project scope
o Look for simpler, more affordable solutions
o Lease rather than buy
If you choose to concentrate on the "low-hanging fruit", ensure that this short-term
focus supports a flexible, well-rounded PLM solution and is not a dead end.
106
PLM market
While the global economic downturn in 2009 impacted revenues for
Product Lifecycle Management (PLM) suppliers, revenues for the first two quarters
of 2010 reflect a strong rebound in new licenses and overall PLM business.
Demand for increased efficiency and productivity; a continuing need for
collaboration across a global manufacturing lifecycle; PLM solutions penetrating
new markets such as power & energy, architecture & construction, shipbuilding,
and consumer goods; the rapidly growing need for product re-invention and
innovation; the emergence of mechatronics and product complexity; the continued
growth of manufacturing in emerging economies; and expanding adoption of a
more holistic end-to-end PLM solution set are all contributing to growth in the
worldwide PLM market, according to a new ARC Advisory Group study.27
According to Dick Slansky, the principal author of ARC’s “Product
Lifecycle Management Worldwide Outlook” study, “Clearly, the market leaders in
PLM, as well as many of the smaller suppliers, have responded to the broadening
adoption of PLM technologies into new markets with strategies and solutions to
penetrate these industrial vertical markets. PLM suppliers have all developed
industry specific market strategies that are focusing well beyond their historic,
discrete industry strengths and into the process and hybrid industries. Leveraging
advanced 3D modeling and simulation technologies, these PLM suppliers continue
to penetrate industries such as shipbuilding, energy & power, oil & gas, life
sciences, construction & architecture, retail, and even the fashion industry.“
Demographics, Environment, and Energy Will Define Growth Markets for
PLM
The changing demographics of both industrialized nations and the emerging
economic regions will drive significant portions of the market for technology and
the consumer demands for certain sectors of national, regional, and global
populations. This is creating a critical demand for knowledge capture across all
domains of the product lifecycle including design, manufacturing processes, and
general domain expertise. Moreover, knowledge reuse will be essential as
companies seek to maintain and improve their products and services, as well as
establish ideation and innovation as a component of their end-to-end product
development process.
PLM Trends: Design Communities, Virtual Retail, Convergence of PLM and
MES
107
A number of interesting trends have emerged that are supported by PLM
technologies. Design communities are emerging that will enable both professional
and non-professional designers to engage and exchange concepts and designs.
These communities would connect designers together to combine creativity,
innovation, and engineering. This could also involve consumers providing input
on product concepts, a “voice of the people” that connects designers and
consumers in a very preliminary concept phase.
PLM solutions are being adopted in business sectors such as CPG, consumer
goods, and retail. 3D modeling has reached states where entire virtual
environments can be created that represent not only products, but the stores and
retail outlets. Retailers will reach the consumer directly through a virtual world of
products and environments where the consumer can experience the product in 3D
and make instant purchase decisions.
The convergence of PLM and MES has been taking place for some time as
manufacturers realize the benefits of linking their production operations execution
data and completed records with PDM systems to validate their product design and
manufacturing processes with the as-built data from their production systems. PLM
providers are forging partnerships with, and in some cases making acquisitions of,
MES software suppliers.
1 Product Lifecycle Management Antti Saaksvuori and Anselmi Immonen,
springer 2005 2 http://en.wikipedia.org/wiki/Product_lifecycle_management
3 www.cimdata.com
4 PDM to PLM: Evolving to the Future, Amann K., COE Newsnet, luty 2004 r.
5 Model danych w technologicznym projektowaniu procesów wytwarzania i jego
integracja z systemami PDM, M. Cholewa,Instytut Technologii Maszyn i Automatyzacji Politechniki Wrocławskiej, praca doktorska, Wrocław, 2001 r.
6 Techniki komputerowe CAx w inżynierii produkcji, Chlebus: Wydawnictwo Naukowo-Techniczne, W-wa 2000.
7 Empowering the future of business, http://www.CIMdata.com, luty 2004
8 What is Product Data Management and Why Should J Care , Wiliamns C., http://www.pdmic.com.
108
9 http://www.product-lifecycle-management.com 10 The product data management market; B.Gott, World Class Design to
Manufacture vol.2 no.4 1999 s.18-20
11 Workflow Management Coalition Glossary, przekład własny
12 Michael Zur Muehlen, „Workflow – based Process Controlling”, Logos Publishers 2004 13 Understanding Product Data Management, http://pdmic.com.
14 Product Lifecycle Management: Driving the ?ext Generation of Lean Thinking,
Michael Grieves, McGraw-Hill, October 26, 2005
15 http://vetman.itma.pwr.wroc.pl/mod/lesson/view.php?id=277
16 http://www.prostep.org/en - zasoby sieci internet
17 Techniki komputerowe CAx w inżynierii produkcji, Chlebus E., Wydawnictwo Naukowo-Techniczne, Warszawa 2000.
18 http://strategis.gc.ca - zasoby sieci Internet, maj 2005
19 Economic Impact Assessment of the International Standard for the Exchange of Product Model Data (STEP) in Transportation Equipment Industries, Phelps T., Gallaher M., O’Connor A., http://www.uspro.org, December 2002.
20 STEP jako integrator procesu wytwarzania, Chlebus E., Kozera M., http://www.cadcamforum.pl
21 6th ProSTEP Benchmark Part2: PDM Data Exchange, http://www.prostep.org/en.
22 Systemy i integracja automatyzacji przemysłowej. Reprezentacja i wymiana danych o produktach. Metody opisu: Podręcznik języka Express. Norma PN-ISO 10303-11:2002,
23 USAGE Guide for the STEP PDM Schema V1.2 Release 4.3, PDM Implementor Forum, http://www.pdm-if.org, styczeń 2002.
24 PDTnet – product data technology network, Sachers M., ProduktDaten Journal, nr. 2/2001.
25 PDTnet – product data technology network, Sachers M., ProduktDaten Journal, nr. 2/2001.
26 http://www.johnstark.com/, May 2006
27 http://www.wtgnews.com/2010/09/plm-market-makes-strong-rebound-in-first-half-of-2010
109