
Preparatory study on Smart Applianceseco-smartappliances.eu › sites › ecosmartappliances... ·...
52
Preparatory study on Smart Appliances Task 2 Economic and market analysis VITO: Dominic Ectors, Helena Gerard, Sarah Bogaert & Koen Vanthournout Armines: Marcel Perret-Gentil & Philippe Rivière Rheinische Friedrich-Wilhelms-Universität Bonn: Jasmin Geppert & Prof. Rainer Stamminger Viegand Maagøe A/S: Jan Viegand Wuppertal Institut: Thomas Götz Project management: Sarah Bogaert Study accomplished under the authority of the European Commission DG Energy under framework contract ENER.C3.2012-418-lot 1 2014/TEM/R/ Task 2 report Version: 20 May 2016
Transcript of Preparatory study on Smart Applianceseco-smartappliances.eu › sites › ecosmartappliances... ·...
Preparatory study on Smart Appliances
Task 2 Economic and market analysis
VITO: Dominic Ectors, Helena Gerard, Sarah Bogaert & Koen Vanthournout Armines: Marcel Perret-Gentil & Philippe Rivière Rheinische Friedrich-Wilhelms-Universität Bonn: Jasmin Geppert & Prof. Rainer Stamminger Viegand Maagøe A/S: Jan Viegand Wuppertal Institut: Thomas Götz Project management: Sarah Bogaert
Study accomplished under the authority of the European Commission DG Energy under framework contract ENER.C3.2012-418-lot 1 2014/TEM/R/ Task 2 report Version: 20 May 2016

The information and views set out in this study are those of the author(s) and do not necessarily reflect the opinion of the European Commission. The Commission does not guarantee the accuracy of the data included in this study. Neither the Commission nor any person acting on the Commission’s behalf may be held responsible for the use which may be made of the information contained therein. This report has been prepared by the authors to the best of their ability and knowledge. The authors do not assume liability for any damage, material or immaterial, that may arise from the use of the report or the information contained therein. All rights, amongst which the copyright, on the materials described in this document rest with the Flemish Institute for Technological Research NV (“VITO”), Boeretang 200, BE-2400 Mol, Register of Legal Entities VAT BE 0244.195.916.
Table of Contents
III
TABLE OF CONTENTS
Table of Contents _______________________________________________________________ III
List of Figures __________________________________________________________________ IV
List of Tables ____________________________________________________________________ V
List of Acronyms ________________________________________________________________ VI
TASK 2 Economic and market analysis ______________________________________________ 1
2.1. Market trends 1 2.1.1. Trends in the field of smart appliances / smart home devices __________________ 2 2.1.2. Trends in the field of energy management systems __________________________ 7 2.1.3. Trends in the field of smart homes _______________________________________ 7 2.1.4. Trends/status of smart meters __________________________________________ 9 Trend: traditional roles will change _____________________________________________ 12 2.1.5. Emerging business models related to the Internet of Things __________________ 12 2.1.6. Conclusions ________________________________________________________ 13
2.2. Current stock of appliances and estimation of share of smart appliances 14 2.2.1. Periodical appliances _________________________________________________ 14 3.1.1. Continuous appliances _______________________________________________ 17 3.1.2. Behavioural appliances _______________________________________________ 19 3.1.3. HVAC _____________________________________________________________ 21 Battery operated rechargeable appliances ________________________________________ 31 3.1.4. Residential energy storage systems _____________________________________ 31 3.1.5. Lighting ___________________________________________________________ 32
3.2. Economic instruments - remuneration mechanisms 32 3.2.1. Use cases __________________________________________________________ 33 3.2.2. Overview of remuneration mechanisms __________________________________ 35 3.2.3. Examples of existing (DR) practices _____________________________________ 37 3.2.4. Factors for the establishment of a successful DR remuneration mechanism _____ 40
List of references _______________________________________________________________ 42
IV
LIST OF FIGURES
Figure 1 World market for smart connected major home appliances – Unit shipments (Mn) by share and region (2014 & 2020) - source IHS ......................................................................................... 3
Figure 2 World market for smart connected major home appliances – Unit shipments and CAGR, split by appliance type - source IHS .............................................................................................. 3
Figure 3: Global connected-home device shipments ........................................................................... 4 Figure 4: Smart Home Adoption Curve (source: BI Intelligence).......................................................... 5 Figure 5: Deployment of smart electricity meters in EU Member States by 2020............................. 10 Figure 7 Business models related to IoT (source: Capgemini Consulting) ......................................... 13 Figure 8: Temperature sensitivity of electricity consumption in France in 2013 - daily average
electricity consumption VS smoother average France temperature and slope, from (RTE, 2013) .................................................................................................................................................... 23
Figure 9: Temperature sensitivity of electricity consumption in France and other countries in Europe in 2012, from (RTE, 2012) .............................................................................................. 24
Figure 10: Stock of ventilation units in the EU 1990-2010 and projections 2010-2025 (BAU, source: preparatory studies), from (EU, 2014) ....................................................................................... 25
Figure 11: Mechanical ventilation, EU electricity consumption 1990-2010 and projections 2010-2025 (BaU) in TWh electricity per year (EU, 2014) ..................................................................... 25
List of Tables
V
LIST OF TABLES
Table 1: Installed units of dishwashers in 2010 (reference) and 2015, 2020, 2030 (estimates) ....... 15 Table 2: Installed units of washing machines in 2010 (reference) and 2015, 2020, 2030 (estimates)
.................................................................................................................................................... 15 Table 3: Installed units of tumble dryers in 2010 (reference) and 2015, 2020, 2030 (estimates) .... 16 Table 4: Installed units of washer-dryers in 2010 (reference) and 2015, 2020, 2030 (estimates) .... 17 Table 5: Installed units of household refrigerators and freezers in 2010 (reference) and 2015, 2020,
2030 (estimates) ........................................................................................................................ 18 Table 6: Installed units of commercial refrigerators and freezers in 2010 (reference) and 2015,
2020, 2030 (estimates)............................................................................................................... 18 Table 7: Installed units of water heaters in 2010 (reference) and 2015, 2020, 2030 (estimates)..... 19 Table 8: Installed units of electrical hobs in 2010 (reference) and 2015, 2020, 2030 (estimates) .... 19 Table 9: Installed units of electrical ovens in 2010 (reference) and 2015, 2020, 2030 (estimates) .. 20 Table 10: Installed units of range hoods in 2010 (reference) and 2015, 2020, 2030 (estimates) ..... 20 Table 11: Installed units of vacuum cleaners in 2010 (reference) and 2015, 2020, 2030 (estimates)
.................................................................................................................................................... 20 Table 12: Electric heater units, power installed and consumption, Source: (BIOIS, 2012)............... 21 Table 13: Electric heating units, installed power, summary table ..................................................... 22 Table 14: EU stock of air conditioning systems in GW of cooling capacity, source (Rivière, 2007) and
(Rivière, 2012) ............................................................................................................................ 26 Table 15: Total sales of Air conditioners by the Japanese Refrigeration and Air conditioning industry
(2014) ......................................................................................................................................... 28 Table 16: Estimation of installed base of smart enabled heat pumps ............................................... 29
VI
LIST OF ACRONYMS
AC Air Conditioning
ADSL Asymmetric Digital Subscriber Line
BACS Building Automation and Control System
BAT Best Available Technology
BAU Business As Usual
BEMS Building Energy Management System
BRP Balancing Responsible Parties
CBA Cost-Benefit Analysis
CEMS Customer Energy Management System
CF Commercial refrigeration products
CFL compact fluorescent light
CHP Combined Heat and Power
DHW Domestic Hot Water
DOCSIS Data Over Cable Service Interface Specification
DR Demand response
DSF Demand side flexibility
DSO Distribution System Operators
EMS Energy Management System
ETSI European Telecommunications Standards Institute
EV Electric vehicle
FRC Frequency Containment Reserves (or currently called primary reserves)
FRRa automated Frequency Restoration Reserves (or currently called secondary reserves). FRRa is activated automatically
FRRm manual Frequency Restoration Reserves (or currently called secondary reserves). FRRm is activated manually
GLS general lighting service 'incandescent'
GSM Global System for Mobile Communications
GW Gigawatt
HEG Home Energy Gateway
HEMS Home Energy Management System
HID high intensity discharge lamp
HVAC Heating, Ventilation and Air Conditioning
LED light emitting diode
LFL linear fluorescent lamp
LTE 3GPP Long Term Evolution (4G)
M2M Machine to Machine
NRVU Non-Residential Ventilation Units
PLC power line communication
PV Photovoltaic
RES Renewable Energy Sources
RTE Transmission network - Réseau de transport d'électricité
RVU Residential Ventilation Units
SAREF Smart Appliances REFerence ontology

List of Acronyms
VII
SOC State Of Charge
TD Tumble dryer
TSO Transmission System Operators
TWh TeraWatt hour
UMTS Universal Mobile Telecommunications System
UPS Uninterruptible power supply
VDSL Very-high-bitrate Digital Subscriber Line
VRF variable refrigerant flow

Task 2 report – Economic and Market Analysis
1
TASK 2 ECONOMIC AND MARKET ANALYSIS
The objective of Task 2 consists of the assessment of the stock of smart appliances defined in Task 1 within the EU28. An analysis has been made of current trends regarding the general Internet of Things market and more specifically the market for smart home and smart appliances. Although market reports give a good picture of general tendencies regarding the current and future supply of smart appliances, it was not possible to derive ‘smart’ shares of individual appliances for the various categories. Smart appliances as defined in this study have not yet (fully) seized the market and no figures are available specifically for this subcategory of ‘smart’ appliances. Therefore, the current stock data for all appliances - including non-communication/communication enabled and non-DR/DR enabled appliances – is given as a starting point. Expert judgment estimations have been made per appliance type of the current share of DR enabled stock as well as predictions for 2020 and 2030. In this Task report an overview is also given of the various types of economic instruments/remuneration mechanisms that could be used to pass the value of flexibility provided by smart appliances on to the end-user. These remuneration mechanisms can provide incentives in order to use more of the flexibility potential and will be combined with the modelling in Task 5.
2.1. MARKET TRENDS
This section describes a number of market trends regarding the general Internet of Things market and more specifically the market for smart home and smart appliances.
Important note: the term ‘smart’ appliance in this specific section does not stand for a ‘DR-enabled’ appliance, but reflects the terms used in the market reports that are referred to. The market research reports use different terminology and categories to classify ‘smart’ appliances or devices1, which makes it difficult to compare figures and trends. The reports mentioned in this section use the term ‘smart‘ to indicate communication-enabled or ‘connected’ appliances or devices. Most of these ‘smart‘ appliances or devices come with a smartphone or tablet app, which is indicated as ‘app-enabled’. Only some of the ‘smart’ appliances or devices mentioned provide functionality to enable DR in 2015. Smart homes are sometimes classified as homes with at least one smart device/appliance, or as whole-home multi-function smart homes (based on a traditional home automation system or on an integrated solution of smart devices).
1 Devices are a broader term compared to appliances and can also include safety and security systems
(internet-connected sensors, monitors, cameras and alarm systems) and energy equipment like smart thermostats.
Task 2 report – Economic and Market Analysis
2
2.1.1. TRENDS IN THE FIELD OF SMART APPLIANCES / SMART HOME DEVICES
Several appliance manufacturers offer smart appliance lines in 2015. IFA (Internationale Funkausstellung) 2015 in Berlin, the global trade show for consumer electronics and home appliances, presented in September 2015 the latest products and innovations and is a unique opportunity to have an overview on the trends in consumer electronics. Smart homes and smart appliances were very prevalent at this years’ trade show2. Examples of demonstrated available smart home appliances are e.g. the GE WiFi Connect, Hoover Wizard smart appliances range, Candy simply|Fi appliances, Haier’s Intelius 2.0 lineup, Grundig’s HomeWhiz appliances, Whirplool’s 6TH Sense Live range, Bauknecht (Whirlpool Group) appliances controlled with BLive app, Electrolux, LG, Miele’s EditionConn@ct and Miele@Home appliances, and others. Samsung announced to bring all their devices within the IoT ecosystem by 2020. Most appliance manufacturers offer since this year a commercial product line of smart appliances, with a focus on dishwashers, washing machines, washer-dryers and refrigeration products. Other types of smart appliances commercially available in 2015 (or announced) are: the smart coffee machine, the smart robot vacuum cleaner, the smart toothbrush, the smart garden sprinkler, the smart hood, the smart hob or the smart oven. Some smart appliances are designed in such a way that they can communicate information directly to the service operator. Some of these appliances have the ability to measure and control their energy usage. Promoting the added value of smart appliances towards customers is done by emphasizing the extra comfort (like remote control or status notifications via an app) and energy management functions. For instance Hoover's app monitors each product’s energy consumption (energy management function) and can send updates and alerts, e.g. when the dishwasher needs more rinse aid or that the fridge’s temperature is rising (comfort function). The global consumer industry of smart appliances’ overall turnover is forecasted to grow by 14% this year, from €783bn in 2014 to €891bn3 in 2015. The next subsections list several market research reports which give forecasts on the expected evolution of turnover of smart appliances and smart home devices.
Source: IHS Technology 2.1.1.1.
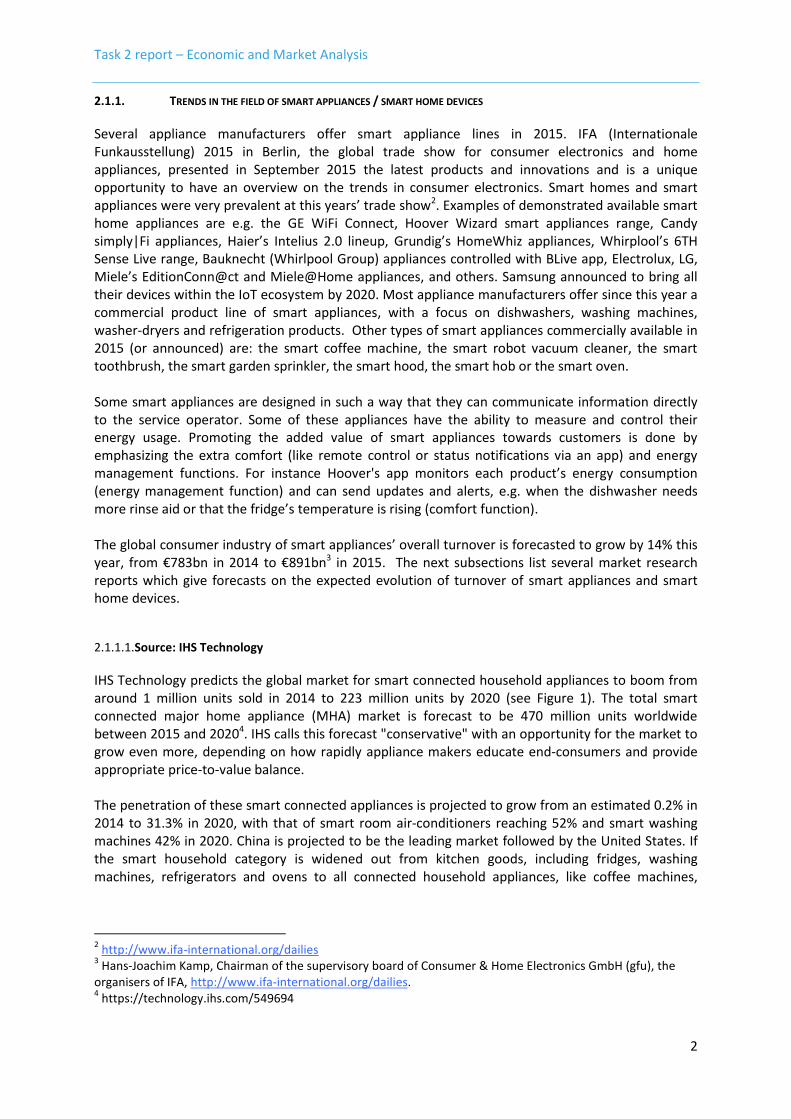
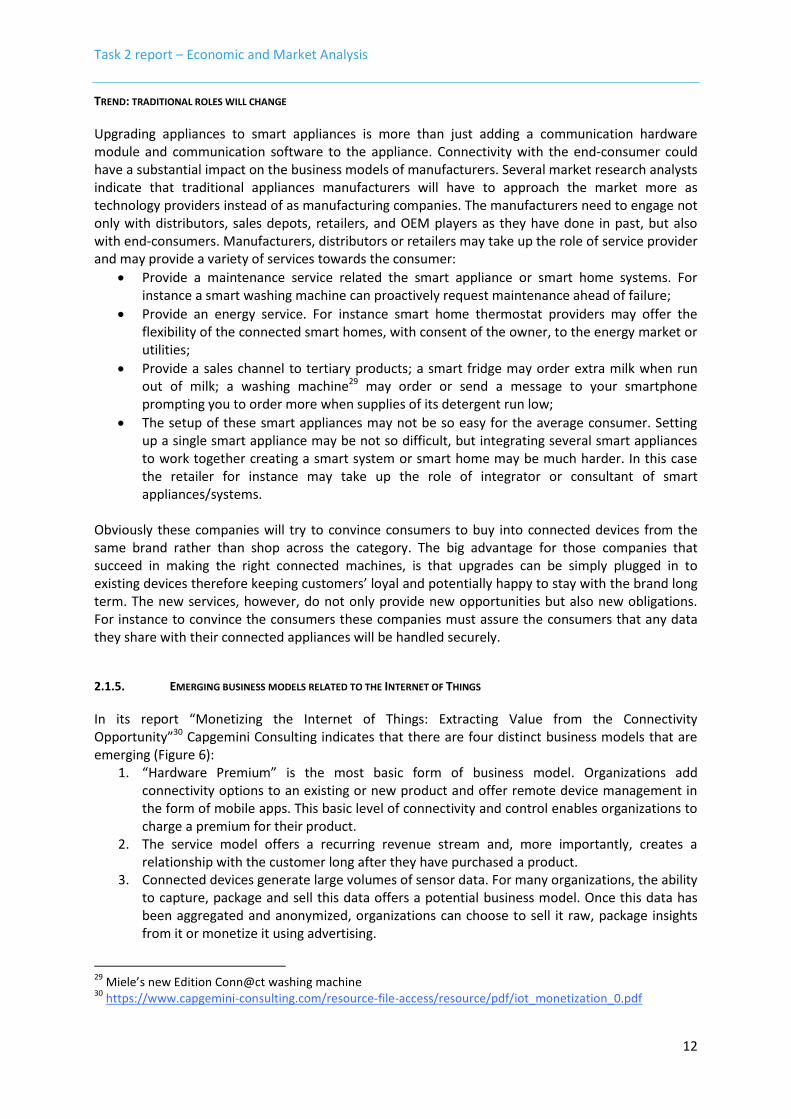
IHS Technology predicts the global market for smart connected household appliances to boom from around 1 million units sold in 2014 to 223 million units by 2020 (see Figure 1). The total smart connected major home appliance (MHA) market is forecast to be 470 million units worldwide between 2015 and 20204. IHS calls this forecast "conservative" with an opportunity for the market to grow even more, depending on how rapidly appliance makers educate end-consumers and provide appropriate price-to-value balance. The penetration of these smart connected appliances is projected to grow from an estimated 0.2% in 2014 to 31.3% in 2020, with that of smart room air-conditioners reaching 52% and smart washing machines 42% in 2020. China is projected to be the leading market followed by the United States. If the smart household category is widened out from kitchen goods, including fridges, washing machines, refrigerators and ovens to all connected household appliances, like coffee machines,
2 http://www.ifa-international.org/dailies
3 Hans-Joachim Kamp, Chairman of the supervisory board of Consumer & Home Electronics GmbH (gfu), the
organisers of IFA, http://www.ifa-international.org/dailies. 4 https://technology.ihs.com/549694
Task 2 report – Economic and Market Analysis
3
robotic vacuums, rice cookers, microwave ovens, air purifiers, and electric toothbrushes, then the market could stretch to 700 million appliances by 20205.
Figure 1 World market for smart connected major home appliances – Unit shipments (Mn) by share and region (2014 & 2020) - source IHS6
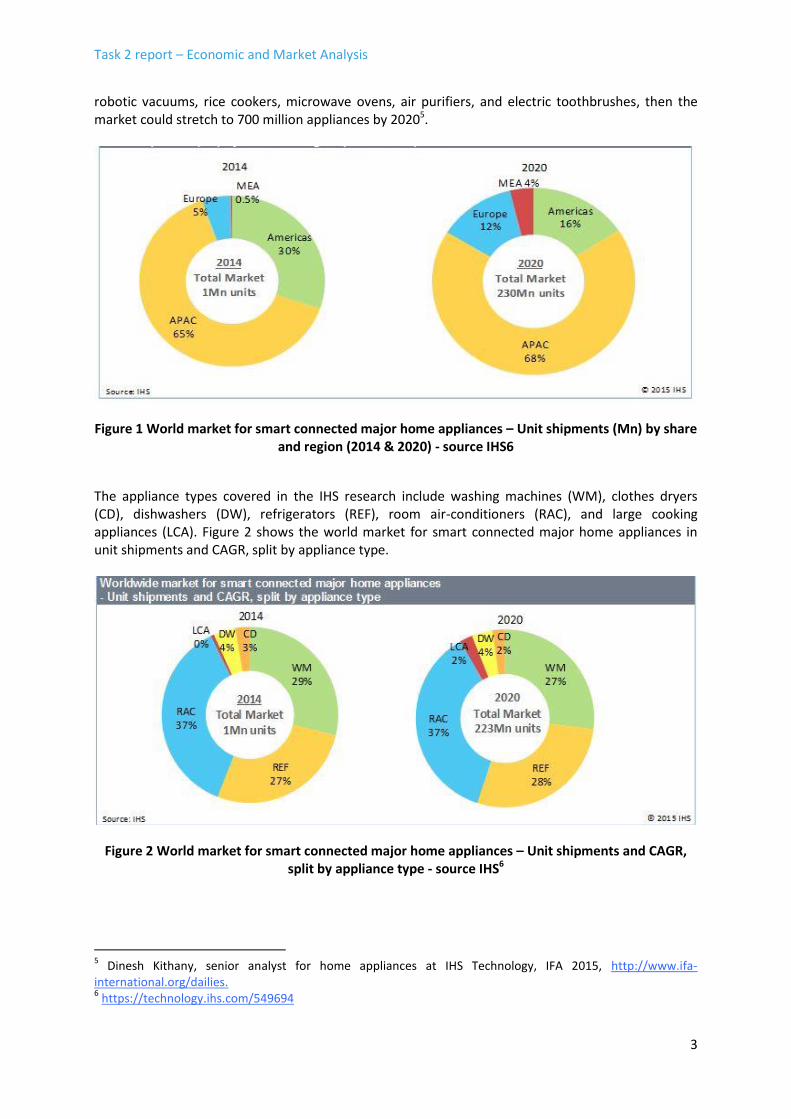
The appliance types covered in the IHS research include washing machines (WM), clothes dryers (CD), dishwashers (DW), refrigerators (REF), room air-conditioners (RAC), and large cooking appliances (LCA). Figure 2 shows the world market for smart connected major home appliances in unit shipments and CAGR, split by appliance type.
Figure 2 World market for smart connected major home appliances – Unit shipments and CAGR, split by appliance type - source IHS6
5 Dinesh Kithany, senior analyst for home appliances at IHS Technology, IFA 2015, http://www.ifa-
international.org/dailies. 6 https://technology.ihs.com/549694
Task 2 report – Economic and Market Analysis
4
IHS cites the following reasons for this trend:
Over the last decade consumers have evolved and quickly adopted new technology products thanks to the higher adoption of smartphones, familiarity with touch controls, the world of apps, and access to the internet.
As smart appliances are expected to be more energy-efficient than their traditional counterparts, there is a push by governments and regulatory authorities to support and develop this trend7.
Many appliance makers are shifting focus from the low-profit, low growth traditional ‘non smart’ segment toward the high-margin, revenue oriented smart appliance segment.
Source: BI Intelligence (Global) 8 2.1.1.2.
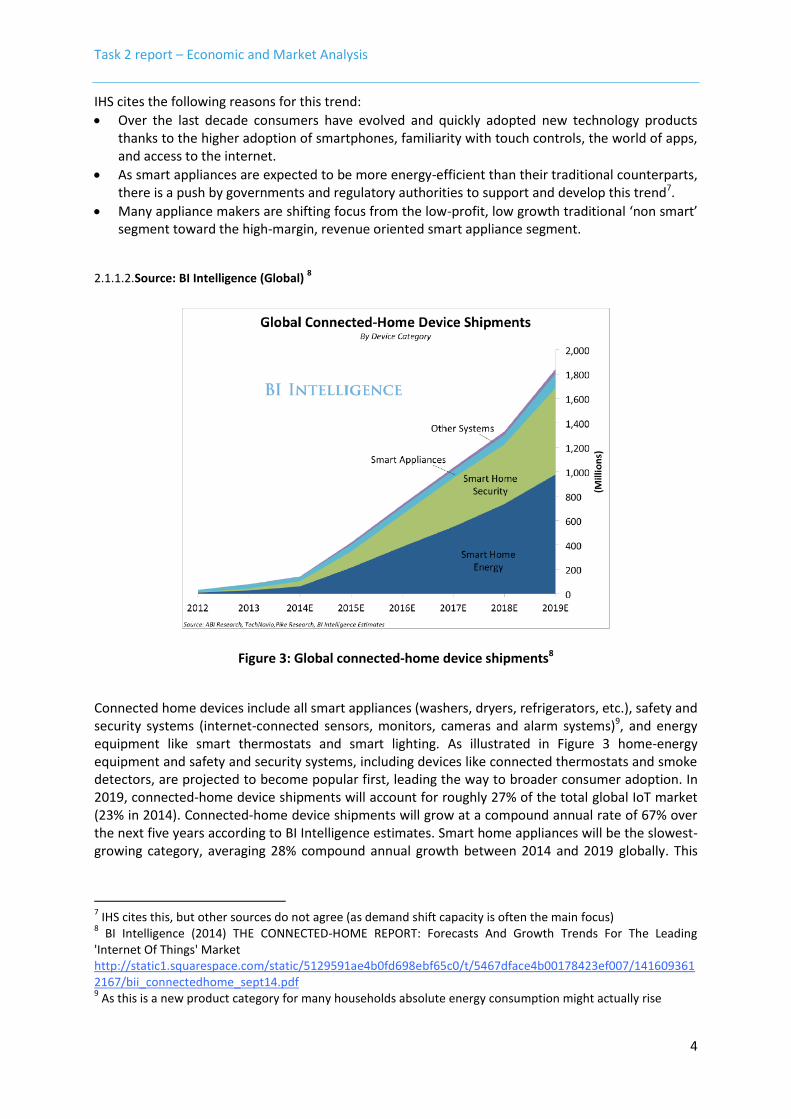
Figure 3: Global connected-home device shipments8
Connected home devices include all smart appliances (washers, dryers, refrigerators, etc.), safety and security systems (internet-connected sensors, monitors, cameras and alarm systems)9, and energy equipment like smart thermostats and smart lighting. As illustrated in Figure 3 home-energy equipment and safety and security systems, including devices like connected thermostats and smoke detectors, are projected to become popular first, leading the way to broader consumer adoption. In 2019, connected-home device shipments will account for roughly 27% of the total global IoT market (23% in 2014). Connected-home device shipments will grow at a compound annual rate of 67% over the next five years according to BI Intelligence estimates. Smart home appliances will be the slowest-growing category, averaging 28% compound annual growth between 2014 and 2019 globally. This
7 IHS cites this, but other sources do not agree (as demand shift capacity is often the main focus)
8 BI Intelligence (2014) THE CONNECTED-HOME REPORT: Forecasts And Growth Trends For The Leading
'Internet Of Things' Market http://static1.squarespace.com/static/5129591ae4b0fd698ebf65c0/t/5467dface4b00178423ef007/1416093612167/bii_connectedhome_sept14.pdf 9 As this is a new product category for many households absolute energy consumption might actually rise
Task 2 report – Economic and Market Analysis
5
category includes products like smart refrigerators, smart washers and dryers and smart dishwashers. As prices decline over the long run and consumers become more familiar with connected-home devices overall, the smart appliances’ growth is expected to accelerate.
Source: BI Intelligence US smart home market report 2.1.1.3.
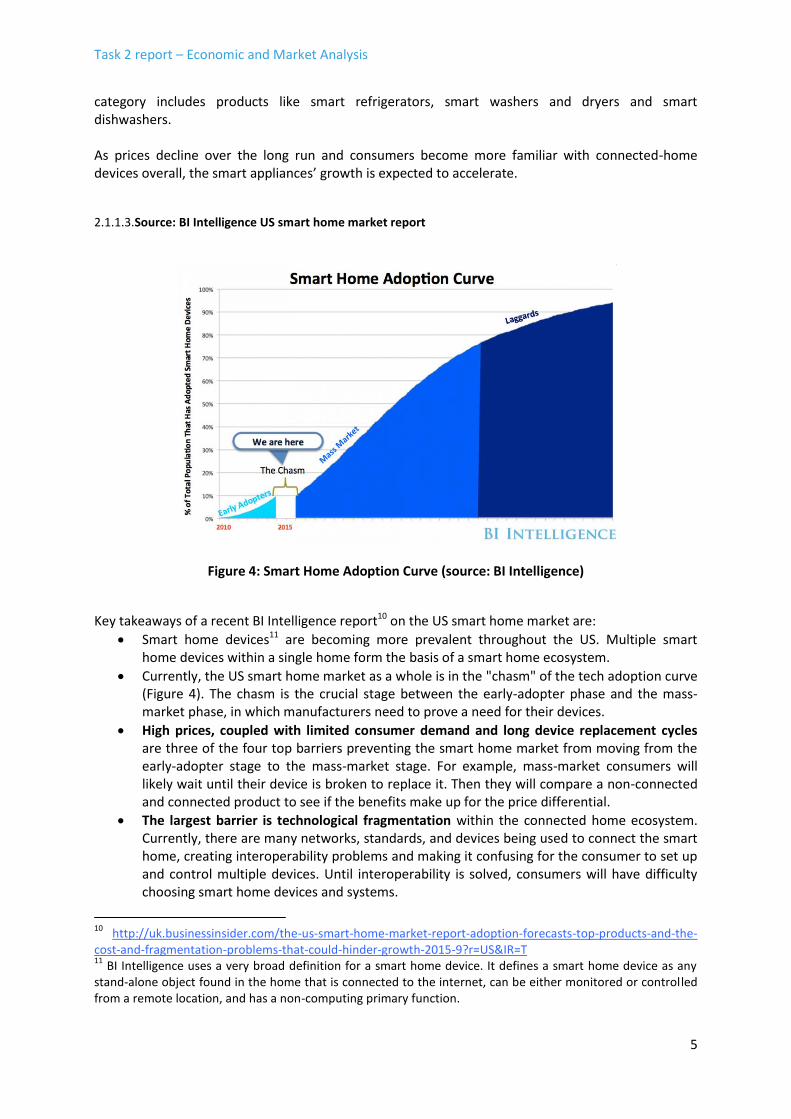
Figure 4: Smart Home Adoption Curve (source: BI Intelligence)
Key takeaways of a recent BI Intelligence report10 on the US smart home market are:
Smart home devices11 are becoming more prevalent throughout the US. Multiple smart home devices within a single home form the basis of a smart home ecosystem.
Currently, the US smart home market as a whole is in the "chasm" of the tech adoption curve (Figure 4). The chasm is the crucial stage between the early-adopter phase and the mass-market phase, in which manufacturers need to prove a need for their devices.
High prices, coupled with limited consumer demand and long device replacement cycles are three of the four top barriers preventing the smart home market from moving from the early-adopter stage to the mass-market stage. For example, mass-market consumers will likely wait until their device is broken to replace it. Then they will compare a non-connected and connected product to see if the benefits make up for the price differential.
The largest barrier is technological fragmentation within the connected home ecosystem. Currently, there are many networks, standards, and devices being used to connect the smart home, creating interoperability problems and making it confusing for the consumer to set up and control multiple devices. Until interoperability is solved, consumers will have difficulty choosing smart home devices and systems.
10
http://uk.businessinsider.com/the-us-smart-home-market-report-adoption-forecasts-top-products-and-the-cost-and-fragmentation-problems-that-could-hinder-growth-2015-9?r=US&IR=T 11
BI Intelligence uses a very broad definition for a smart home device. It defines a smart home device as any stand-alone object found in the home that is connected to the internet, can be either monitored or controlled from a remote location, and has a non-computing primary function.
Task 2 report – Economic and Market Analysis
6
"Closed ecosystems" are the short-term solution to technological fragmentation. Closed ecosystems are composed of devices that are compatible with each other and which can be controlled through a single point.
Source: Research and Markets: global forecast to 202012
2.1.1.4.
The smart appliances market is witnessing rapid growth. It is expected to reach $37.2 Billion by 2020, and grow at a CAGR of 15.4% between 2015 and 2020. In the smart appliances ecosystem, smart home (Washer, Dryer, Air Conditioner, Vacuum Cleaner) and smart kitchen appliances (Refrigerator, Dishwasher, Freezer) play a vital role. The market for smart home appliances was valued at $7.7 Billion in 2014 and it is expected to grow at a CAGR of 16.8% between 2015 and 2020. Smart washers and smart dryers accounted for a large market share, however the market for smart air conditioners is expected to grow at a high CAGR between 2015 and 2020.
Source: Deutsche Telekom & Strategy Analytics13
2.1.1.5.
Consumer spending on smart home products and services will hit €90.90 billion globally by 2018 and accelerate from there to €122.77 billion by 2020. Fewer than 25% of homes with broadband connections will have acquired any of these products and services by this time. Strategy Analytics claims that the home market in the EU could be worth over €15.46 billion annually by 2019, with 50 million Western European homes having installed IoT technology.
Source: Frost & Sullivan: Analysis of the European Smart Thermostats Market14
2.1.1.6.
This analysis from Frost & Sullivan finds that the EU market for smart thermostats earned revenues of $152.5 million in 2014 and estimates this to rocket up to $2,570.6 million in 2019 (more than 15 times the 2014 level). The United Kingdom, Germany and the Netherlands are projected to account for a lion’s share of the market in Europe, while France will be the fastest growing. The report emphasizes that energy utility companies are critical value chain partners for the smart thermostat vendors. Capitalising on their highly convenient and reliable sales channel will facilitate access to the mass customer market in Europe.
Source: Berg Insight: Smart thermostats15
2.1.1.7.
Compared to 2013, sales of smart thermostats in Europe in 2014 rose by 96% increase for a total of 0.7 million units. Berg Insight forecasts that the number of homes with smart thermostats in Europe and North America will grow at a compound annual growth rate of 64.2% during the next five years to reach 38.2 million units in 2019. North America will remain the largest market at the end of the forecast period, with 24.6 million homes having smart thermostats, whereas the installed base in Europe is expected to reach 13.6 million homes by 2019.
12
http://www.researchandmarkets.com/research/zcsgb8/smart_appliances 13
http://connectedhomeplatform.telekom.net/wp-content/uploads/Telekom_Market_Analysis_Report-How_to_create_Growth_from_the_Connected_Home.pdf 14
http://www.frost.com/sublib/display-report.do?id=MB01-01-00-00-00&bdata=aHR0cDovL3d3Mi5mcm9zdC5jb20vbmV3cy9wcmVzcy1yZWxlYXNlcy9zbWFydC10aGVybW9zdGF0cy1tYXJrZXQtcm9ja2V0LTI1LWJpbGxpb24tNS15ZWFycy1wcmVkaWN0cy1mcm9zdC1zdWxsaXZhbi9AfkBCYWNrQH5AMTQ0NjU2ODE1NDU5MA%3D%3D 15
http://www.berginsight.com/ReportPDF/ProductSheet/bi-sh3-ps.pdf
Task 2 report – Economic and Market Analysis
7
Consumers embrace smart thermostats primarily due to the potential for energy savings, increased comfort and convenience. For energy companies, they open up new possibilities to introduce consumer-friendly demand response and energy efficiency programmes. In 2014 and 2015 several partnerships were announced in the EU between energy service providers and smart thermostat manufacturers16. Berg believes that smart thermostats represent a particularly attractive opportunity in the smart home market, as they appeal to consumers, energy companies and HVAC (heating, ventilation and air conditioning) service providers alike.
Important note: the term ‘smart’ appliance in section 2.1 does not stand for a ‘DSF-enabled’ appliance, but reflects the terms used in the market reports that are referred to.
2.1.2. TRENDS IN THE FIELD OF ENERGY MANAGEMENT SYSTEMS
The report “The scope for energy and CO2 savings in the EU through the use of building automation technology”17 projects the penetration of modern Building Automation Technology (BAT) and management systems to rise from 26% of all service sector floor area in 2014 to 40% by 2028 (BAU, without further policy intervention). In the residential sector, penetration of Home Energy management Systems (HEMS18) is projected to rise from 2% of homes today to 40% by 2034 without additional intervention.
2.1.3. TRENDS IN THE FIELD OF SMART HOMES
Smart home solutions have been on the market for several years and yet, for a variety of reasons, have not yet found mass acceptance. Many of the solutions may have been simply too expensive, or have not yet reached full maturity. Over the last few years, industry has made considerable efforts to develop new, cheaper technologies and to keep on improving existing solutions, including numerous communications protocol. Thanks to all the hype surrounding the IoT in 2014 and 2015, the smart home has also achieved much greater visibility among the general public. Home automation is not the only way to create smart homes. Other players on the market are offering different solutions. A trend now is that smart homes are built more organically by gradually adding connected devices. As a result, more connected home appliances will be introduced and some of them will be DSF-enabled. 16
Some examples: The North American smart thermostat market is led by Nest, Honeywell and Ecobee. In Europe, the leading smart thermostat vendor is eQ-3, whose smartphone-controlled radiator thermostats have been installed in more than 300,000 homes. Other successful initiatives include the smart thermostat solutions offered by the energy companies British Gas in the UK and Eneco in the Netherlands. British Gas’ Hive solution had approximately 140,000 users at the end of 2014, whereas Eneco had signed up around 100,000 users for its Toon solution. (In the UK) Google-owned Nest is being offered to Npower’s customers, Berlin-based startup Tado has teamed up with SSE, Climote is working with Scottish Power, and French startup Netatmo recently partnered with EDF Energy. 17
The scope for energy and CO2 savings in the EU through the use of building automation technology, Second edition, 13 June 2014, Waide Strategic Efficiency Limited, http://www.leonardo-energy.org/sites/leonardo-energy/files/documents-and-links/scope_for_energy_and_co2_savings_in_eu_through_ba_2nd_ed_2014-06-13.pdf 18
HEMS, CEMS (Customer Energy Management System), BEMS (Building Energy Management System) and EMS are commonly used in literature to indicate energy management systems.
Task 2 report – Economic and Market Analysis
8
In 2015 the smart home has established itself as one of the leading markets in the IoT, as a variety of studies indicate, including those by Berg Insight19 and BITKOM. According to Berg Insight, the European market for smart home systems is still in an early stage and 2–3 years behind North America in terms of penetration and market maturity. At the end of 2014, a total of 3.3 million smart home systems were in use in the EU28+2 countries, up from 1.75 million in the previous year. Around 0.34 million of these systems were multifunction i.e. whole-home systems whereas 2.93 million were point solutions of smart devices. This corresponds to around 2.7 million smart homes when overlaps are taken into account (some homes have more than one smart system), meaning that 1.2% of all households in this region were smart at the end of 2014. Berg Insight expects that by 2017 there will be 17.4 million smart home systems installed in European homes, bringing in projected sales of 2.6 billion euros. The number of European households that have adopted smart home systems is forecasted to grow at a compound annual growth rate (CAGR) of 61% during the next five years, resulting in 29.7 million smart homes by 2019. Market revenues grew by 60% compared to 2013 to € 0.77 billion in 2014. The market is forecasted to grow at a CAGR of 58% between 2014 and 2019 to reach € 7.6 billion at the end of the forecast period. A point solution will in most cases constitute the consumer’s first smart home purchase. In fact, point solutions outsold whole-home systems in 2014 by a factor of six to one and generated 59% of the combined market revenues in North America and Europe. The most successful point solutions to date include smart thermostats, security systems, smart light bulbs, network cameras and multi-room audio systems. According to the BITKOM Connected Home Working Group20 by 2020 there could be as many as 1.5 million smart home households in Germany. According to Argus Insights, home automation was experiencing robust growth in 2014, however data show that as of May 2015 consumer demand for connected home devices experienced a 15% drop below the level of a year ago, a sign that consumer interest may be stagnating21.
19
http://www.berginsight.com/ReportPDF/ProductSheet/bi-sh1-ps.pdf 20
http://www.bitkom.org ; http://blog.bosch-si.com/categories/technology/2015/07/here-to-stay-the-smart-home-needs-standards/ 21
Source: Argus Insights (2015), http://www.argusinsights.com/connected-home-release
Task 2 report – Economic and Market Analysis
9
In the past the home automation industry was the only player to provide smart home functionality; but in 2015 several market actors are lining up to take a share of the smart home market:
Telecommunication providers already have a platform at the customers’ home, via the broadband router and are very well positioned to enhance this platform towards a smart home platform (E.g. Qivicon product range offered by Deutsche Telecom; in the US Cable TV, Internet & Phone provider Comcast Corporation steps into the smart home market);
Energy providers are providing smart thermostats and energy boxes22 to their customers to reinforce the customer-energy provider binding in a liberalized energy market. Some energy providers offer complete smart home solutions (E.g. RWE Smart Home products, Eneco’s Toon thermostat, Eni’s Anna thermostat);
In the US, the home security industry is broadening their scope from alarm to smart home offerings. At the base, consumers value safety, but several consumer segments value energy management, especially when bundled with security and safety offerings (see Task 3);
The traditional home automation industry, previously targeting the high-end market segment, are now offering slimmed down solutions for the middle-end market segment;
The consumer industry, and especially some dominant and innovative actors like Google/Nest, Apple and Samsung are offering products or platforms for the smart home. These offerings may tie the customer to a particular ecosystem23.
Regarding the path to the connected home, the Deutsche Telekom published the following conclusions in the 'How To Create Growth From The Connected Home' report13:
1. Connected devices will transform our homes over the next decade; 2. The market will be worth billions of euros; 3. The threat of disintermediation is very real with innovative players set to enter the home
from adjacent markets; 4. Major players need to ‘step up to the plate’ in order to drive growth from IoT; 5. To engage consumers, focus on meeting their real needs; 6. The ultimate value for service providers, retailers and manufacturers will be in services; 7. The market is not homogeneous, it is distinct and regional and segment needs must be met; 8. Create a win-win relationship with partners; 9. No one standard will meet the entire needs of the market, and hence an open architecture
will be a prerequisite; 10. Platforms that support multiple use cases will be the only ones that succeed.
2.1.4. TRENDS/STATUS OF SMART METERS
EC Benchmarking Report (2014) 2.1.4.1.
The Commission Benchmarking Report (201424) reflected on progress in the roll-out of smart metering across the EU and found a mixed picture (see Error! Reference source not found.). Three Member States were advanced in their roll-out plans (Finland, Italy, Sweden), installing close to 45 million meters. Another thirteen Member States declared their intention to proceed with large-scale
22
Energy box is a popular name for home energy management systems (HEMS). Note however that the energy manager is a logic function, not necessarily a physical device. 23
For instance a customer may decide not to buy a certain DSF-enabled appliance because it cannot be integrated in a particular ecosystem at home. And the manufacturer of that particular ecosystem may decide DSF-capability is not important for its revenue. 24
Benchmarking smart metering deployment in the EU-27 with a focus on electricity, COM(2014) 356 final, http://eur-lex.europa.eu/legal-content/EN/TXT/PDF/?uri=CELEX:52014DC0356&from=EN
Task 2 report – Economic and Market Analysis
10
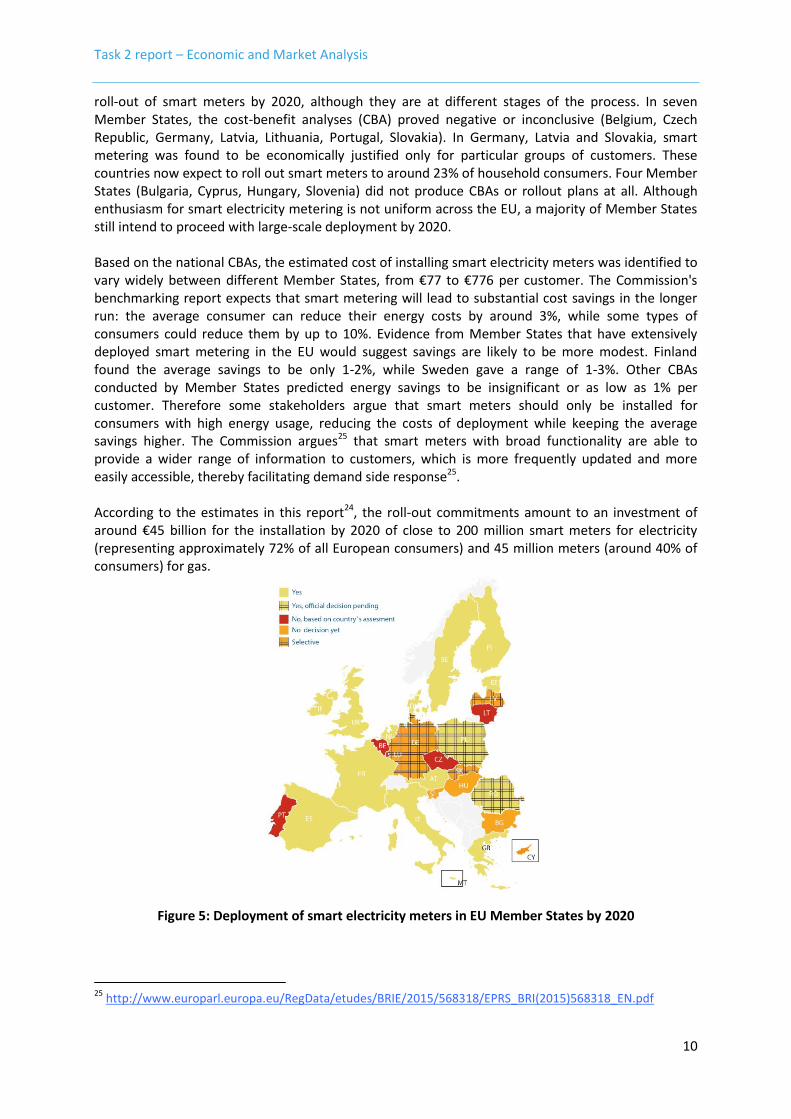
roll-out of smart meters by 2020, although they are at different stages of the process. In seven Member States, the cost-benefit analyses (CBA) proved negative or inconclusive (Belgium, Czech Republic, Germany, Latvia, Lithuania, Portugal, Slovakia). In Germany, Latvia and Slovakia, smart metering was found to be economically justified only for particular groups of customers. These countries now expect to roll out smart meters to around 23% of household consumers. Four Member States (Bulgaria, Cyprus, Hungary, Slovenia) did not produce CBAs or rollout plans at all. Although enthusiasm for smart electricity metering is not uniform across the EU, a majority of Member States still intend to proceed with large-scale deployment by 2020. Based on the national CBAs, the estimated cost of installing smart electricity meters was identified to vary widely between different Member States, from €77 to €776 per customer. The Commission's benchmarking report expects that smart metering will lead to substantial cost savings in the longer run: the average consumer can reduce their energy costs by around 3%, while some types of consumers could reduce them by up to 10%. Evidence from Member States that have extensively deployed smart metering in the EU would suggest savings are likely to be more modest. Finland found the average savings to be only 1-2%, while Sweden gave a range of 1-3%. Other CBAs conducted by Member States predicted energy savings to be insignificant or as low as 1% per customer. Therefore some stakeholders argue that smart meters should only be installed for consumers with high energy usage, reducing the costs of deployment while keeping the average savings higher. The Commission argues25 that smart meters with broad functionality are able to provide a wider range of information to customers, which is more frequently updated and more easily accessible, thereby facilitating demand side response25. According to the estimates in this report24, the roll-out commitments amount to an investment of around €45 billion for the installation by 2020 of close to 200 million smart meters for electricity (representing approximately 72% of all European consumers) and 45 million meters (around 40% of consumers) for gas.
Figure 5: Deployment of smart electricity meters in EU Member States by 2020
25
http://www.europarl.europa.eu/RegData/etudes/BRIE/2015/568318/EPRS_BRI(2015)568318_EN.pdf
Task 2 report – Economic and Market Analysis
11
European Smart Grids Task Force Expert Group 1 report (2015) 2.1.4.2.
In October 2015, the Expert Group 1 on Standards and Interoperability of the European Smart Grids Task Force issued a report covering a survey regarding interoperability, standards and functionalities applied in the large scale roll out of smart metering in EU Member States26. The report assesses the current roll-out of smart metering systems in seventeen Member States with reference to i) their degree of interoperability with other components/operations of the energy system, meaning in practice the implementation of the M/490 standardised local interfaces (H1, H2 and H3)27; and ii) checking whether these smart metering set-ups are equipped with functionalities for the provision of energy management services, i.e. examine compliance with the EC recommended, and consumer-benefitting, functionalities (a), (b) and (f) (EC Recommendation 2012/148/EU), where
Functionality (a) means: Provide readings directly to the customer and any third party designated by the consumer.
Functionality (b) means: Update the readings referred to in point (a) frequently enough to allow the information to be used to achieve energy savings.
Functionality (f) means: Support advanced tariff systems. This functionality relates to both the demand side and the supply side.
The conclusions of this report are the following: All 17 Member States that responded implement functionality (a). 3 out of 17 Member States (18%)
do not implement functionality (b) as it was specified by the Commission in its Recommendation
(with at least 15 minute update frequency). 2 of them will do so on consumer request.
Five Member States will not use the smart metering system to implement functionality (f). In these
cases it is important to understand if consumers will be able to check their consumption per tariff
zone on the meter, if tariff zones are used for billing.
16 Member States will implement the H interfaces initially, later or on consumer request, and the
majority intends to roll-out interface H1.
7 Member States indicated that they currently use a web-portal as an alternative or complementary
to the H1, H2, H3 interfaces although these interfaces might be implemented later or on consumer
request.
A majority of Member States did not make additional definitions for improving interoperability on
the H interfaces. That leads to the conclusion that more attention should be drawn to the approach
of reaching interoperability on various layers through profiles / companion standards.
In the references made to standards for the H interfaces, the CENELEC TC205 standards (EN 50491-
11 and -12) are never mentioned. Since they deal with data definitions, there is a risk that the data
and its format provided by the Advanced metering infrastructure (AMI)28 is not aligned with the data
and formats required by in-home energy management.
26
Report on a survey regarding Interoperability, Standards and Functionalities applied in the large scale roll out of smart metering in EU Member States; European Smart Grids Task Force Expert Group 1 – Standards and Interoperability, October 2015 27
See Standards section in Task 1 28
Advanced metering infrastructure (AMI) is an integrated system of smart meters, communications networks, and data management systems that enables two-way communication between utilities and customers.
Task 2 report – Economic and Market Analysis
12
TREND: TRADITIONAL ROLES WILL CHANGE
Upgrading appliances to smart appliances is more than just adding a communication hardware module and communication software to the appliance. Connectivity with the end-consumer could have a substantial impact on the business models of manufacturers. Several market research analysts indicate that traditional appliances manufacturers will have to approach the market more as technology providers instead of as manufacturing companies. The manufacturers need to engage not only with distributors, sales depots, retailers, and OEM players as they have done in past, but also with end-consumers. Manufacturers, distributors or retailers may take up the role of service provider and may provide a variety of services towards the consumer:
Provide a maintenance service related the smart appliance or smart home systems. For instance a smart washing machine can proactively request maintenance ahead of failure;
Provide an energy service. For instance smart home thermostat providers may offer the flexibility of the connected smart homes, with consent of the owner, to the energy market or utilities;
Provide a sales channel to tertiary products; a smart fridge may order extra milk when run out of milk; a washing machine29 may order or send a message to your smartphone prompting you to order more when supplies of its detergent run low;
The setup of these smart appliances may not be so easy for the average consumer. Setting up a single smart appliance may be not so difficult, but integrating several smart appliances to work together creating a smart system or smart home may be much harder. In this case the retailer for instance may take up the role of integrator or consultant of smart appliances/systems.
Obviously these companies will try to convince consumers to buy into connected devices from the same brand rather than shop across the category. The big advantage for those companies that succeed in making the right connected machines, is that upgrades can be simply plugged in to existing devices therefore keeping customers’ loyal and potentially happy to stay with the brand long term. The new services, however, do not only provide new opportunities but also new obligations. For instance to convince the consumers these companies must assure the consumers that any data they share with their connected appliances will be handled securely.
2.1.5. EMERGING BUSINESS MODELS RELATED TO THE INTERNET OF THINGS
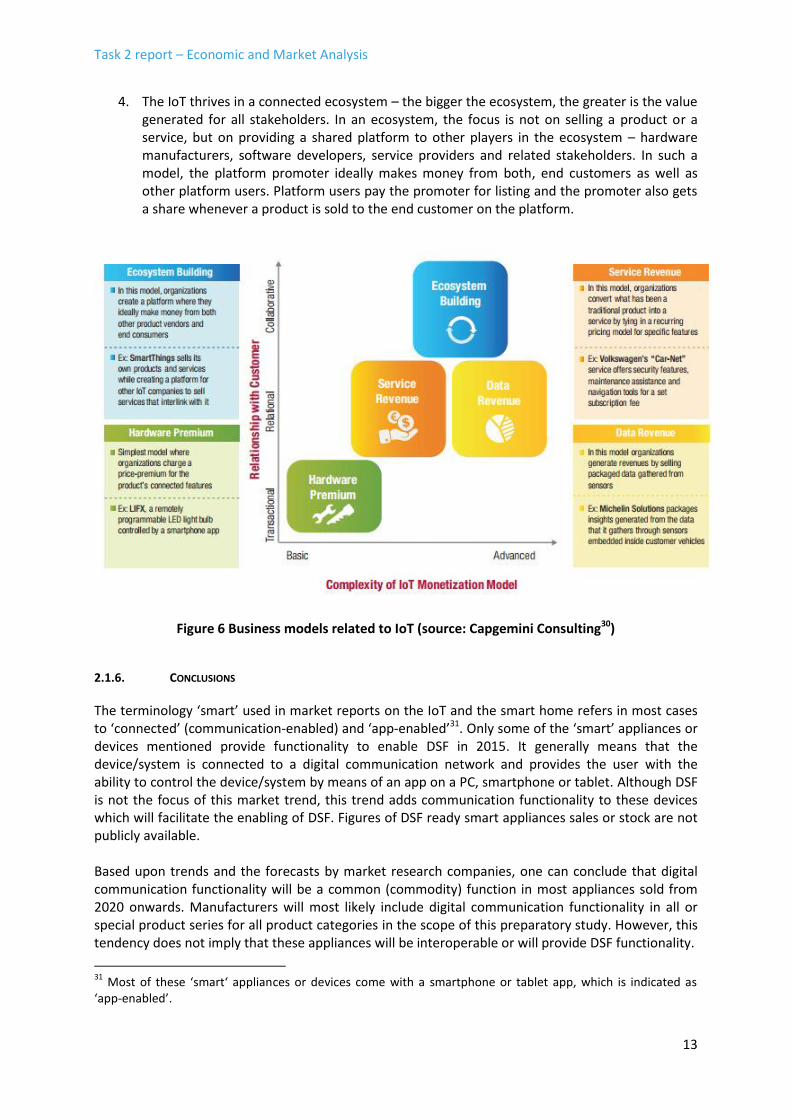
In its report “Monetizing the Internet of Things: Extracting Value from the Connectivity Opportunity”30 Capgemini Consulting indicates that there are four distinct business models that are emerging (Figure 6):
1. “Hardware Premium” is the most basic form of business model. Organizations add connectivity options to an existing or new product and offer remote device management in the form of mobile apps. This basic level of connectivity and control enables organizations to charge a premium for their product.
2. The service model offers a recurring revenue stream and, more importantly, creates a relationship with the customer long after they have purchased a product.
3. Connected devices generate large volumes of sensor data. For many organizations, the ability to capture, package and sell this data offers a potential business model. Once this data has been aggregated and anonymized, organizations can choose to sell it raw, package insights from it or monetize it using advertising.
29
Miele’s new Edition Conn@ct washing machine 30
https://www.capgemini-consulting.com/resource-file-access/resource/pdf/iot_monetization_0.pdf
Task 2 report – Economic and Market Analysis
13
4. The IoT thrives in a connected ecosystem – the bigger the ecosystem, the greater is the value generated for all stakeholders. In an ecosystem, the focus is not on selling a product or a service, but on providing a shared platform to other players in the ecosystem – hardware manufacturers, software developers, service providers and related stakeholders. In such a model, the platform promoter ideally makes money from both, end customers as well as other platform users. Platform users pay the promoter for listing and the promoter also gets a share whenever a product is sold to the end customer on the platform.
Figure 6 Business models related to IoT (source: Capgemini Consulting30)
2.1.6. CONCLUSIONS
The terminology ‘smart’ used in market reports on the IoT and the smart home refers in most cases to ‘connected’ (communication-enabled) and ‘app-enabled’31. Only some of the ‘smart’ appliances or devices mentioned provide functionality to enable DSF in 2015. It generally means that the device/system is connected to a digital communication network and provides the user with the ability to control the device/system by means of an app on a PC, smartphone or tablet. Although DSF is not the focus of this market trend, this trend adds communication functionality to these devices which will facilitate the enabling of DSF. Figures of DSF ready smart appliances sales or stock are not publicly available. Based upon trends and the forecasts by market research companies, one can conclude that digital communication functionality will be a common (commodity) function in most appliances sold from 2020 onwards. Manufacturers will most likely include digital communication functionality in all or special product series for all product categories in the scope of this preparatory study. However, this tendency does not imply that these appliances will be interoperable or will provide DSF functionality.
31
Most of these ‘smart‘ appliances or devices come with a smartphone or tablet app, which is indicated as ‘app-enabled’.
Task 2 report – Economic and Market Analysis
14
In 2015 most of the smart appliances in this context (thus communication-enabled) are not part of a DR program. However, for two categories of these devices one can already see a path towards DR: smart thermostats and energy management systems. Several European energy service providers are partnering with smart thermostat vendors and are offering smart thermostats to their customers. Some of these energy providers already offer along with the smart thermostat a DR program. Besides these offerings, customers are also buying off-the-shelf smart thermostats. Most of the smart thermostats are connected to a cloud and provide the necessary functionality to enable DSF. With market research companies estimating an installed base of more than 10 million homes with smart thermostats in 2019, smart thermostats are likely to be the first smart appliances to offer significant DSF capacity. A second trend related to smart thermostats is that the thermostat is evolving into a residential energy management gateway or hub. In this role the smart thermostat is not only controlling the space heating and cooling, but it is also managing other energy using systems in the home like water heaters, pool pumps, smart plugs, EV chargers, etc. Besides potentially helping increase the overall energy efficiency, depending on the context and its use, energy management systems provide also the opportunity to offer DSF capacity based upon the resources managed by the EMS. According to the estimations made by the EC, 200 million smart meters for electricity will be installed in 2020, representing approximately 72% of all European consumers. The EC recommends that these intelligent metering systems should enable demand response and other energy services to evolve24. The trend towards ‘connected’ devices will have a significant impact on the business models, the roles, the sales channels and service channels in this market. Instead of a one-time contact (sales) with the customer, the manufacturer/vendor/service provider will in the IoT scenario have a permanent link with the customer for the entire lifetime of the product.
2.2. CURRENT STOCK OF APPLIANCES AND ESTIMATION OF SHARE OF SMART APPLIANCES
Smart appliances as defined in the context of this preparatory study have not yet (or only to a very limited degree) seized the market and no figures are available specifically for this subcategory of ‘smart’ appliances. Therefore, the current stock data for all appliances - including non-communication/communication enabled and non-DSF/DSF enabled appliances – is given as a starting point. Per appliance type, expert judgment estimations have been made per appliance type of the current share of DSF enabled stock as well as predictions for 2020 and 2030 in a BAU scenario.
2.2.1. PERIODICAL APPLIANCES
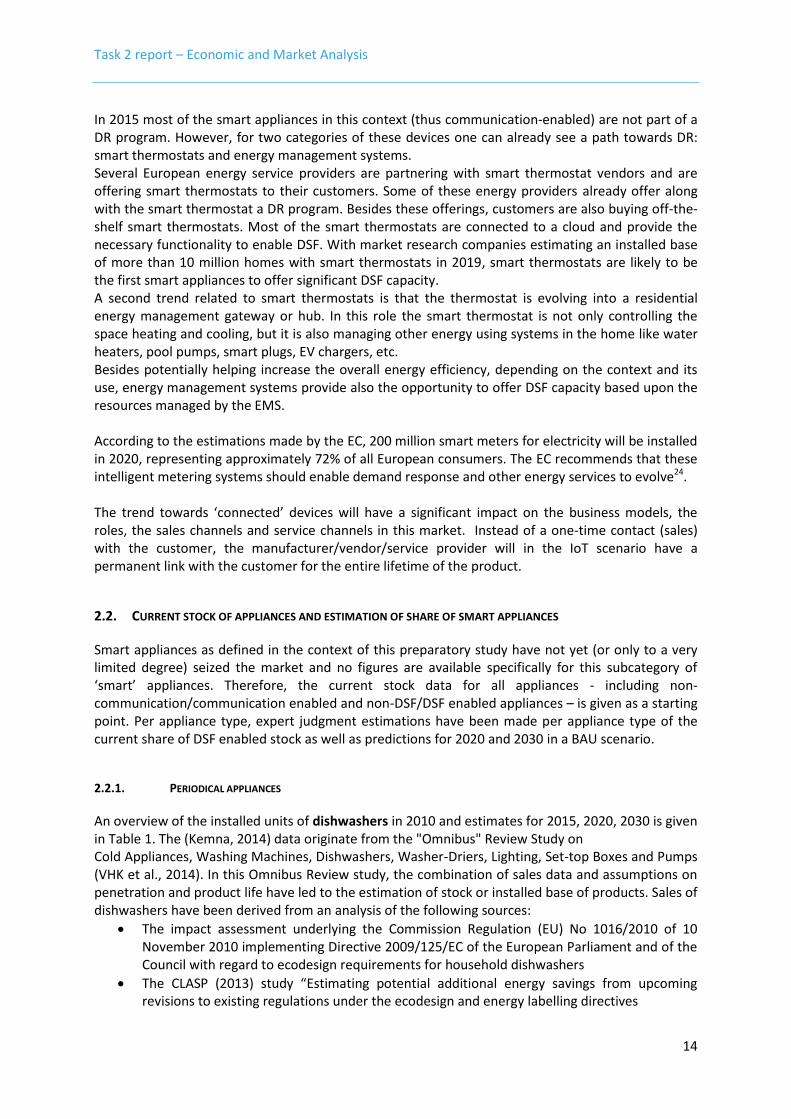
An overview of the installed units of dishwashers in 2010 and estimates for 2015, 2020, 2030 is given in Table 1. The (Kemna, 2014) data originate from the "Omnibus" Review Study on Cold Appliances, Washing Machines, Dishwashers, Washer-Driers, Lighting, Set-top Boxes and Pumps (VHK et al., 2014). In this Omnibus Review study, the combination of sales data and assumptions on penetration and product life have led to the estimation of stock or installed base of products. Sales of dishwashers have been derived from an analysis of the following sources:
The impact assessment underlying the Commission Regulation (EU) No 1016/2010 of 10 November 2010 implementing Directive 2009/125/EC of the European Parliament and of the Council with regard to ecodesign requirements for household dishwashers
The CLASP (2013) study “Estimating potential additional energy savings from upcoming revisions to existing regulations under the ecodesign and energy labelling directives
Task 2 report – Economic and Market Analysis
15
GfK sales data from 2011-2012 for 23 EU-countries. For 2020 and 2030, educated estimations were made of the share of smart appliances.
Table 1: Installed units of dishwashers in 2010 (reference) and 2015, 2020, 2030 (estimates)
Appliance group Dishwashers
Reference Year 2010 2015 2020 2030
Installed base 82,799,000 98,345,000 115,036,000 148,553,000
Source Kemna, 2014 Kemna, 2014 Kemna, 2014 Kemna, 2014
Number of smart appliances
0 575,180 29,710,600
Source Conservative estimation of 0% of
installed base
Estimation of 5% of installed base
Estimation of 20% of installed base
Reference countries EU28 EU28 EU28
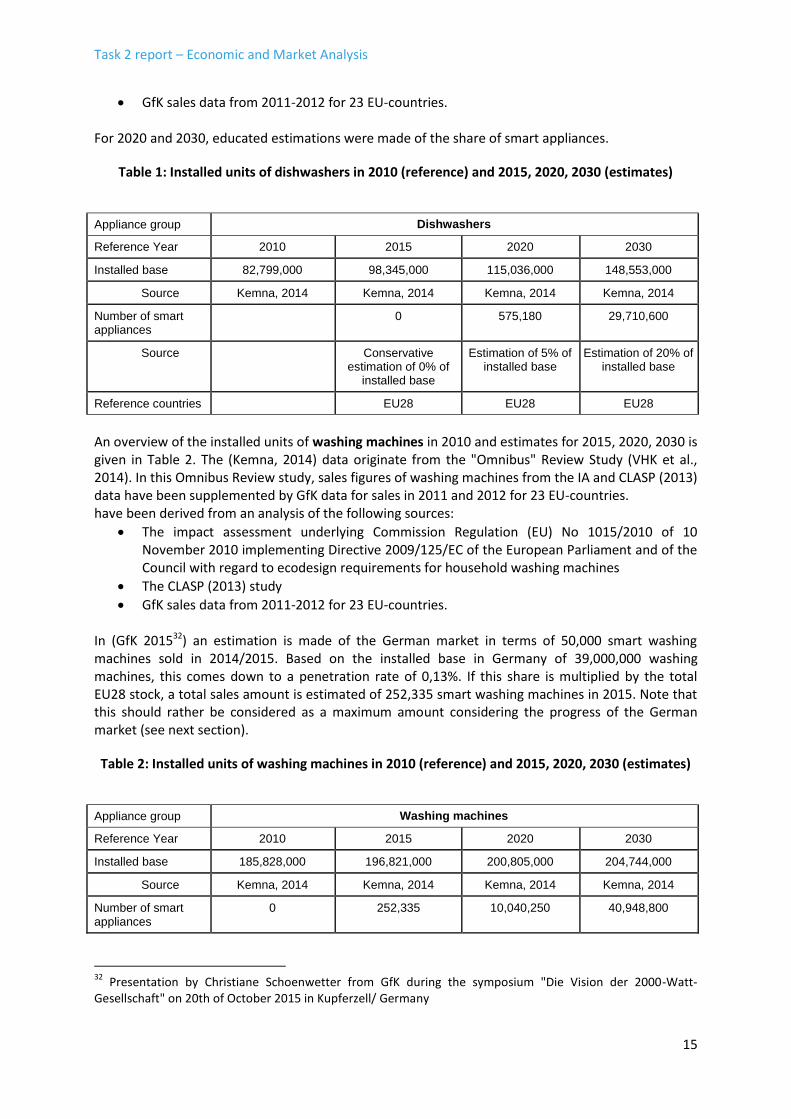
An overview of the installed units of washing machines in 2010 and estimates for 2015, 2020, 2030 is given in Table 2. The (Kemna, 2014) data originate from the "Omnibus" Review Study (VHK et al., 2014). In this Omnibus Review study, sales figures of washing machines from the IA and CLASP (2013) data have been supplemented by GfK data for sales in 2011 and 2012 for 23 EU-countries. have been derived from an analysis of the following sources:
The impact assessment underlying Commission Regulation (EU) No 1015/2010 of 10 November 2010 implementing Directive 2009/125/EC of the European Parliament and of the Council with regard to ecodesign requirements for household washing machines
The CLASP (2013) study
GfK sales data from 2011-2012 for 23 EU-countries. In (GfK 201532) an estimation is made of the German market in terms of 50,000 smart washing machines sold in 2014/2015. Based on the installed base in Germany of 39,000,000 washing machines, this comes down to a penetration rate of 0,13%. If this share is multiplied by the total EU28 stock, a total sales amount is estimated of 252,335 smart washing machines in 2015. Note that this should rather be considered as a maximum amount considering the progress of the German market (see next section).
Table 2: Installed units of washing machines in 2010 (reference) and 2015, 2020, 2030 (estimates)
Appliance group Washing machines
Reference Year 2010 2015 2020 2030
Installed base 185,828,000 196,821,000 200,805,000 204,744,000
Source Kemna, 2014 Kemna, 2014 Kemna, 2014 Kemna, 2014
Number of smart appliances
0 252,335 10,040,250 40,948,800
32
Presentation by Christiane Schoenwetter from GfK during the symposium "Die Vision der 2000-Watt-Gesellschaft" on 20th of October 2015 in Kupferzell/ Germany
Task 2 report – Economic and Market Analysis
16
Appliance group Washing machines
Reference Year 2010 2015 2020 2030
Source Estimation of 0% of installed base
Extrapolation based on 0.13%
penetration of German market
(Gfk, 2015)
Estimation of 5% of installed base
Estimation of 20% of installed base
Reference countries EU28 EU28 EU28 EU28
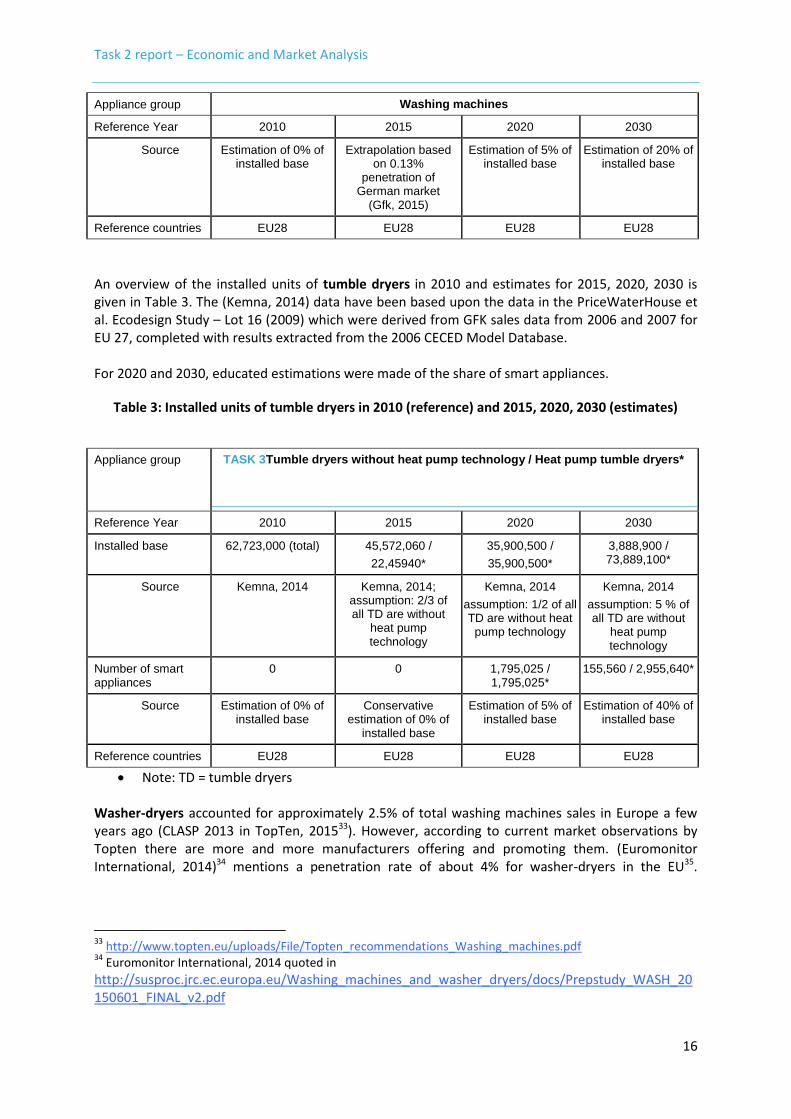
An overview of the installed units of tumble dryers in 2010 and estimates for 2015, 2020, 2030 is given in Table 3. The (Kemna, 2014) data have been based upon the data in the PriceWaterHouse et al. Ecodesign Study – Lot 16 (2009) which were derived from GFK sales data from 2006 and 2007 for EU 27, completed with results extracted from the 2006 CECED Model Database. For 2020 and 2030, educated estimations were made of the share of smart appliances.
Table 3: Installed units of tumble dryers in 2010 (reference) and 2015, 2020, 2030 (estimates)
Appliance group TASK 3Tumble dryers without heat pump technology / Heat pump tumble dryers*
Reference Year 2010 2015 2020 2030
Installed base 62,723,000 (total) 45,572,060 /
22,45940*
35,900,500 /
35,900,500*
3,888,900 / 73,889,100*
Source Kemna, 2014 Kemna, 2014; assumption: 2/3 of all TD are without
heat pump technology
Kemna, 2014
assumption: 1/2 of all TD are without heat
pump technology
Kemna, 2014
assumption: 5 % of all TD are without
heat pump technology
Number of smart appliances
0 0 1,795,025 / 1,795,025*
155,560 / 2,955,640*
Source Estimation of 0% of installed base
Conservative estimation of 0% of
installed base
Estimation of 5% of installed base
Estimation of 40% of installed base
Reference countries EU28 EU28 EU28 EU28
Note: TD = tumble dryers Washer-dryers accounted for approximately 2.5% of total washing machines sales in Europe a few years ago (CLASP 2013 in TopTen, 201533). However, according to current market observations by Topten there are more and more manufacturers offering and promoting them. (Euromonitor International, 2014)34 mentions a penetration rate of about 4% for washer-dryers in the EU35.
33
http://www.topten.eu/uploads/File/Topten_recommendations_Washing_machines.pdf 34
Euromonitor International, 2014 quoted in
http://susproc.jrc.ec.europa.eu/Washing_machines_and_washer_dryers/docs/Prepstudy_WASH_20150601_FINAL_v2.pdf
Task 2 report – Economic and Market Analysis
17
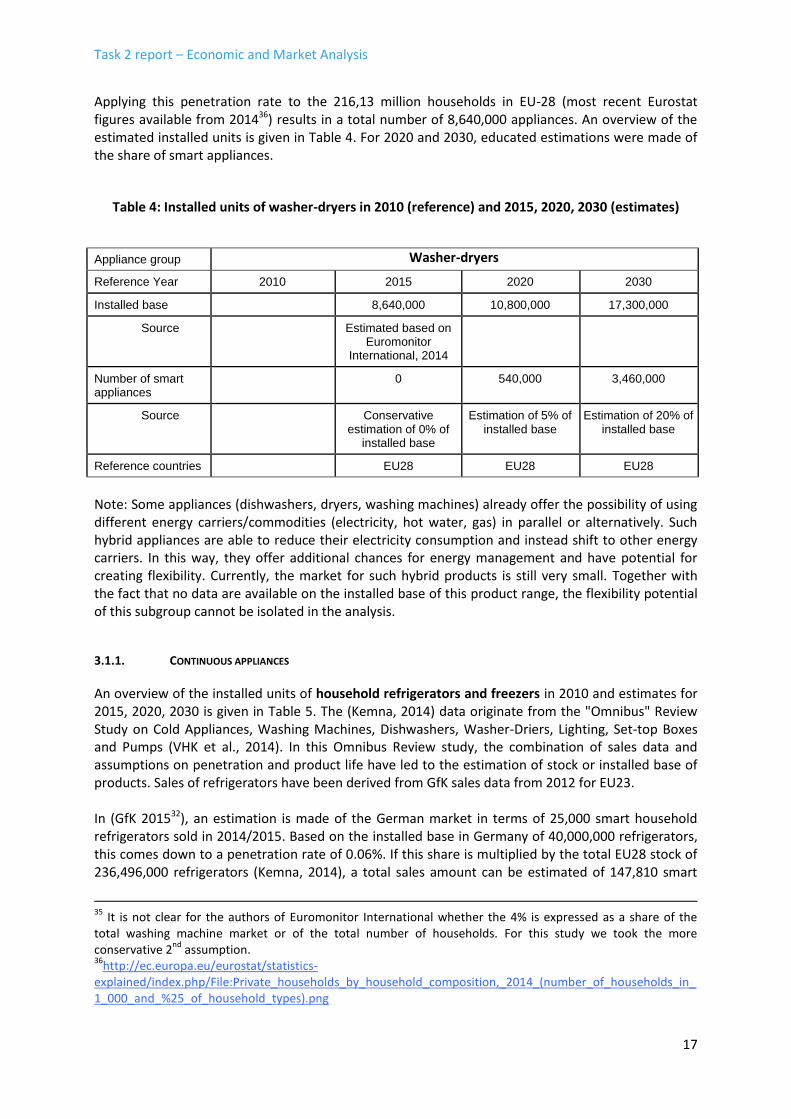
Applying this penetration rate to the 216,13 million households in EU-28 (most recent Eurostat figures available from 201436) results in a total number of 8,640,000 appliances. An overview of the estimated installed units is given in Table 4. For 2020 and 2030, educated estimations were made of the share of smart appliances.
Table 4: Installed units of washer-dryers in 2010 (reference) and 2015, 2020, 2030 (estimates)
Appliance group Washer-dryers
Reference Year 2010 2015 2020 2030
Installed base 8,640,000 10,800,000 17,300,000
Source Estimated based on Euromonitor
International, 2014
Number of smart appliances
0 540,000 3,460,000
Source Conservative estimation of 0% of
installed base
Estimation of 5% of installed base
Estimation of 20% of installed base
Reference countries EU28 EU28 EU28
Note: Some appliances (dishwashers, dryers, washing machines) already offer the possibility of using different energy carriers/commodities (electricity, hot water, gas) in parallel or alternatively. Such hybrid appliances are able to reduce their electricity consumption and instead shift to other energy carriers. In this way, they offer additional chances for energy management and have potential for creating flexibility. Currently, the market for such hybrid products is still very small. Together with the fact that no data are available on the installed base of this product range, the flexibility potential of this subgroup cannot be isolated in the analysis.
3.1.1. CONTINUOUS APPLIANCES
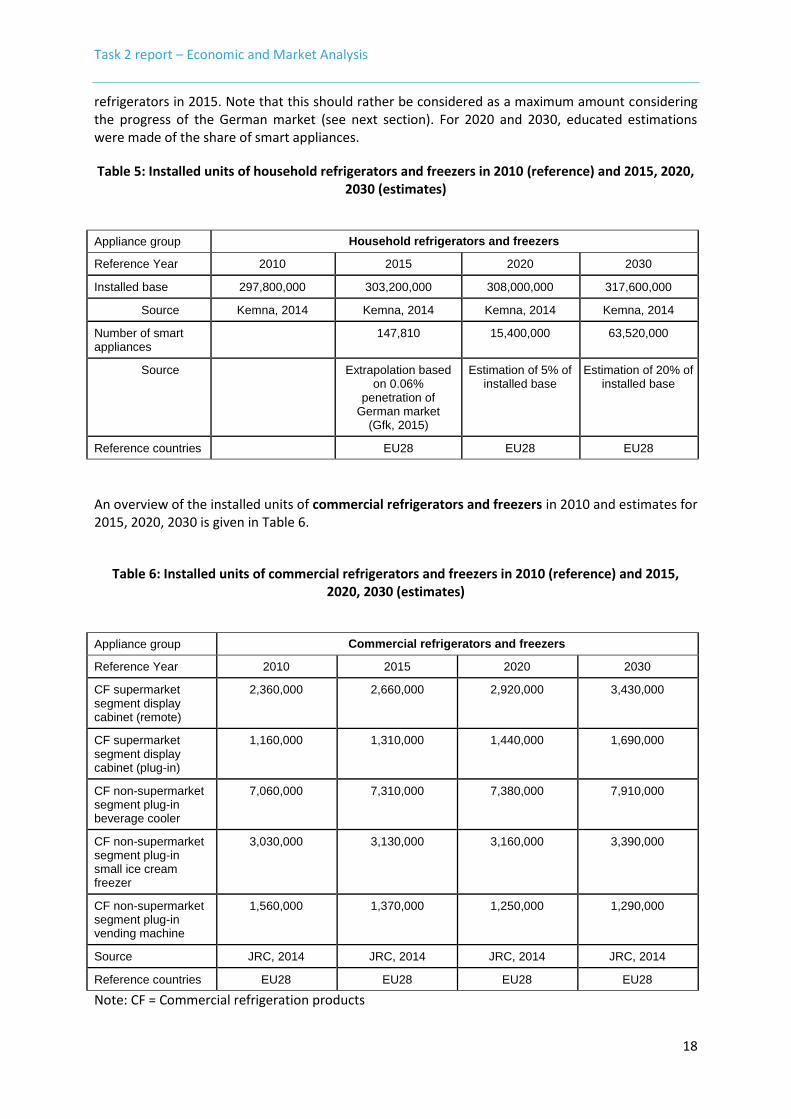
An overview of the installed units of household refrigerators and freezers in 2010 and estimates for 2015, 2020, 2030 is given in Table 5. The (Kemna, 2014) data originate from the "Omnibus" Review Study on Cold Appliances, Washing Machines, Dishwashers, Washer-Driers, Lighting, Set-top Boxes and Pumps (VHK et al., 2014). In this Omnibus Review study, the combination of sales data and assumptions on penetration and product life have led to the estimation of stock or installed base of products. Sales of refrigerators have been derived from GfK sales data from 2012 for EU23. In (GfK 201532), an estimation is made of the German market in terms of 25,000 smart household refrigerators sold in 2014/2015. Based on the installed base in Germany of 40,000,000 refrigerators, this comes down to a penetration rate of 0.06%. If this share is multiplied by the total EU28 stock of 236,496,000 refrigerators (Kemna, 2014), a total sales amount can be estimated of 147,810 smart
35
It is not clear for the authors of Euromonitor International whether the 4% is expressed as a share of the total washing machine market or of the total number of households. For this study we took the more conservative 2
nd assumption.
36http://ec.europa.eu/eurostat/statistics-
explained/index.php/File:Private_households_by_household_composition,_2014_(number_of_households_in_1_000_and_%25_of_household_types).png
Task 2 report – Economic and Market Analysis
18
refrigerators in 2015. Note that this should rather be considered as a maximum amount considering the progress of the German market (see next section). For 2020 and 2030, educated estimations were made of the share of smart appliances.
Table 5: Installed units of household refrigerators and freezers in 2010 (reference) and 2015, 2020, 2030 (estimates)
Appliance group Household refrigerators and freezers
Reference Year 2010 2015 2020 2030
Installed base 297,800,000 303,200,000 308,000,000 317,600,000
Source Kemna, 2014 Kemna, 2014 Kemna, 2014 Kemna, 2014
Number of smart appliances
147,810 15,400,000 63,520,000
Source Extrapolation based on 0.06%
penetration of German market
(Gfk, 2015)
Estimation of 5% of installed base
Estimation of 20% of installed base
Reference countries EU28 EU28 EU28
An overview of the installed units of commercial refrigerators and freezers in 2010 and estimates for 2015, 2020, 2030 is given in Table 6.
Table 6: Installed units of commercial refrigerators and freezers in 2010 (reference) and 2015, 2020, 2030 (estimates)
Appliance group Commercial refrigerators and freezers
Reference Year 2010 2015 2020 2030
CF supermarket segment display cabinet (remote)
2,360,000 2,660,000 2,920,000 3,430,000
CF supermarket segment display cabinet (plug-in)
1,160,000 1,310,000 1,440,000 1,690,000
CF non-supermarket segment plug-in beverage cooler
7,060,000 7,310,000 7,380,000 7,910,000
CF non-supermarket segment plug-in small ice cream freezer
3,030,000 3,130,000 3,160,000 3,390,000
CF non-supermarket segment plug-in vending machine
1,560,000 1,370,000 1,250,000 1,290,000
Source JRC, 2014 JRC, 2014 JRC, 2014 JRC, 2014
Reference countries EU28 EU28 EU28 EU28
Note: CF = Commercial refrigeration products
Task 2 report – Economic and Market Analysis
19
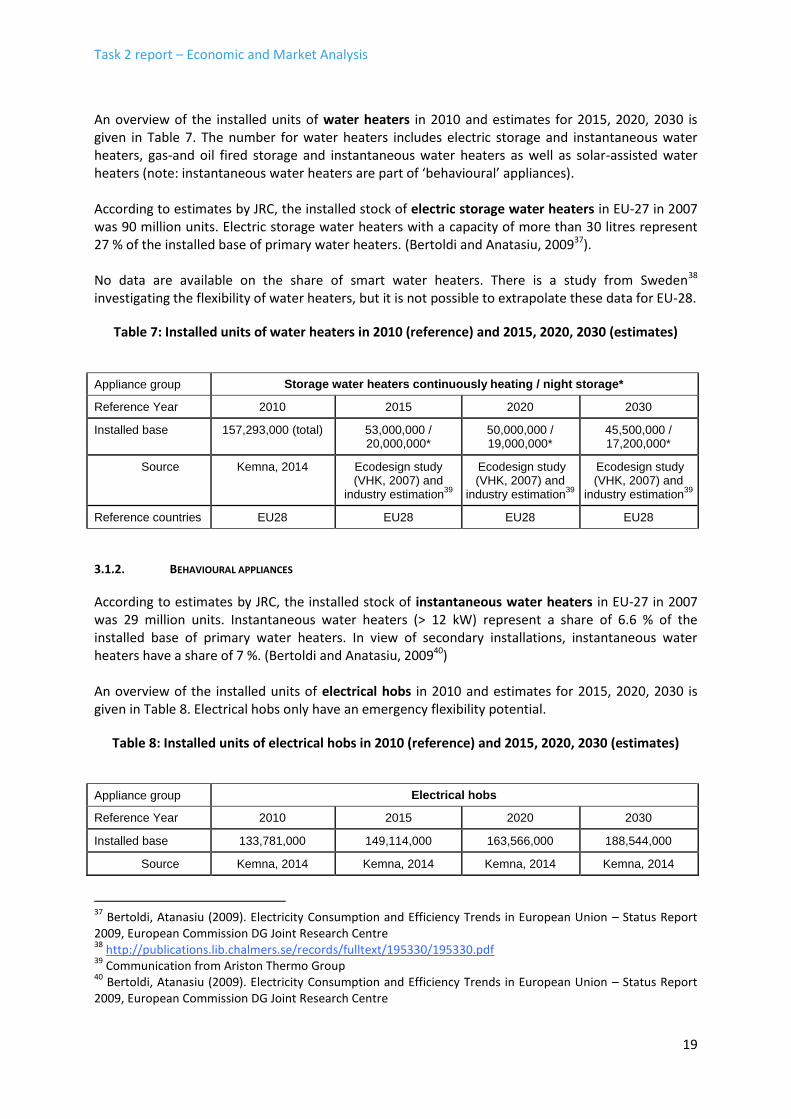
An overview of the installed units of water heaters in 2010 and estimates for 2015, 2020, 2030 is given in Table 7. The number for water heaters includes electric storage and instantaneous water heaters, gas-and oil fired storage and instantaneous water heaters as well as solar-assisted water heaters (note: instantaneous water heaters are part of ‘behavioural’ appliances). According to estimates by JRC, the installed stock of electric storage water heaters in EU-27 in 2007 was 90 million units. Electric storage water heaters with a capacity of more than 30 litres represent 27 % of the installed base of primary water heaters. (Bertoldi and Anatasiu, 200937). No data are available on the share of smart water heaters. There is a study from Sweden38 investigating the flexibility of water heaters, but it is not possible to extrapolate these data for EU-28.
Table 7: Installed units of water heaters in 2010 (reference) and 2015, 2020, 2030 (estimates)
Appliance group Storage water heaters continuously heating / night storage*
Reference Year 2010 2015 2020 2030
Installed base 157,293,000 (total) 53,000,000 / 20,000,000*
50,000,000 / 19,000,000*
45,500,000 / 17,200,000*
Source Kemna, 2014 Ecodesign study (VHK, 2007) and
industry estimation39
Ecodesign study (VHK, 2007) and
industry estimation39
Ecodesign study (VHK, 2007) and
industry estimation39
Reference countries EU28 EU28 EU28 EU28
3.1.2. BEHAVIOURAL APPLIANCES
According to estimates by JRC, the installed stock of instantaneous water heaters in EU-27 in 2007 was 29 million units. Instantaneous water heaters (> 12 kW) represent a share of 6.6 % of the installed base of primary water heaters. In view of secondary installations, instantaneous water heaters have a share of 7 %. (Bertoldi and Anatasiu, 200940) An overview of the installed units of electrical hobs in 2010 and estimates for 2015, 2020, 2030 is given in Table 8. Electrical hobs only have an emergency flexibility potential.
Table 8: Installed units of electrical hobs in 2010 (reference) and 2015, 2020, 2030 (estimates)
Appliance group Electrical hobs
Reference Year 2010 2015 2020 2030
Installed base 133,781,000 149,114,000 163,566,000 188,544,000
Source Kemna, 2014 Kemna, 2014 Kemna, 2014 Kemna, 2014
37
Bertoldi, Atanasiu (2009). Electricity Consumption and Efficiency Trends in European Union – Status Report 2009, European Commission DG Joint Research Centre 38
http://publications.lib.chalmers.se/records/fulltext/195330/195330.pdf 39
Communication from Ariston Thermo Group 40
Bertoldi, Atanasiu (2009). Electricity Consumption and Efficiency Trends in European Union – Status Report 2009, European Commission DG Joint Research Centre
Task 2 report – Economic and Market Analysis
20
Number of smart appliances
Only emergency flexibility potential
Only emergency flexibility potential
Only emergency flexibility potential
Only emergency flexibility potential
Reference countries EU28 EU28 EU28 EU28
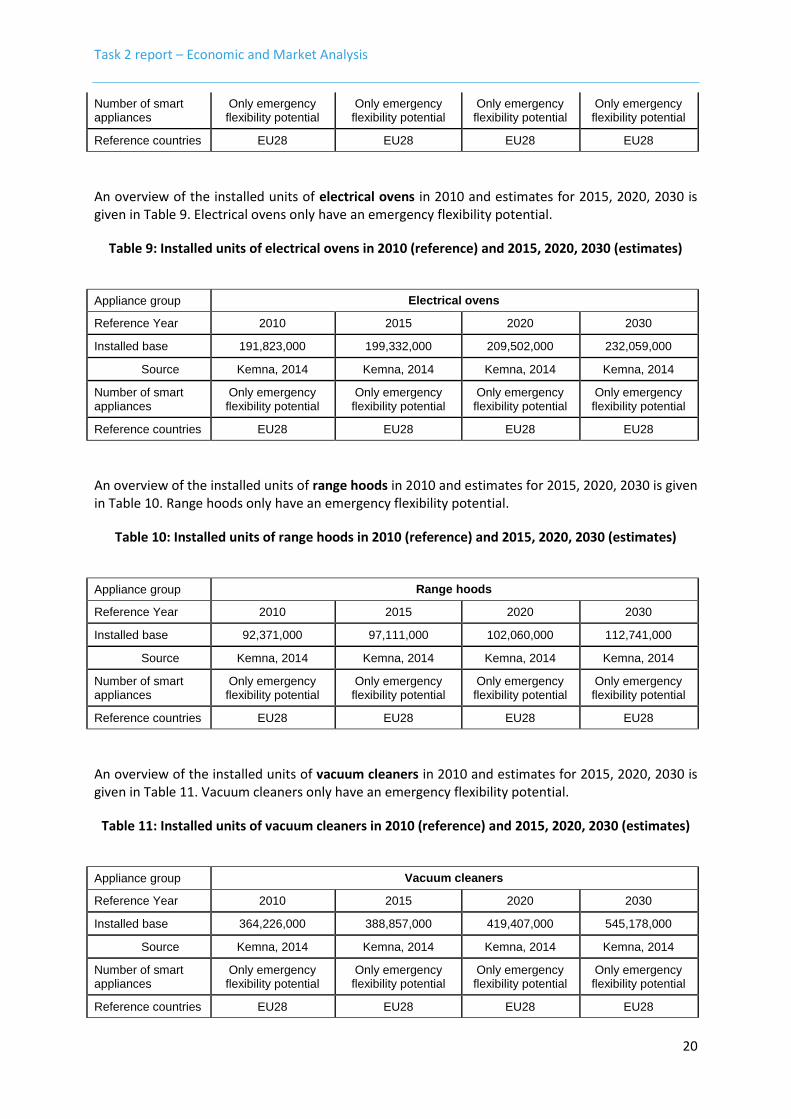
An overview of the installed units of electrical ovens in 2010 and estimates for 2015, 2020, 2030 is given in Table 9. Electrical ovens only have an emergency flexibility potential.
Table 9: Installed units of electrical ovens in 2010 (reference) and 2015, 2020, 2030 (estimates)
Appliance group Electrical ovens
Reference Year 2010 2015 2020 2030
Installed base 191,823,000 199,332,000 209,502,000 232,059,000
Source Kemna, 2014 Kemna, 2014 Kemna, 2014 Kemna, 2014
Number of smart appliances
Only emergency flexibility potential
Only emergency flexibility potential
Only emergency flexibility potential
Only emergency flexibility potential
Reference countries EU28 EU28 EU28 EU28
An overview of the installed units of range hoods in 2010 and estimates for 2015, 2020, 2030 is given in Table 10. Range hoods only have an emergency flexibility potential.
Table 10: Installed units of range hoods in 2010 (reference) and 2015, 2020, 2030 (estimates)
Appliance group Range hoods
Reference Year 2010 2015 2020 2030
Installed base 92,371,000 97,111,000 102,060,000 112,741,000
Source Kemna, 2014 Kemna, 2014 Kemna, 2014 Kemna, 2014
Number of smart appliances
Only emergency flexibility potential
Only emergency flexibility potential
Only emergency flexibility potential
Only emergency flexibility potential
Reference countries EU28 EU28 EU28 EU28
An overview of the installed units of vacuum cleaners in 2010 and estimates for 2015, 2020, 2030 is given in Table 11. Vacuum cleaners only have an emergency flexibility potential.
Table 11: Installed units of vacuum cleaners in 2010 (reference) and 2015, 2020, 2030 (estimates)
Appliance group Vacuum cleaners
Reference Year 2010 2015 2020 2030
Installed base 364,226,000 388,857,000 419,407,000 545,178,000
Source Kemna, 2014 Kemna, 2014 Kemna, 2014 Kemna, 2014
Number of smart appliances
Only emergency flexibility potential
Only emergency flexibility potential
Only emergency flexibility potential
Only emergency flexibility potential
Reference countries EU28 EU28 EU28 EU28
Task 2 report – Economic and Market Analysis
21
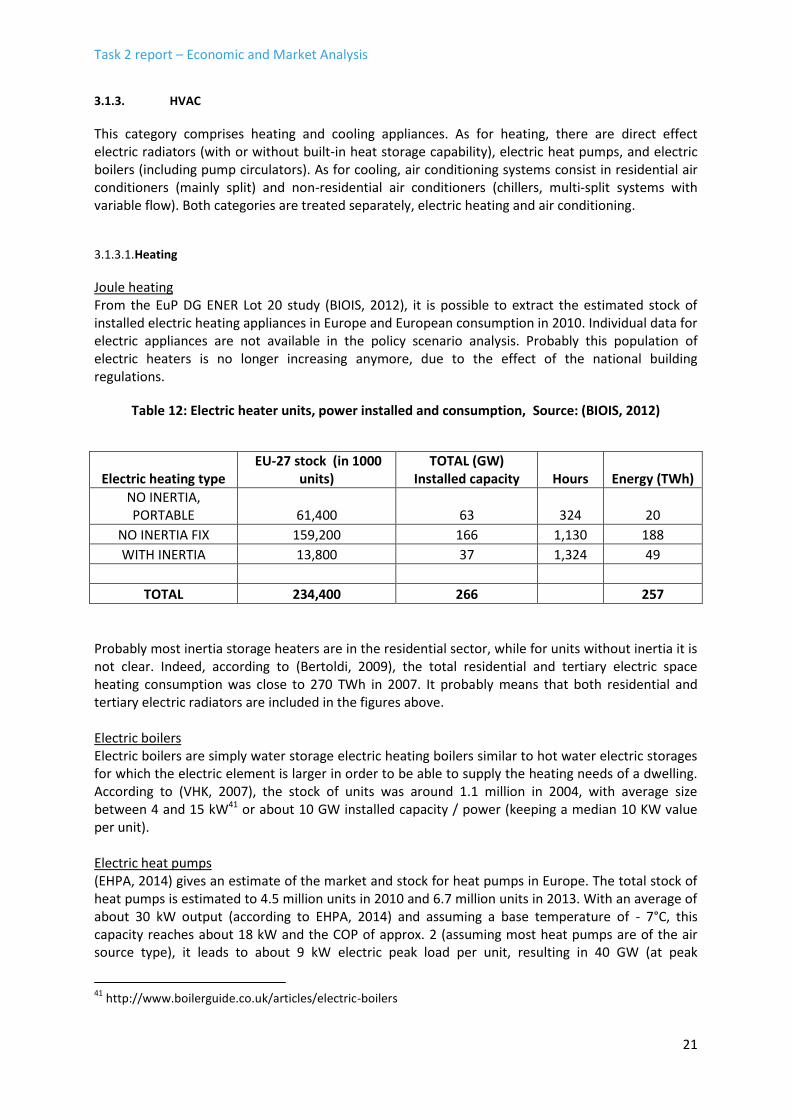
3.1.3. HVAC
This category comprises heating and cooling appliances. As for heating, there are direct effect electric radiators (with or without built-in heat storage capability), electric heat pumps, and electric boilers (including pump circulators). As for cooling, air conditioning systems consist in residential air conditioners (mainly split) and non-residential air conditioners (chillers, multi-split systems with variable flow). Both categories are treated separately, electric heating and air conditioning.
Heating 3.1.3.1.
Joule heating From the EuP DG ENER Lot 20 study (BIOIS, 2012), it is possible to extract the estimated stock of installed electric heating appliances in Europe and European consumption in 2010. Individual data for electric appliances are not available in the policy scenario analysis. Probably this population of electric heaters is no longer increasing anymore, due to the effect of the national building regulations.
Table 12: Electric heater units, power installed and consumption, Source: (BIOIS, 2012)
Electric heating type EU-27 stock (in 1000
units) TOTAL (GW)
Installed capacity Hours Energy (TWh)
NO INERTIA, PORTABLE 61,400 63 324 20
NO INERTIA FIX 159,200 166 1,130 188
WITH INERTIA 13,800 37 1,324 49
TOTAL 234,400 266
257
Probably most inertia storage heaters are in the residential sector, while for units without inertia it is not clear. Indeed, according to (Bertoldi, 2009), the total residential and tertiary electric space heating consumption was close to 270 TWh in 2007. It probably means that both residential and tertiary electric radiators are included in the figures above. Electric boilers Electric boilers are simply water storage electric heating boilers similar to hot water electric storages for which the electric element is larger in order to be able to supply the heating needs of a dwelling. According to (VHK, 2007), the stock of units was around 1.1 million in 2004, with average size between 4 and 15 kW41 or about 10 GW installed capacity / power (keeping a median 10 KW value per unit). Electric heat pumps (EHPA, 2014) gives an estimate of the market and stock for heat pumps in Europe. The total stock of heat pumps is estimated to 4.5 million units in 2010 and 6.7 million units in 2013. With an average of about 30 kW output (according to EHPA, 2014) and assuming a base temperature of - 7°C, this capacity reaches about 18 kW and the COP of approx. 2 (assuming most heat pumps are of the air source type), it leads to about 9 kW electric peak load per unit, resulting in 40 GW (at peak
41
http://www.boilerguide.co.uk/articles/electric-boilers
Task 2 report – Economic and Market Analysis
22
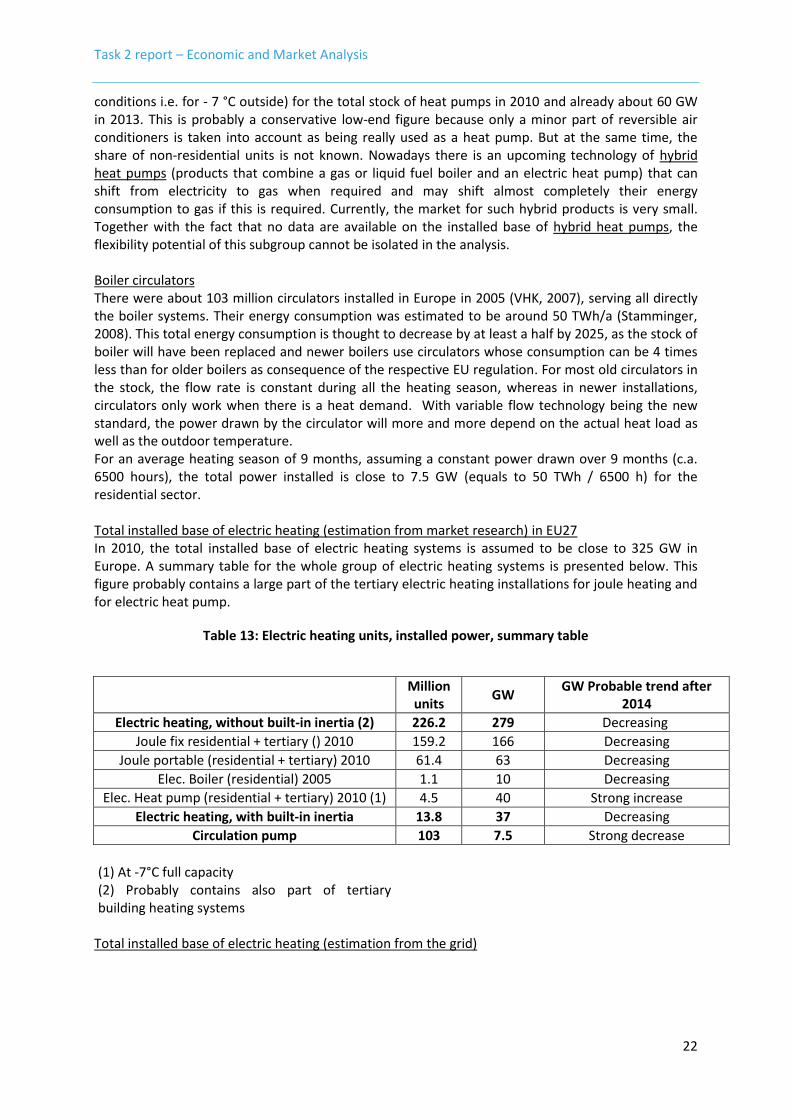
conditions i.e. for - 7 °C outside) for the total stock of heat pumps in 2010 and already about 60 GW in 2013. This is probably a conservative low-end figure because only a minor part of reversible air conditioners is taken into account as being really used as a heat pump. But at the same time, the share of non-residential units is not known. Nowadays there is an upcoming technology of hybrid heat pumps (products that combine a gas or liquid fuel boiler and an electric heat pump) that can shift from electricity to gas when required and may shift almost completely their energy consumption to gas if this is required. Currently, the market for such hybrid products is very small. Together with the fact that no data are available on the installed base of hybrid heat pumps, the flexibility potential of this subgroup cannot be isolated in the analysis. Boiler circulators There were about 103 million circulators installed in Europe in 2005 (VHK, 2007), serving all directly the boiler systems. Their energy consumption was estimated to be around 50 TWh/a (Stamminger, 2008). This total energy consumption is thought to decrease by at least a half by 2025, as the stock of boiler will have been replaced and newer boilers use circulators whose consumption can be 4 times less than for older boilers as consequence of the respective EU regulation. For most old circulators in the stock, the flow rate is constant during all the heating season, whereas in newer installations, circulators only work when there is a heat demand. With variable flow technology being the new standard, the power drawn by the circulator will more and more depend on the actual heat load as well as the outdoor temperature. For an average heating season of 9 months, assuming a constant power drawn over 9 months (c.a. 6500 hours), the total power installed is close to 7.5 GW (equals to 50 TWh / 6500 h) for the residential sector. Total installed base of electric heating (estimation from market research) in EU27 In 2010, the total installed base of electric heating systems is assumed to be close to 325 GW in Europe. A summary table for the whole group of electric heating systems is presented below. This figure probably contains a large part of the tertiary electric heating installations for joule heating and for electric heat pump.
Table 13: Electric heating units, installed power, summary table
Million units
GW GW Probable trend after
2014
Electric heating, without built-in inertia (2) 226.2 279 Decreasing
Joule fix residential + tertiary () 2010 159.2 166 Decreasing
Joule portable (residential + tertiary) 2010 61.4 63 Decreasing
Elec. Boiler (residential) 2005 1.1 10 Decreasing
Elec. Heat pump (residential + tertiary) 2010 (1) (2)
4.5 40 Strong increase
Electric heating, with built-in inertia 13.8 37 Decreasing
Circulation pump 103 7.5 Strong decrease
(1) At -7°C full capacity (2) Probably contains also part of tertiary building heating systems
Total installed base of electric heating (estimation from the grid)
Task 2 report – Economic and Market Analysis
23
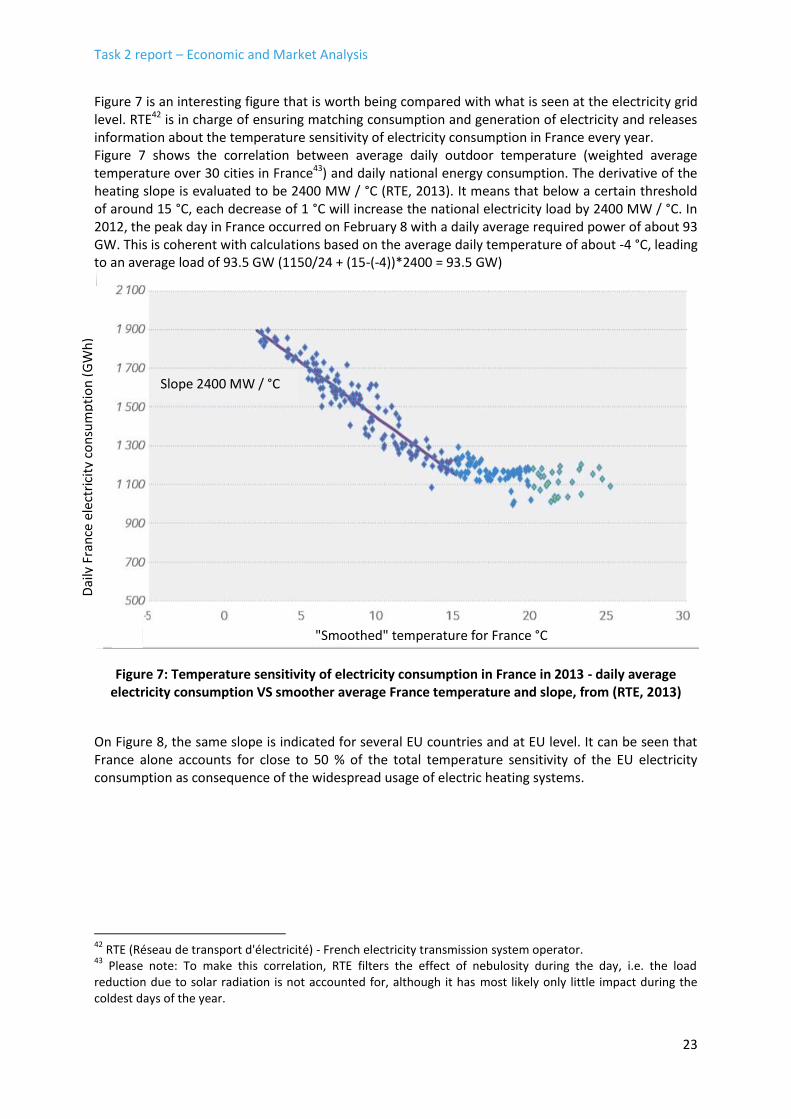
Figure 7 is an interesting figure that is worth being compared with what is seen at the electricity grid level. RTE42 is in charge of ensuring matching consumption and generation of electricity and releases information about the temperature sensitivity of electricity consumption in France every year. Figure 7 shows the correlation between average daily outdoor temperature (weighted average temperature over 30 cities in France43) and daily national energy consumption. The derivative of the heating slope is evaluated to be 2400 MW / °C (RTE, 2013). It means that below a certain threshold of around 15 °C, each decrease of 1 °C will increase the national electricity load by 2400 MW / °C. In 2012, the peak day in France occurred on February 8 with a daily average required power of about 93 GW. This is coherent with calculations based on the average daily temperature of about -4 °C, leading to an average load of 93.5 GW (1150/24 + (15-(-4))*2400 = 93.5 GW)
Figure 7: Temperature sensitivity of electricity consumption in France in 2013 - daily average electricity consumption VS smoother average France temperature and slope, from (RTE, 2013)
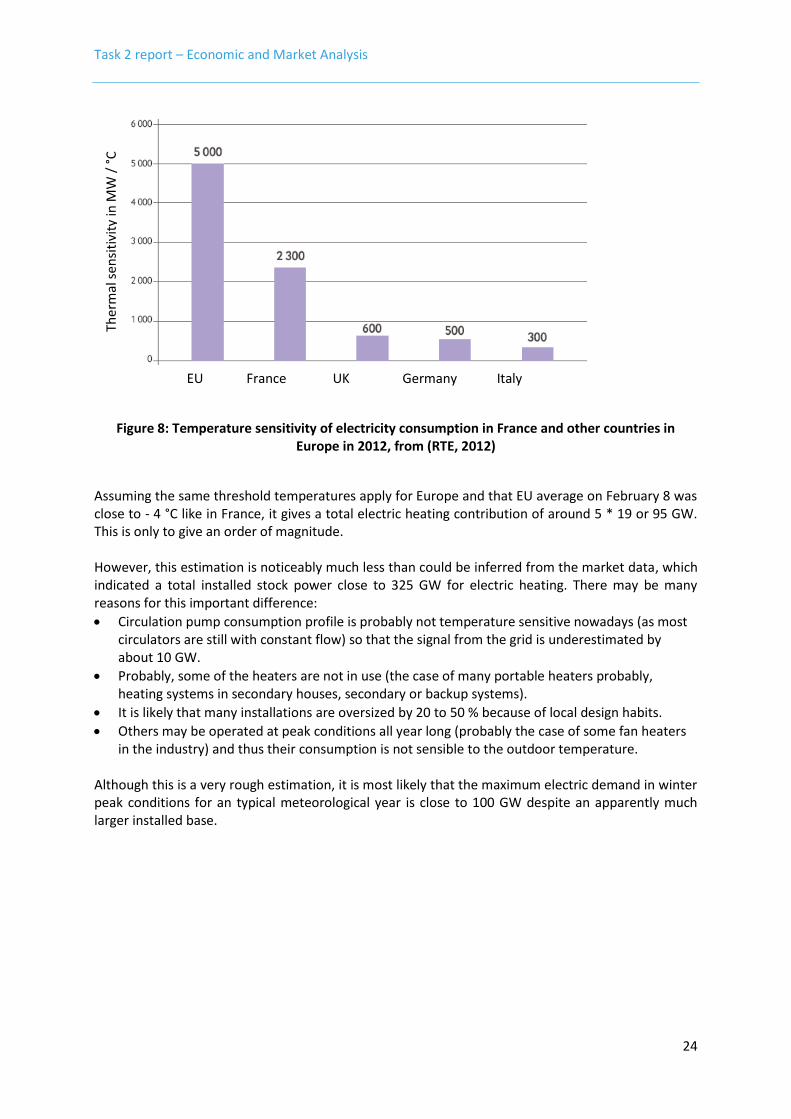
On Figure 8, the same slope is indicated for several EU countries and at EU level. It can be seen that France alone accounts for close to 50 % of the total temperature sensitivity of the EU electricity consumption as consequence of the widespread usage of electric heating systems.
42
RTE (Réseau de transport d'électricité) - French electricity transmission system operator. 43
Please note: To make this correlation, RTE filters the effect of nebulosity during the day, i.e. the load reduction due to solar radiation is not accounted for, although it has most likely only little impact during the coldest days of the year.
Dai
ly F
ran
ce e
lect
rici
ty c
on
sum
pti
on
(G
Wh
)
"Smoothed" temperature for France °C
Slope 2400 MW / °C
Task 2 report – Economic and Market Analysis
24
Figure 8: Temperature sensitivity of electricity consumption in France and other countries in Europe in 2012, from (RTE, 2012)
Assuming the same threshold temperatures apply for Europe and that EU average on February 8 was close to - 4 °C like in France, it gives a total electric heating contribution of around 5 * 19 or 95 GW. This is only to give an order of magnitude. However, this estimation is noticeably much less than could be inferred from the market data, which indicated a total installed stock power close to 325 GW for electric heating. There may be many reasons for this important difference:
Circulation pump consumption profile is probably not temperature sensitive nowadays (as most circulators are still with constant flow) so that the signal from the grid is underestimated by about 10 GW.
Probably, some of the heaters are not in use (the case of many portable heaters probably, heating systems in secondary houses, secondary or backup systems).
It is likely that many installations are oversized by 20 to 50 % because of local design habits.
Others may be operated at peak conditions all year long (probably the case of some fan heaters in the industry) and thus their consumption is not sensible to the outdoor temperature.
Although this is a very rough estimation, it is most likely that the maximum electric demand in winter peak conditions for an typical meteorological year is close to 100 GW despite an apparently much larger installed base.
EU France UK Germany Italy
Ther
mal
se
nsi
tivi
ty in
MW
/ °
C
Task 2 report – Economic and Market Analysis
25
Ventilation 3.1.3.2.
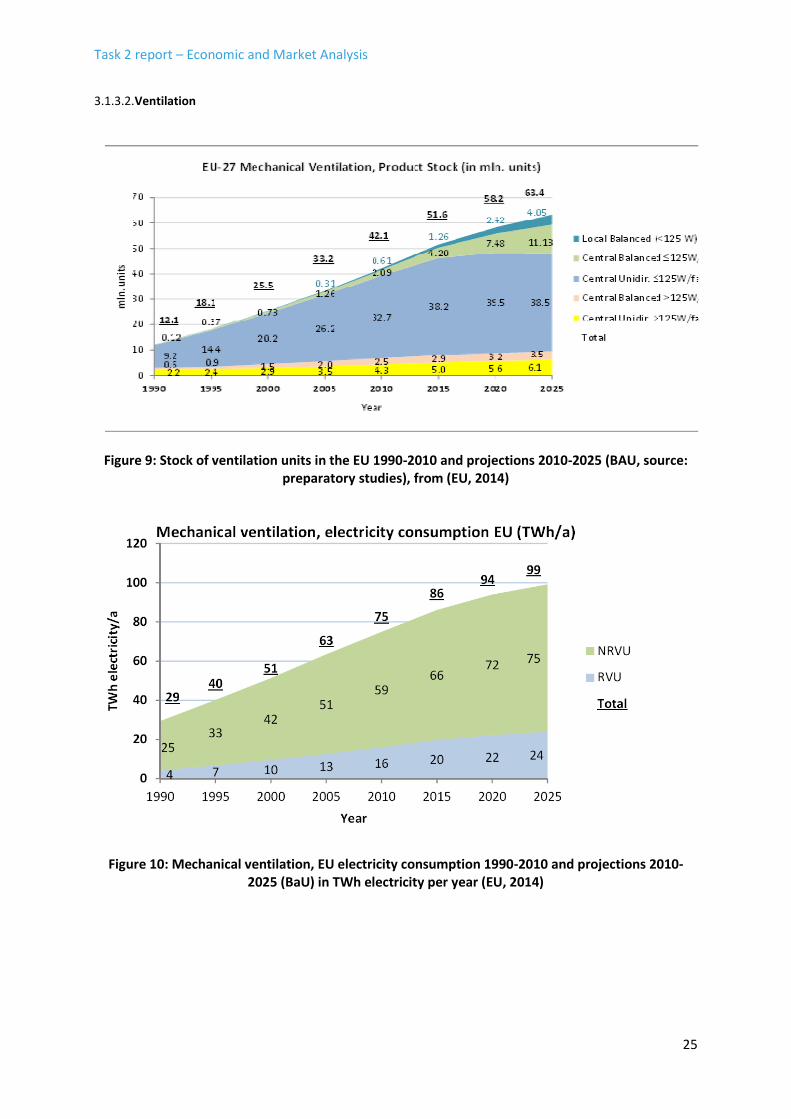
Figure 9: Stock of ventilation units in the EU 1990-2010 and projections 2010-2025 (BAU, source: preparatory studies), from (EU, 2014)
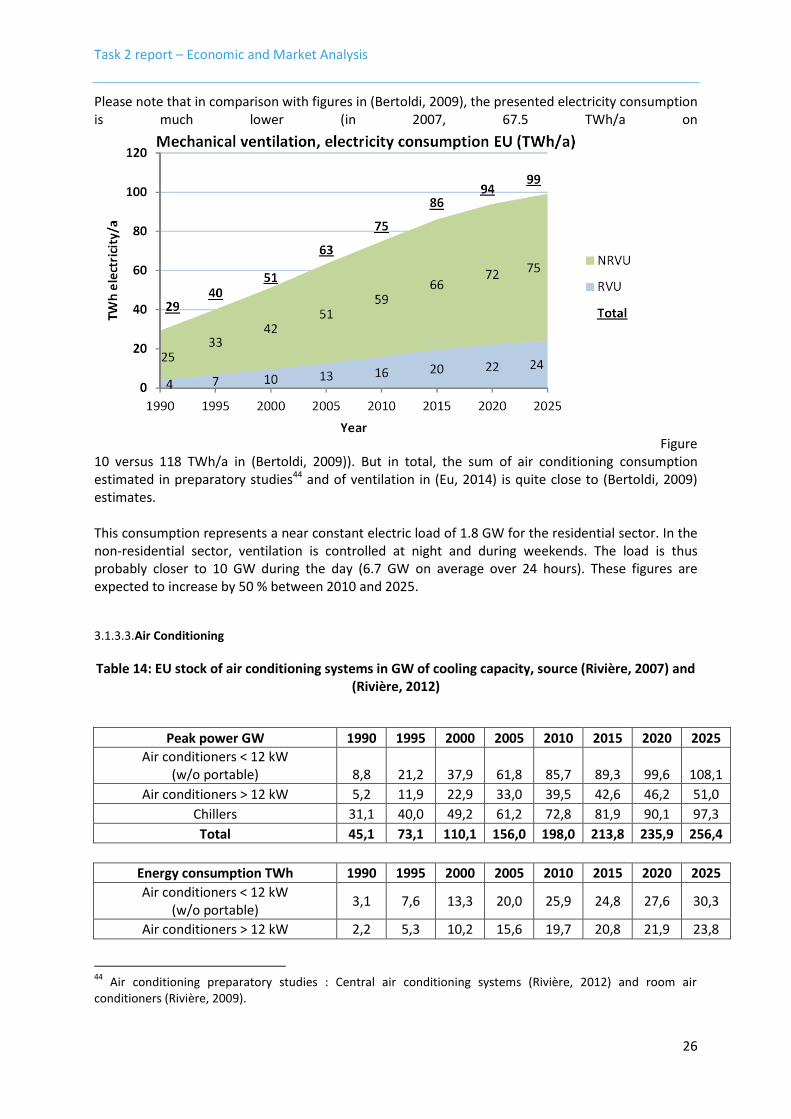
Figure 10: Mechanical ventilation, EU electricity consumption 1990-2010 and projections 2010-2025 (BaU) in TWh electricity per year (EU, 2014)
Task 2 report – Economic and Market Analysis
26
Please note that in comparison with figures in (Bertoldi, 2009), the presented electricity consumption is much lower (in 2007, 67.5 TWh/a on
Figure 10 versus 118 TWh/a in (Bertoldi, 2009)). But in total, the sum of air conditioning consumption estimated in preparatory studies44 and of ventilation in (Eu, 2014) is quite close to (Bertoldi, 2009) estimates. This consumption represents a near constant electric load of 1.8 GW for the residential sector. In the non-residential sector, ventilation is controlled at night and during weekends. The load is thus probably closer to 10 GW during the day (6.7 GW on average over 24 hours). These figures are expected to increase by 50 % between 2010 and 2025.
Air Conditioning 3.1.3.3.
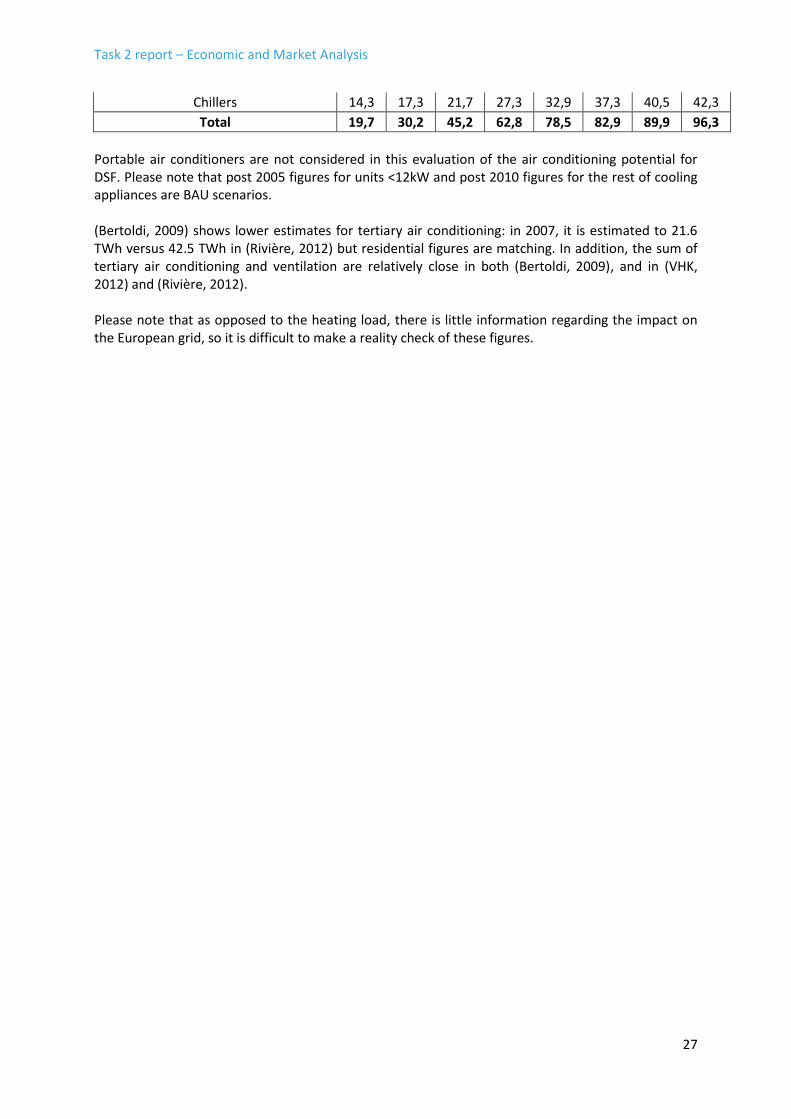
Table 14: EU stock of air conditioning systems in GW of cooling capacity, source (Rivière, 2007) and (Rivière, 2012)
Peak power GW 1990 1995 2000 2005 2010 2015 2020 2025
Air conditioners < 12 kW (w/o portable) 8,8 21,2 37,9 61,8 85,7 89,3 99,6 108,1
Air conditioners > 12 kW 5,2 11,9 22,9 33,0 39,5 42,6 46,2 51,0
Chillers 31,1 40,0 49,2 61,2 72,8 81,9 90,1 97,3
Total 45,1 73,1 110,1 156,0 198,0 213,8 235,9 256,4
Energy consumption TWh 1990 1995 2000 2005 2010 2015 2020 2025
Air conditioners < 12 kW (w/o portable)
3,1 7,6 13,3 20,0 25,9 24,8 27,6 30,3
Air conditioners > 12 kW 2,2 5,3 10,2 15,6 19,7 20,8 21,9 23,8
44
Air conditioning preparatory studies : Central air conditioning systems (Rivière, 2012) and room air conditioners (Rivière, 2009).
Task 2 report – Economic and Market Analysis
27
Chillers 14,3 17,3 21,7 27,3 32,9 37,3 40,5 42,3
Total 19,7 30,2 45,2 62,8 78,5 82,9 89,9 96,3
Portable air conditioners are not considered in this evaluation of the air conditioning potential for DSF. Please note that post 2005 figures for units <12kW and post 2010 figures for the rest of cooling appliances are BAU scenarios. (Bertoldi, 2009) shows lower estimates for tertiary air conditioning: in 2007, it is estimated to 21.6 TWh versus 42.5 TWh in (Rivière, 2012) but residential figures are matching. In addition, the sum of tertiary air conditioning and ventilation are relatively close in both (Bertoldi, 2009), and in (VHK, 2012) and (Rivière, 2012). Please note that as opposed to the heating load, there is little information regarding the impact on the European grid, so it is difficult to make a reality check of these figures.
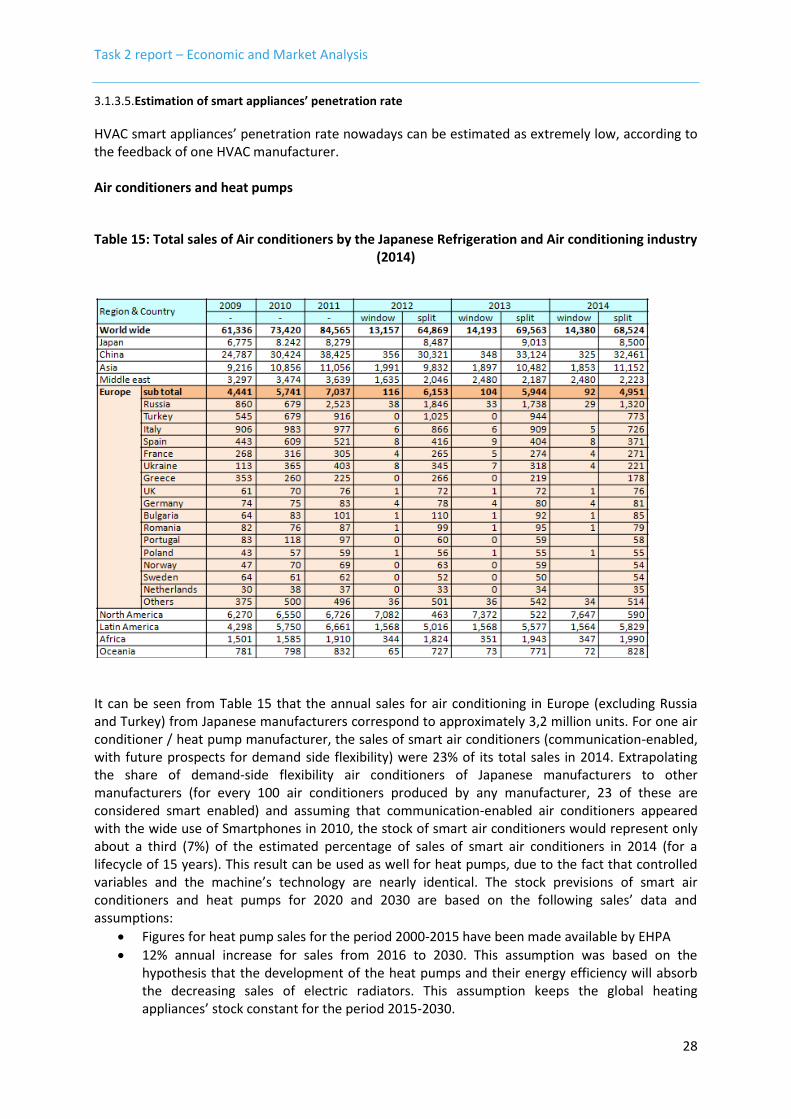
Task 2 report – Economic and Market Analysis
28
Estimation of smart appliances’ penetration rate 3.1.3.5.
HVAC smart appliances’ penetration rate nowadays can be estimated as extremely low, according to the feedback of one HVAC manufacturer. Air conditioners and heat pumps
Table 15: Total sales of Air conditioners by the Japanese Refrigeration and Air conditioning industry (2014)
It can be seen from Table 15 that the annual sales for air conditioning in Europe (excluding Russia and Turkey) from Japanese manufacturers correspond to approximately 3,2 million units. For one air conditioner / heat pump manufacturer, the sales of smart air conditioners (communication-enabled, with future prospects for demand side flexibility) were 23% of its total sales in 2014. Extrapolating the share of demand-side flexibility air conditioners of Japanese manufacturers to other manufacturers (for every 100 air conditioners produced by any manufacturer, 23 of these are considered smart enabled) and assuming that communication-enabled air conditioners appeared with the wide use of Smartphones in 2010, the stock of smart air conditioners would represent only about a third (7%) of the estimated percentage of sales of smart air conditioners in 2014 (for a lifecycle of 15 years). This result can be used as well for heat pumps, due to the fact that controlled variables and the machine’s technology are nearly identical. The stock previsions of smart air conditioners and heat pumps for 2020 and 2030 are based on the following sales’ data and assumptions:
Figures for heat pump sales for the period 2000-2015 have been made available by EHPA
12% annual increase for sales from 2016 to 2030. This assumption was based on the hypothesis that the development of the heat pumps and their energy efficiency will absorb the decreasing sales of electric radiators. This assumption keeps the global heating appliances’ stock constant for the period 2015-2030.
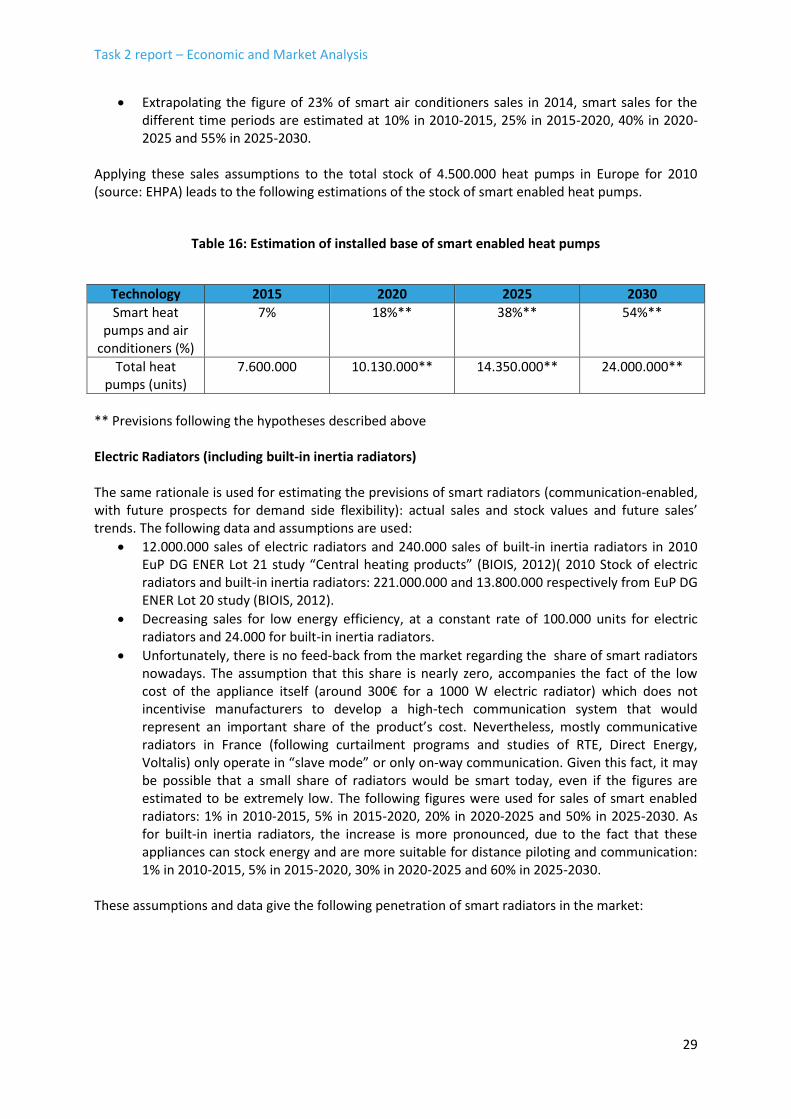
Task 2 report – Economic and Market Analysis
29
Extrapolating the figure of 23% of smart air conditioners sales in 2014, smart sales for the different time periods are estimated at 10% in 2010-2015, 25% in 2015-2020, 40% in 2020-2025 and 55% in 2025-2030.
Applying these sales assumptions to the total stock of 4.500.000 heat pumps in Europe for 2010 (source: EHPA) leads to the following estimations of the stock of smart enabled heat pumps.
Table 16: Estimation of installed base of smart enabled heat pumps
Technology 2015 2020 2025 2030
Smart heat pumps and air
conditioners (%)
7% 18%** 38%** 54%**
Total heat pumps (units)
7.600.000 10.130.000** 14.350.000** 24.000.000**
** Previsions following the hypotheses described above Electric Radiators (including built-in inertia radiators) The same rationale is used for estimating the previsions of smart radiators (communication-enabled, with future prospects for demand side flexibility): actual sales and stock values and future sales’ trends. The following data and assumptions are used:
12.000.000 sales of electric radiators and 240.000 sales of built-in inertia radiators in 2010 EuP DG ENER Lot 21 study “Central heating products” (BIOIS, 2012)( 2010 Stock of electric radiators and built-in inertia radiators: 221.000.000 and 13.800.000 respectively from EuP DG ENER Lot 20 study (BIOIS, 2012).
Decreasing sales for low energy efficiency, at a constant rate of 100.000 units for electric radiators and 24.000 for built-in inertia radiators.
Unfortunately, there is no feed-back from the market regarding the share of smart radiators nowadays. The assumption that this share is nearly zero, accompanies the fact of the low cost of the appliance itself (around 300€ for a 1000 W electric radiator) which does not incentivise manufacturers to develop a high-tech communication system that would represent an important share of the product’s cost. Nevertheless, mostly communicative radiators in France (following curtailment programs and studies of RTE, Direct Energy, Voltalis) only operate in “slave mode” or only on-way communication. Given this fact, it may be possible that a small share of radiators would be smart today, even if the figures are estimated to be extremely low. The following figures were used for sales of smart enabled radiators: 1% in 2010-2015, 5% in 2015-2020, 20% in 2020-2025 and 50% in 2025-2030. As for built-in inertia radiators, the increase is more pronounced, due to the fact that these appliances can stock energy and are more suitable for distance piloting and communication: 1% in 2010-2015, 5% in 2015-2020, 30% in 2020-2025 and 60% in 2025-2030.
These assumptions and data give the following penetration of smart radiators in the market:
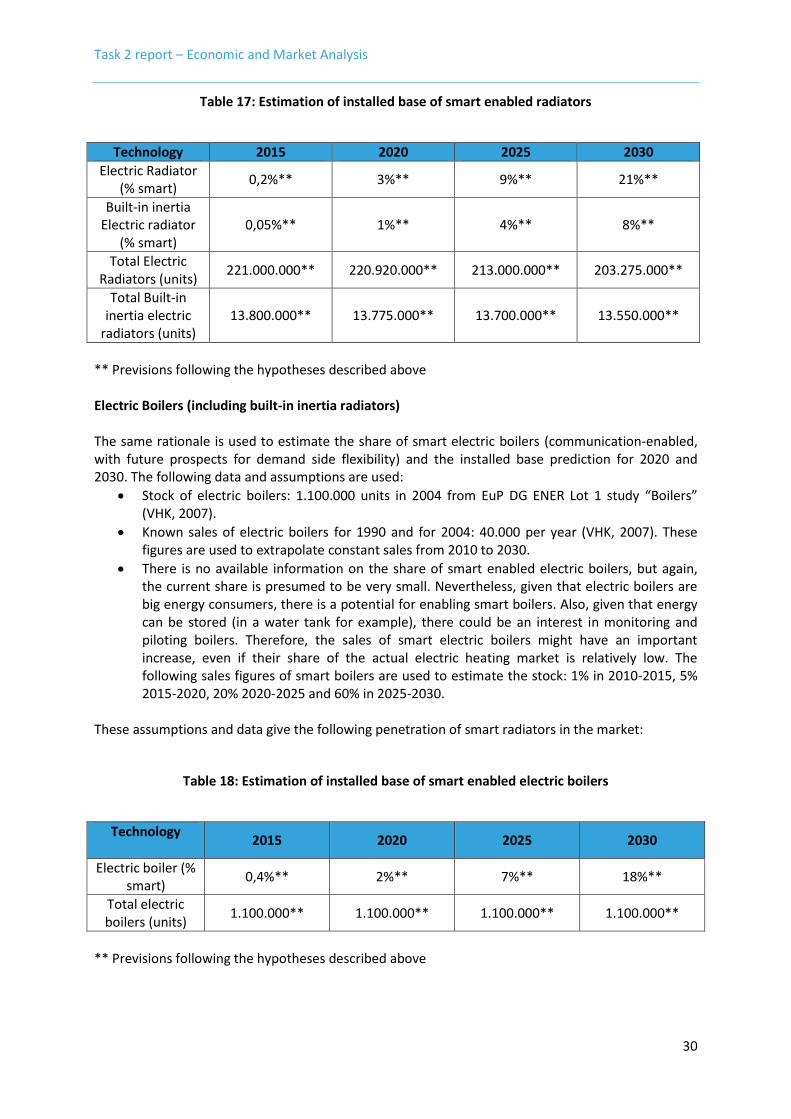
Task 2 report – Economic and Market Analysis
30
Table 17: Estimation of installed base of smart enabled radiators
Technology 2015 2020 2025 2030
Electric Radiator (% smart)
0,2%** 3%** 9%** 21%**
Built-in inertia Electric radiator
(% smart) 0,05%** 1%** 4%** 8%**
Total Electric Radiators (units)
221.000.000** 220.920.000** 213.000.000** 203.275.000**
Total Built-in inertia electric
radiators (units) 13.800.000** 13.775.000** 13.700.000** 13.550.000**
** Previsions following the hypotheses described above Electric Boilers (including built-in inertia radiators) The same rationale is used to estimate the share of smart electric boilers (communication-enabled, with future prospects for demand side flexibility) and the installed base prediction for 2020 and 2030. The following data and assumptions are used:
Stock of electric boilers: 1.100.000 units in 2004 from EuP DG ENER Lot 1 study “Boilers” (VHK, 2007).
Known sales of electric boilers for 1990 and for 2004: 40.000 per year (VHK, 2007). These figures are used to extrapolate constant sales from 2010 to 2030.
There is no available information on the share of smart enabled electric boilers, but again, the current share is presumed to be very small. Nevertheless, given that electric boilers are big energy consumers, there is a potential for enabling smart boilers. Also, given that energy can be stored (in a water tank for example), there could be an interest in monitoring and piloting boilers. Therefore, the sales of smart electric boilers might have an important increase, even if their share of the actual electric heating market is relatively low. The following sales figures of smart boilers are used to estimate the stock: 1% in 2010-2015, 5% 2015-2020, 20% 2020-2025 and 60% in 2025-2030.
These assumptions and data give the following penetration of smart radiators in the market:
Table 18: Estimation of installed base of smart enabled electric boilers
Technology
2015 2020 2025 2030
Electric boiler (% smart)
0,4%** 2%** 7%** 18%**
Total electric boilers (units)
1.100.000** 1.100.000** 1.100.000** 1.100.000**
** Previsions following the hypotheses described above
Task 2 report – Economic and Market Analysis
31
BATTERY OPERATED RECHARGEABLE APPLIANCES
The installed base of battery operated rechargeable appliances is very high. For smartphones only the expected sales figures (IDC, Gartner and JPMorgan) worldwide have gone from 300 million in 2010 to more than 650 million in 2012 and is expected to grow above 1 billion in 2016. The estimated total installed base for smartphones only will exceed 2 billion. For the complete cellular phones market figures range to over 2 billion in 2016 and even 3 billion in 202445. The situation is similar for tablets worldwide, with sales growing from 200 million in 2013 to an expected 350 million in 2016 (Gartner, 2012). Laptop sales in 2014 were 173 million with sales decreasing since 200845. Estimates for the coming years state a stable or slightly decreasing market. For Europe (EU28), the sales of all mobile phones (smartphones and regular mobile phones) range from 227 million in 2009 to 213 million in 2013. Sales of personal navigation devices (PNDs) in Europe peaked at 17 million units in 2008 and fell to less than 10 million units by 2012. Digital camera figures remained around 30 million till 2012. It is expected that this figure will decrease in the subsequent years in favour of smartphones with advanced integrated cameras. Figures for other appliances are harder to find, but it is estimated that all together they represent annual sales of more than 50 million units in the EU46.
3.1.4. RESIDENTIAL ENERGY STORAGE SYSTEMS
In 2015, approximately 25,000 batteries are expected to be operational in Germany47. The German market can currently be considered as the only mature market of home battery storage applications (in combination with PV-installations). In Germany, a large amount of solar panels in combination with a subsidy scheme for residential energy storage (up to 30% of initial investment is subsidized), makes a home battery system attractive. Estimates predict that by 2018, the German market will have stabilized with on average 100,000 units per year. As a result, by 2020, a total of 500,000 units are estimated to be installed by 2020 in Germany48. Recent information provided by Panasonic in the press shows the intention of battery suppliers to target other European markets as well, including France and the UK49. However from the available information today, based on current policies, subsidy schemes and costs, no mature market can be expected by 2020 in EU28 apart from Germany. Few information exists on the potential of residential energy storage systems for 2020 and 2030. Estimates by Roland Berger, Avicenne and BCG indicate that the global market for residential energy storage systems could grow up to 3 to 10 GWh in 2020 and 6 to 15 GWh in 202550. This large range of estimated future potentials makes it clear that experts find it very difficult to make clear projections for the period between 2020-2030. An important reason for this is that the success of residential energy storage systems in 2030 is highly dependent, on the one hand, on the national subsidy schemes for both renewable energy (feed-in tariffs) and home battery systems and on the other hand on the evolution of the purchasing cost of home battery systems.
45
AVICENNE ENERGY, The Rechargeable Battery Market and Main Trends 2014-2025 46
Framework Service contract ENTR/2008/006/Lot 1, Study on the Impact of the MoU on Harmonisation of Chargers for Mobile Telephones and to Assess Possible Future Options 47
http://www.insightenergy.org/ckeditor_assets/attachments/48/pr1.pdf 48
http://www.insightenergy.org/ckeditor_assets/attachments/48/pr1.pdf 49
http://www.greentechmedia.com/articles/read/Panasonic-Enters-Europes-Burgeoning-Home-Battery-Market 50
http://www.insightenergy.org/ckeditor_assets/attachments/48/pr1.pdf
Task 2 report – Economic and Market Analysis
32
In the framework of this study the assumption has been made that in 2015 and 2020 the EU28 market will have a size that is comparable with the size of the German market which may be considered as a conservative estimation. For 2030, the penetration level of residential energy storage systems is highly depending on evolutions in technology and policy decisions therefore no clear assumption can be put forward. In task 7, a sensitivity analysis will be presented analysing several scenario’s with respect to the penetration rate of residential energy storage systems by 2030. Regarding uninterruptible power supply (UPS), the total installed base for 2011 was calculated as 7.5 million UPS units51 in EU27, represented by the following size categories:
Below 1.5 kVA products: 53% of the total installed base
1.5 to 5 kVA products: 41% of the total installed base
Above 5 kVA products: 6% of the total installed base The above figures include mainly UPS systems used in data centres and larger organisations (companies, hospitals, etc.), which are however out of the scope of this study. In Western Europe, in 2013 the annual data centre load requirement was an estimated 79 TWh. So only a very small fraction of these systems is located in residential and small business setups. No exact figures were found for these specific products.
3.1.5. LIGHTING
Please find below an overview of the estimated stock year 2013 based on the Ecodesign Preparatory Study on Light Sources (ENER Lot 8/9/19 (VITO, 2015):
LFL: Linear fluorescent lamp: 2209 million units
CFL: Compact fluorescent light: 4406 million units
Tungsten: 2569 million units
GLS: General lighting service ('incandescent'): 561 million units
HID: High intensity discharge lamp: 84 million units
LED: Light emitting diode: 144 million units Separately, the estimated number of street lighting luminaires in EU-25 is about 60 million (2004 figures) (VITO, 2007).
3.2. ECONOMIC INSTRUMENTS - REMUNERATION MECHANISMS
The pre-conditions for an uptake of smart appliances and implementation of smart grids are:
that the EU Member States have provided access to demand side resources according to the Energy Efficiency Directive art. 15, item 8. The requirement is that the TSOs and DSOs treat DR providers including aggregators, in a non-discriminatory manner, on the basis of their technical capabilities. This is however subject to technical constraints inherent in managing networks.
that the smart appliances need to be in the homes, offices etc. and the end-users must also have accepted that the BRPs, aggregators etc. control their energy usage in the DR perspective, which again requires sufficient incentives and remuneration for the end-users.
51
ErP Lot 27 – Uninterruptible Power Supplies, Preparatory Study - Final Report
Task 2 report – Economic and Market Analysis
33
In order to boost the market for demand response, the EC emphasizes the importance of market-based and dynamic and transparent incentives that reward participation through dynamic prices without unnecessary constraints52. First, it should be used to transfer (part of) the value of the flexibility of smart appliances to end-consumers53. Second, it is a key to incentivize end-consumers to shift their consumption and offer the flexibility of smart appliances when the value for society is high. This is the case when the system is under stress and prices (day-ahead prices and/or imbalance prices) are high. A proper remuneration system will also increase the level of self-consumption of households that have a combination of local production (e.g. solar panels), storage (e.g. batteries) and flexible consumption (e.g. smart appliances) at their disposal. To note that financial incentives through a dynamic pricing scheme on itself are not sufficient to establishing a structural change in consumer behaviour54. Task 3 of this report will discuss more in detail the drivers for consumer behaviour, besides financial incentives. In this section, an overview is given of the most important remuneration mechanisms existing today. A proper implementation of these dynamic tariffs requires smart meters that enable the communication between the meter of the end-consumer and the utility.
3.2.1. USE CASES
As will be further explained in Task 3, smart appliances can be used for different use cases. Two distinct use cases can be defined, based on two important time blocks in the market: day-ahead versus real-time.
1) Day-ahead use case In day-ahead, the schedule of electricity production and consumption is determined. In order to match supply and demand, balance responsible parties have several possibilities. First, they can adapt their production volume by optimizing own generation units or by participating to the various European Power Exchanges that enable them to trade volumes in the short term (day-ahead). The prices on the power exchange are determined on an hourly basis and are published in a transparent way. The prices on the day-ahead market reflect the marginal cost of the last unit that is needed to produce these volumes. DSF could directly participate in the day-ahead market platform. The Balancing Responsible Parties (BRPs) have also the possibility to modify the load in order to match supply and demand. Load reduction or load shifting can avoid costs of additional production during hours with high prices. In this case, the demand side flexibility is directly integrated in the portfolio of the BRP. Independent of how demand side flexibility through the use of smart appliances is offered in day-ahead, it will
52
https://ec.europa.eu/energy/sites/ener/files/documents/com_2013_public_intervention_swd07_en.pdf 53
The value of smart-appliances is also beneficial for consumers without smart appliances or dynamic remuneration scheme. These consumers will benefit indirectly from the flexibility offered by flexible consumers, via an average decrease of system costs for balancing which could be passed through towards all consumers via a reduction in grid tariffs or a reduction in fixed costs of the energy supplier. 54
Boork M, Thomtén M, Brolin M, Uyterlinde M, Straver K, Kraan C, Kleine-Hegermann K, Laes E, Valkering P, Maggiore S. Key success factors and barriers to end-user engagement in smart grid projects. Paper presented at the 2014 BEHAVE conference, London. Available from: <http://behaveconference.com/wp-content/uploads/2014/08/F_Magdalena_Boork_Technical_Research_Institute_of_Sweden.pdf>
Task 2 report – Economic and Market Analysis
34
support the matching of supply and demand at a lower cost. In case of high estimated production of RES during certain hours, load could be shifted or increased during these hours. In case of high estimated load, a decrease or shift in load will have a downward effect on prices.
2) Imbalance use case In real-time, deviations are observed between supply and demand. Different reasons can explain these deviations. Changing weather conditions are the primary source of these deviations. The realised production of renewable energy sources (wind and solar) is highly dependent on the weather. The demand or load is also affected by weather conditions such as temperature and cloud cover. In addition, non-weather related causes such as sudden outages of generation units or human errors e.g. in load forecasts can also explain why there is an imbalance between supply and demand in real-time. The TSO is responsible for the stability of the grid and security of supply at the lowest cost in real-time or in near real-time. It will monitor in real-time the deviations of the grid and activate the necessary ancillary services in order to balance the system. Ancillary services can be provided by both, generation and load management, dependent on the type of ancillary service product. Dependent on the country, ancillary services are contracted by the TSO via yearly, monthly or weekly tenders. Today, the three categories of ancillary services are FCR55, FRRa56 and FRRm57. The relevant ancillary services for demand response today are FCR and FRRm. FRC is used by the TSO to ensure that the grid frequency stays within a certain range within the interconnected high-voltage European system. FRRm is used by the TSO to cope with major imbalance and congestion issues. The cost of the activation of ancillary services (FRRa and FRRm) is reflected in the imbalance price published afterwards. As each BRP is responsible for the balance of its own portfolio, their individual imbalances will be invoiced based on the imbalance prices. Similar to the day-ahead use case, demand side flexibility can be part of the imbalance use case in different ways. First, demand side flexibility can participate directly in the market of ancillary reserves (FCR and FRRm). An example of demand side flexibility participating to the market of FRRm is the product R3DP in Belgium (see later). The response time for FRRm is on average 15 minutes, which is sufficient for demand side flexibility to participate. In general, it is more difficult for demand side flexibility to participate in the market of FCR. In most countries, the required volumes, product characteristics (fast response time (15 seconds), duration, symmetrical product) and the requirement to be connected at the transmission grid are important barriers for demand side flexibility to participate in the market for primary reserve58. Applications that respect these constraints are for example applications based on batteries, connected at the transmission grid. Nevertheless, efforts are made by TSOs to enable demand side flexibility to participate. An example is the Belgian TSO Elia who created a specific product (R1 Load) that takes into account the characteristics of demand side
55
FRC = frequency containment reserves or currently called primary reserves. FCR are continually activated and have a fast response time (15 sec). 56
FRRa = automated frequency restoration reserves or currently called secondary reserve. FRRa is activated on automated basis. 57
FRRm = manual frequency restoration reserves of currently called tertiary reserves. 58 http://www.smartenergydemand.eu/wp-content/uploads/2015/09/Mapping-Demand-Response-in-Europe-
Today-2015.pdf
Task 2 report – Economic and Market Analysis
35
flexibility and allows participation of demand side flexibility via aggregators to the market of FCR59. Today, the product R1 load is only possible for resources connected at the transmission grid. Alternatively, demand side flexibility can be used by the BRPs in order to optimize the balancing of their portfolio which results in a decrease of their imbalance costs. Note: besides the two main use cases as discussed above, demand side flexibility could serve other objectives as well, such as DSO grid congestion cases, reactive power voltage support in the transmission grid,…. However, these use cases are less mature (e.g. DSOs are today not incentivized to contract flexibility as costs for flexibility are not remunerated) and the value of flexibility from smart appliances cannot be estimated based on today’s situation.
3.2.2. OVERVIEW OF REMUNERATION MECHANISMS60
The dynamics of different remuneration mechanisms are defined by the number of time periods per day, the price update frequency, the price difference between periods and the presence of special events (with limited duration and occurrence) that trigger higher or lower prices. Responses to price signals by end-users can be manual or fully automated. Most tariff structures can be classified in following categories:
1. Time-Of-Use Pricing (TOU)
Time-Of-Use Pricing divides the day into a predefined set of timeperiods (typically periods of 3 to 6 hours). The price for each period is constant and predetermined. The most basic form of Time-Of-Use Pricing is the day/night tariff where two periods with different prices are distinguished. More advanced TOU-schemes (with more time periods) could be introduced in order to shift the average consumption pattern in such a way that it follows closer the estimated production profile of RES and reduces peak demand. This static pricing mechanism does not take into account the dynamic real-time system conditions. The price the end-consumers receive for the energy that is shifted will reflect the average system cost over a certain period of time.
2. Real Time Pricing (RTP) Dynamic Real-Time Pricing is based on real-time hourly or quarter-hourly prices or on day-ahead hourly prices. Real Time Pricing is reflecting the actual state of the system and the related system costs. Real-time Pricing provides a dynamic temporal resolution in passing through real-time prices to consumers. However, as it requires a continuous monitoring of prices, an adequate and automated control system is required.
3. Critical consumption pricing (critical peak pricing CPP” and critical peak rebate)
59 http://www.elia.be/~/media/files/Elia/Products-and-services/Ondersteunende%20diensten/R1-
load_general_framework_2015-2018-update_February_2016.pdf 60
Additional information on tariff schemes can be found in: http://www.aemc.gov.au/getattachment/04f6b84c-d839-4cc5-9f4b-35f9e321c3c5/The-Brattle-Group-%E2%82%AC%E2%80%9C-Managing-the-costs-and-benefi.aspx and on the project website of the S3C (“Smart Consumer, Smart Customer, Smart Citizen”) project www.s3c-project.eu. The S3C project analyses new options deriving from smart grid technologies for the activation and long-term engagement of end users.
Task 2 report – Economic and Market Analysis
36
In case of high anticipated load and resulting prices or high production of RES, a critical event is defined during a specified time period by the utility. During this time period, the energy price is raised or decreased significantly. As a result, critical peak pricing is used to reduce the critical peak load (in case of grid overload) or to increase the load (in case of excess power from RES). Critical peak rebate is a similar concept where end-consumers receive a rebate in case they consume less than expected (in case of grid overload) or in case they consume more than expected (in case of excess power from RES). These remuneration mechanisms are only used for a limited number of major events during the year.
4. Variable Peak Pricing (VPP)
This pricing mechanism is a hybrid form of TOU Pricing/CPP Pricing and RTP Pricing. The time blocks are predetermined, such as within the TOU pricing mechanism/or for a CPP event. However, the price for each block is not predetermined and is based on real-time market conditions.
5. Capacity remuneration The pricing schemes explained before will remunerate the flexibility by pricing the energy shifted (€/MWh). It is also possible to remunerate the owner of a smart appliance upfront based on the available capacity (€/MW). This capacity remuneration can be fixed on an annual base, or even on shorter time periods such as a monthly base. Historically, capacity remuneration mechanisms were used in the context of the remuneration of ancillary services for balancing purposes. This capacity remuneration can be combined with energy remuneration in case of activation of the flexibility.
6. A combination of several tariff schemes As explained, smart appliances can be used for different use cases. Therefore, dependent on the category of smart appliances, several of the remuneration mechanisms can be combined. A common combination is a TOU-tariff together with a CPP mechanism for special events.
7. Distribution grid fee power component minimization The distribution grid fee may consist of a power component which means that the fee paid by the end consumer is at least partially based on the highest power consumption and/or production at the connection of the end consumer, where this highest power is then for instance the highest average quarter hour power value measured in an interval of, for instance, 1 month. In this case, it may be profitable for the consumer to use DSF to minimize this highest power value and in this way reduce his/her distribution grid costs.
8. Feed-in tariffs lower than consumption tariff If the tariff to buy electricity is higher compared to the reward received by consumers for their (PV) production, then it may be profitable for the end consumer to use DSF to maximize local consumption of locally produced energy. This is, for instance, already the case in Germany.
9. Other incentives (e.g. reduction purchase price) Besides remuneration for the offered flexibility, additional incentives to stimulate the investment in smart appliances could be considered. For example a reduction in the purchasing price of eligible appliances could lower the barrier for end-consumers to buy smarter appliances. Note should be
Task 2 report – Economic and Market Analysis
37
taken of the fact that additional measures (see 2.3.4) are necessary to guarantee that consumers will actually use the flexibility inherent in the appliance they have purchased. A dynamic remuneration mechanism will not only enable consumers to modify their consumption pattern, based on the requirements of the grid (peak demand, profile of RES). Remuneration measures such as the power component in distribution grid fees (see 2.3.2) will also stimulate consumers, who have local production via e.g. solar panels, to match as much as possible their local production profile with their local consumption profile.
3.2.3. EXAMPLES OF EXISTING (DR) PRACTICES
The Smart Energy Demand Coalition (SEDC) has assessed the DR activities for EU Member States, Norway and Switzerland and reported the results in a report published in April 201461. SEDC is an industry group dedicated to the development of demand side program development. SEDC has assessed the access for DR providers. In addition, there may exist DR activities in not-open power markets performed by the national energy regulatory operators though these typically would be targeted larger energy consumers such as manufacturing industry. The report has mapped the progress of the Member States in meeting the requirements of Article 15, item 8 and reviewed the regulatory structures of 13 Member States, Norway and Switzerland. The report summarizes the progress of the EU Member States as:
Commercially active: Great Britain, Ireland, France, Belgium, Finland;
Partial opening: The Netherlands, Austria, Sweden;
Preliminary development: Germany, Poland, Denmark, Slovenia;
Closed: Spain, Italy;
No thorough regulatory review, but on first review, DR development not visible in the remainder of the Member States.
The conclusion is that only five Member States have reached a level with access for commercial DR providers. There has however been development from 2013 to 2014 and it is expected to continue developing. Examples of dynamic tariff schemes that are tested or applied for the residential segment are listed below. The first dynamic pricing mechanisms are mainly developed within countries that experience a need for demand side flexibility. For example countries with a high share of renewable energy (Nordic countries, Germany, Belgium, Italy) or an important share in electric heating, resulting in high peak demand during winter (e.g. France, Nordic countries), have taken the first steps towards introducing dynamic pricing in the market.
Sweden: In Sweden, the roll-out of smart meters has been completed. Since 2012, energy providers started to offer retail consumers electricity contracts based on day-ahead hourly prices62. Until now, only a small part of customers have adopted real-time-price contracts. This is an example of real-time pricing. In general, there is an evolution to energy contracts based on hourly prices. An important condition is that hourly metering for these consumers
61
“Mapping DR in Europe Today. Tracking Compliance with Article 15.8 of the Energy Efficiency Directive”. Smart Energy Demand Coalition. April 2014. 62
http://energia.fi/sites/default/files/dokumentit/ajankohtaista/Tapahtumat/2013/ST-pooli/esitys_soderbom.pdf
Task 2 report – Economic and Market Analysis
38
is available. A study on the impact of these dynamic pricing schemes in Sweden highlights the fact that not only RTP-tariffs are needed, they have to be accompanied by appropriate home automation technologies on the one hand and the necessary feedback strategies in order for consumers to understand and modify their daily consumption pattern63.
France: EDF offers the Option Tempo product to consumers. Days are categorized according to three colours: blue, white and red reflecting the state of the system. On a daily base, the colour of the day is defined and communicated and prices vary accordingly. This is an example of critical pricing where the utility determines a special event during a limited number of days64. The consumption of consumers is not automatically adapted based on these prices.
The Netherlands: Eneco organizes the automated smart charging of Tesla electric vehicles based on energy market prices65. A special app keeps track of the energy prices (via direct communication with the energy exchange) and controls automatically the charge speed of the battery.
Belgium: Pilot project Linear66 tested in a field test a TOU pricing mechanism. There were 6 fixed time periods defined upfront. Prices were determined on a daily base, based on Belpex day-ahead market prices and the predicted generation of wind and solar. The average daily price spread was around 0,08€/kWh.
Belgium: the Transmission System Operator in Belgium has designed a new product for tertiary reserve ‘R3Dynamic Profile’. This product targets sheddable load and production at distribution grid level. The remuneration is based on a capacity fee67. The average capacity fee for R3DP is estimated around 3,38 €/MW/h.
Germany: the AlpEnergy project (Allgaeu trial site)68 tested two types of TOU tariffs. The first tariff was a more static tariff type with 2 time periods with a yearly price update. The second tariff was a more dynamic tariff with 5 time periods with an update of the price every 36 hours. The price spread was in both TOU tariffs equal to 0,05€/kWh. Results showed an average load shift of 2% for the more static tariff and an average load shift of only 1% for the more dynamic tariff, indicating that in case of manual response, tariffs should not be too complex.
Germany: the German smart grid project eTelligence69 developed a combination of a TOU tariff with two price levels (price spread of 0,26€/kWh), and in addition so-called bonus (0€/kWh) and malus events (1,2€/kWh) that were based on the availability of RES (announced day-ahead). Consumers had to respond manually on the observed prices.
63
http://www.researchgate.net/publication/254864389 64
https://particulier.edf.fr/fr/accueil/facture-et-contrat/contrat/consulter-les-jours-ejp-et-tempo/option-tempo.html 65
http://cleantechnica.com/2015/03/18/eneco-smartcharging-app-dutch-tesla-drivers-charge-price-low/ 66
http://www.linear-smartgrid.be/en 67
http://www.elia.be/~/media/files/Elia/Products-and-services/ProductSheets/S-Ondersteuning-net/S_Grid%20support_En.pdf 68
http://www.alpenergy.net/images/stories/AlpEnergy_Final_Guideline.pdf 69
Agsten M. et al. eTelligence Abschlussbericht. Neue Energien brauchen neues Denken. Oldenburg: EWE AG; 2012.
Task 2 report – Economic and Market Analysis
39
Electricity savings up to 20% in case of malus events and additional electricity consumption up to 30% during bonus events were observed.
Germany: The E-DeMa trial project offered end-users the choice to switch their remuneration mechanism on a monthly basis. Most end-users opted eventually for a relatively static and simple TOU tariff, again emphasizing that tariff structures that are too complex hinder the adoption of dynamic pricing in case of manual response70. The average price spread was between 0,10 and 0,20€/kWh.
Germany: The MoMa project71 tested a RTP tariff with daily price updates (price spread of 0,075€/kWh). The project, amongst others, wanted to test the flexible relationship between price changes and the behavioral changes of consumers who respond to prices manually. Results showed that on average a price increase of 100% gave a decrease in demand of around 10%.
Norway: Nord-Trøndelag Elektrisitetsverk (NTE), announced in March 2014 that it would partner with Swedish ICT company Maingate to run a pilot project investigating customers' manual response on real-time electricity prices.72
Italy: A simple TOU tariff is introduced to all households in Italy, consisting of two time blocks per day (peak and off peak), with quarterly price updates. Consumers respond manually to the observed prices. The maximum price spread was equal to 0,02€/kWh. The results showed a shift of 1% of total energy consumption from peak to off-peak hours with respect to the period prior to the introduction of the TOU tariff 73. Results have shown that consumers barely changed their consumption pattern. Main reason was the fact that the price spread was not sufficient to stimulate consumers to shift their consumption74.
UK: The CLNR project (Customer Led Network Revolution) in the UK uses a three-rate TOU tariff which is updated once a year. The average price spread between the highest and the lowest price was around 0,20€/kWh. Consumers respond manually to the observed prices. Preliminary field trial results showed that the average half-hourly load reduced by 14% during the peak period (between 4pm-8pm)75.
US: In the state Illinois, the two main state-utilities (ComEd and Ameren Illinois) have introduced RTP-programmes as from 2007, but in the course of 2014, only 1% of their customer base had adopted the new tariff 76. Several reasons have been mentioned why these programs are not yet embraced by a large audience. Elements highlighted in order to increase the number of participants are: increasing awareness and understanding of dynamic
70
Becher S et al. Verbundprojekt E-Energy: E-DeMa, Entwicklung und Demonstration dezentral vernetzter Energiesysteme hin zum E-Energy Markplatz der Zukunft. Essen: RWE AG; 2013. 71
Kießling A. Modellstadt Mannheim Abschlussbericht. Beitrag von moma zur Transformation des Energiesystems für Nachhaltigkeit, Beteiligung, Regionalität und Verbundenheit. Mannheim: MVV AG; 2013. 72
http://www.m2mnow.biz/2014/03/27/19247-maingate-nte-together-towards-tomorrows-energy-market/ 73
Maggiore S, Gallanti M, Grattieri W, Benini M. Impact of the enforcement of a Time-of-Use tariff to Residential customers in Italy. Paper presented at the CIRED 22nd International Conference on Electricity Distribution, June 2013 74
http://www.slideshare.net/drsea/07-maggiore-simoneieadsmgrazoctober2014 75
British Gas. Initial Time of Use tariff trial analysis. Report CLNR-L015, London: British Gas; 2013. 76
http://www.power-technology.com/features/featuredynamic-energy-pricing-will-the-public-buy-in-4294096/
Task 2 report – Economic and Market Analysis
40
pricing by using simple communication, easy enrolment in the program and proof towards customers that participation is not complex in case of manual response77.
US: Austin Energy and CPS Energy offer consumers a free thermostat or a thermostat rebate in exchange for the automated control on the air-conditioning. This could be considered as an example of an alternative remuneration mechanism to incentivize consumers to offer the flexibility of their smart appliances78.
Australia: Consumers are offered a rebate on the cost of an air conditioner, compliant with a demand response platform and activated at installation. The load of the air conditioner is than automatically modulated by a third party79.
UK: Retailer Tempus Energy offers electricity consumers a flat rate tariff, significantly below normal market prices. In exchange, Tempus Energy is allowed to install a smart meter and demand response equipment at the user’s residence and to manage the user’s flexibility automatically. Tempus Energy uses this flexibility to obtain lower prices at the day ahead energy market and to reduce balancing costs. The reduced flat tariff can thus be seen as a very simple and easy to understand demand response capacity fee80.
3.2.4. FACTORS FOR THE ESTABLISHMENT OF A SUCCESSFUL DR REMUNERATION MECHANISM
The analyses of different smart grid pilot project within the context of the S3C project81 highlighted some key elements that determine the success of a Demand Response remuneration mechanism82.
The information from the remuneration mechanism has to be clear and understandable The price updates and special events has to be announced timely The financial incentives need to be high enough Additional incentives (besides financial) support behavioural change (such as providing the
end-user with a feeling of achievement) Manual control can support end-user acceptance as it is the first step in the learning process Automated control can prevent response fatigue, especially in case of more complex
remuneration mechanisms For both use cases described earlier, the state of the system needs to be taken into account in the pricing system. This makes a remuneration mechanism only based on Time-of-Use Pricing less appropriate. However, TOU pricing could be combined with other more real-time pricing mechanisms.
77
http://aceee.org/files/proceedings/2010/data/papers/1967.pdf 78
https://nest.com/energy-partners/austin-energy/ 79
https://www.energex.com.au/__data/assets/pdf_file/0006/126375/PeakSmart-Air-Con-Terms-and-Conditions.pdf 80
tempusenergy.com 81
S3C consortium. Report on state-of-the-art and theoretical framework for end user behaviour and market roles. S3C project Deliverable 1.1. Available from: < www.s3c-project.eu > 82
Additional information can be found in: Kim J-H, Shcherbakova A. Common failures of demand response. Energy 2011; 36: 873-880. and Faruqui A, Hledik R, Sergici S. Piloting the Smart Grid. The Electricity Journal 2009; 22: 55-69.
Task 2 report – Economic and Market Analysis
41
In the case of the day-ahead use case, TOU pricing would allow to change the average daily pattern of consumption in order to match it better with the available generation. In addition, CPP pricing could incentivize an additional load shifting in case the system is under stress due to extreme events (power plant outage, extreme weather conditions,…). TOU pricing is in theory not appropriate for the imbalance use case, as no predictable patterns should be present in the imbalance market. In order to allow smart appliances to value their flexibility for this use case, real-time pricing is needed. This can be only real-time-pricing, or a combination with for example a capacity fee. Independently of the remuneration mechanism, the price incentive should be large enough, not too complex and reflecting the underlying cost of the energy system. These elements will make it easier for the end-user to understand the pricing mechanism and as a result, respond in the most optimal way. In addition, it is important to analyse in depth the typical smart appliance-related practices in order to determine the optimal remuneration mechanism.
Task 2 report – Economic and Market Analysis
42
LIST OF REFERENCES
Agsten M. et al. eTelligence Abschlussbericht. Neue Energien brauchen neues Denken. Oldenburg: EWE AG; 2012. Argus Insights (2015), http://www.argusinsights.com/connected-home-release Becher S et al. Verbundprojekt E-Energy: E-DeMa, Entwicklung und Demonstration dezentral vernetzter Energiesysteme hin zum E-Energy Markplatz der Zukunft. Essen: RWE AG; 2013. Benchmarking smart metering deployment in the EU-27 with a focus on electricity, COM(2014) 356 final, http://eur-lex.europa.eu/legal-content/EN/TXT/PDF/?uri=CELEX:52014DC0356&from=EN Bertoldi, Atanasiu (2009). Electricity Consumption and Efficiency Trends in European Union – Status Report 2009, European Commission DG Joint Research Centre BIO Intelligence. (2014). THE CONNECTED-HOME REPORT: Forecasts And Growth Trends For The Leading 'Internet Of Things' Market BIO Intelligence. (2012). Preparatory Studies for Ecodesign Requirements of EuPs (III), ENER Lot 20 – Local Room Heating Products, DG ENER BIO Intelligence. (2012). Preparatory Studies for Ecodesign Requirements of EuPs (III), ENER Lot 21 – Central heating products that use hot air to distribute heat, DG ENER Boork M, Thomtén M, Brolin M, Uyterlinde M, Straver K, Kraan C, Kleine-Hegermann K, Laes E, Valkering P, Maggiore S. Key success factors and barriers to end-user engagement in smart grid projects. Paper presented at the 2014 BEHAVE conference, London. Available from: http://behaveconference.com/wp-content/uploads/2014/08/F_Magdalena_Boork_Technical_Research_Institute_of_Sweden.pdf British Gas. Initial Time of Use tariff trial analysis. Report CLNR-L015, London: British Gas; 2013. Decision 406/2009/EC European Heat Pump Association. (2014). Market Statistics report 2014, Executive Summary. http://www.ehpa.org Joint Research Centre. (2014) JRC Technical Reports - Ecodesign for Commercial Refrigeration. Preparatory study update. Final report Kemna, R., (VHK), (2014), Ecodesign Impact Accounting Part 1 – Status Nov 2013, May 2014 Kießling, A. (2013). Modellstadt Mannheim Abschlussbericht. Beitrag von moma zur Transformation des Energiesystems für Nachhaltigkeit, Beteiligung, Regionalität und Verbundenheit. Mannheim: MVV AG KPMG. (2011). Power Sector Development in Europe – Lenders’ Perspectives 2011 - A survey of banks on the prospects for power infrastructure financing in Europe Maggiore, S, Gallanti, M, Grattieri, W, Benini M. (2013). Impact of the enforcement of a Time-of-Use tariff to Residential customers in Italy. Paper presented at the CIRED 22nd International Conference on Electricity Distribution, June 2013 PriceWaterHouse et al. (2009). Ecodesign of Laundry Dryers - Preparatory studies for Ecodesign requirements of Energy-using-Products (EuP) – Lot 16, Final report, March 2009 Ricardo AEA, University of Coimbra & Intertek. (2014). ErP Lot 27 – Uninterruptible Power Supplies, Preparatory Study - Final Report, June 2014 S3C consortium. Report on state-of-the-art and theoretical framework for end user behaviour and market roles. S3C project Deliverable 1.1. Available from: < www.s3c-project.eu > tempusenergy.com VHK, VITO, Viegand Maagøe A/S and Wuppertal Institut. (2014). "Omnibus" Review Study on Cold Appliances, Washing Machines, Dishwashers, Washer-Driers, Lighting, Set-top Boxes and Pumps, Final report, March 2014 VHK. (2007). Preparatory Studies for Ecodesign Requirements of EuPs (I), ENER Lot 1 – Boilers, DG ENER VHK. (2007) Preparatory Study on Eco-design of Water Heaters LOT 2. Final report, September 2007
Task 2 report – Economic and Market Analysis
43
http://aceee.org/files/proceedings/2010/data/papers/1967.pdf http://blog.bosch-si.com/categories/technology/2015/07/here-to-stay-the-smart-home-needs-standards/ http://cleantechnica.com/2015/03/18/eneco-smartcharging-app-dutch-tesla-drivers-charge-price-low/ http://connectedhomeplatform.telekom.net/wp-content/uploads/Telekom_Market_Analysis_Report-How_to_create_Growth_from_the_Connected_Home.pdf http://ec.europa.eu/energy/en/topics/energy-strategy/2030-energy-strategy http://ec.europa.eu/transport/media/publications/doc/trends-to-2050-update-2013.pdf http://energia.fi/sites/default/files/dokumentit/ajankohtaista/Tapahtumat/2013/ST-pooli/esitys_soderbom.pdf http://home-connect.com/de/en/#p_home_connect http://home-connect.com/de/en/faq/faq.html#12 http://knoema.com/wxgcxde/commodity-prices-forecast-2015-2019-charts-and-tables?variable=Natural%20gas%20(US%24%2FmBtu%2C%20Europe) http://static1.squarespace.com/static/5129591ae4b0fd698ebf65c0/t/5467dface4b00178423ef00 7/1416093612167/bii_connectedhome_sept14.pdf http://uk.businessinsider.com/the-us-smart-home-market-report-adoption-forecasts-top-products-and-the-cost-and-fragmentation-problems-that-could-hinder-growth-2015-9?r=US&IR=T http://www.alpenergy.net/images/stories/AlpEnergy_Final_Guideline.pdf http://www.berginsight.com/ReportPDF/ProductSheet/bi-sh1-ps.pdf http://www.bitkom.org http://www.boilerguide.co.uk/articles/electric-boilers http://www.changepartnership.org/wp-content/uploads/2014/10/Point-Carbon-2014-11042014-MSR-Point-Carbon.pdf http://www.e3mlab.ntua.gr/e3mlab/index.php?option=com_content&view=category&id=35:primes&Itemid=80&layout=default&lang=en http://www.elia.be/~/media/files/Elia/Products-and-services/ProductSheets/S-Ondersteuning-net/S_Grid%20support_En.pdf http://www.europarl.europa.eu/RegData/etudes/BRIE/2015/568318/EPRS_BRI(2015)568318_EN .pdf http://www.foex.fi/index.php?page=pix-rcp http://www.greentechmedia.com/articles/read/Panasonic-Enters-Europes-Burgeoning-Home-Battery-Market http://www.iea.org/etp/etpmodel/assumptions/ http://www.ifa-international.org/dailies http://www.insightenergy.org/ckeditor_assets/attachments/48/pr1.pdf http://www.insightenergy.org/ckeditor_assets/attachments/48/pr1.pdf http://www.insightenergy.org/ckeditor_assets/attachments/48/pr1.pdf http://www.linear-smartgrid.be/en http://www.m2mnow.biz/2014/03/27/19247-maingate-nte-together-towards-tomorrows-energy-market/ http://www.power-technology.com/features/featuredynamic-energy-pricing-will-the-public-buy-in-4294096/ http://www.researchandmarkets.com/research/zcsgb8/smart_appliances http://www.researchgate.net/publication/254864389 http://www.slideshare.net/drsea/07-maggiore-simoneieadsmgrazoctober2014 http://www.tennet.eu/nl/fileadmin/downloads/About_Tennet/Publications/Other_Publications/ plugin-Market_information_IGCC_tcm43-20521.PDF http://www.transport.gov.mt/admin/uploads/media-library/files/DAirMaltaStudyVisit_The%20Energy%20Sector%20in%20Malta.pdf
Task 2 report – Economic and Market Analysis
44
https://ec.europa.eu/energy/sites/ener/files/documents/com_2013_public_intervention_swd07 _en.pdf https://ec.europa.eu/energy/sites/ener/files/documents/ECOFYS%202014%20Subsidies%20and%20costs%20of%20EU%20energy_11_Nov.pdf https://nest.com/energy-partners/austin-energy/ https://particulier.edf.fr/fr/accueil/facture-et-contrat/contrat/consulter-les-jours-ejp-et-tempo/option-tempo.html https://technology.ihs.com/549694 https://www.capgemini-consulting.com/resource-file-access/resource/pdf/iot_monetization_0 .pdf https://www.energex.com.au/__data/assets/pdf_file/0006/126375/PeakSmart-Air-Con-Terms-and-Conditions.pdf https://www.entsoe.eu/Documents/Events/2014/141013_ENTSO-E_Update-on-IEM-related%20project%20work_final.pdf https://www.entsoe.eu/Documents/Publications/Market%20Committee%20publications/1501 27_WGAS_Survey_2014.pdf https://www.theice.com/market-data http://www.smartenergydemand.eu/wp-content/uploads/2015/09/Mapping-Demand-Response-in-Europe-Today-2015.pdf http://www.elia.be/~/media/files/Elia/Products-and-services/Ondersteunende%20diensten/R1-load_general_framework_2015-2018-update_February_2016.pdf


![25013906-capital-market [EDocFind.com]](https://static.fdocuments.pl/doc/165x107/577d2e961a28ab4e1eaf74f4/25013906-capital-market-edocfindcom.jpg)