
Market Update January 2016 SPP’s Middle Market...
6
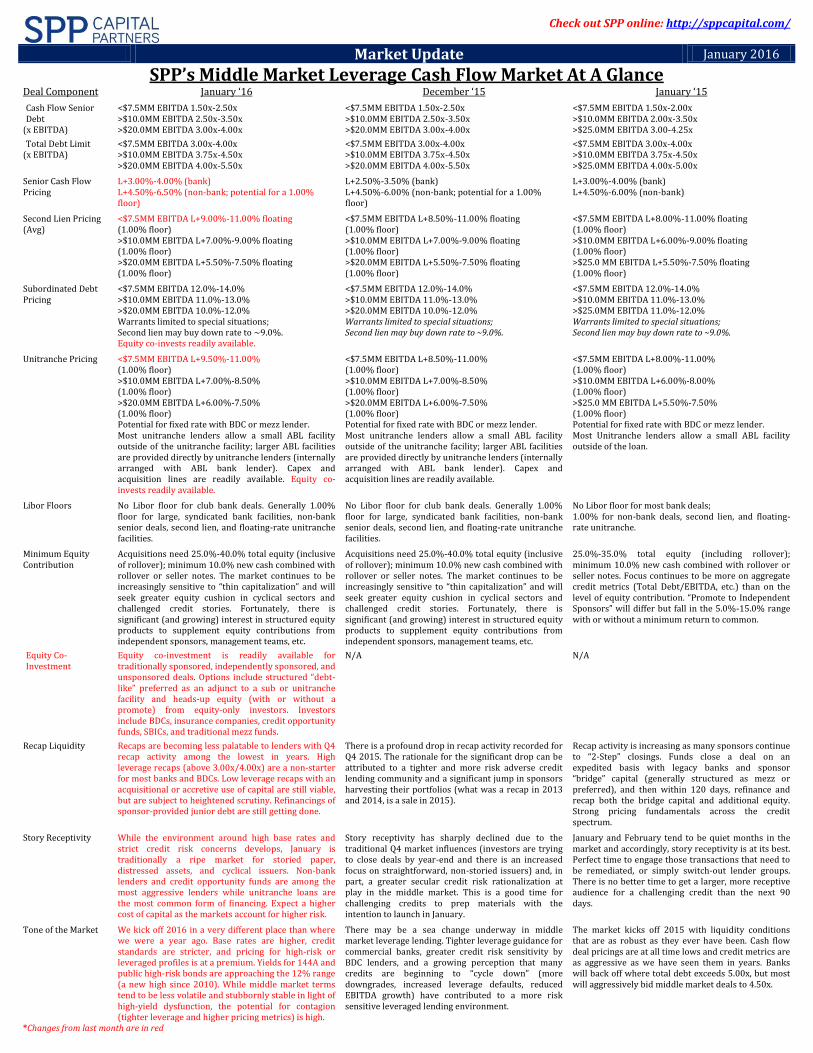
Check out SPP online: http://sppcapital.com/ Market Update January 2016 SPP’s Middle Market Leverage Cash Flow Market At A Glance Deal Component January ‘16 December ‘15 January ‘15 Cash Flow Senior Debt (x EBITDA) <$7.5MM EBITDA 1.50x-2.50x >$10.0MM EBITDA 2.50x-3.50x >$20.0MM EBITDA 3.00x-4.00x <$7.5MM EBITDA 1.50x-2.50x >$10.0MM EBITDA 2.50x-3.50x >$20.0MM EBITDA 3.00x-4.00x <$7.5MM EBITDA 1.50x-2.00x >$10.0MM EBITDA 2.00x-3.50x >$25.0MM EBITDA 3.00-4.25x Total Debt Limit (x EBITDA) <$7.5MM EBITDA 3.00x-4.00x >$10.0MM EBITDA 3.75x-4.50x >$20.0MM EBITDA 4.00x-5.50x <$7.5MM EBITDA 3.00x-4.00x >$10.0MM EBITDA 3.75x-4.50x >$20.0MM EBITDA 4.00x-5.50x <$7.5MM EBITDA 3.00x-4.00x >$10.0MM EBITDA 3.75x-4.50x >$25.0MM EBITDA 4.00x-5.00x Senior Cash Flow Pricing L+3.00%-4.00% (bank) L+4.50%-6.50% (non-bank; potential for a 1.00% floor) L+2.50%-3.50% (bank) L+4.50%-6.00% (non-bank; potential for a 1.00% floor) L+3.00%-4.00% (bank) L+4.50%-6.00% (non-bank) Second Lien Pricing (Avg) <$7.5MM EBITDA L+9.00%-11.00% floating (1.00% floor) >$10.0MM EBITDA L+7.00%-9.00% floating (1.00% floor) >$20.0MM EBITDA L+5.50%-7.50% floating (1.00% floor) <$7.5MM EBITDA L+8.50%-11.00% floating (1.00% floor) >$10.0MM EBITDA L+7.00%-9.00% floating (1.00% floor) >$20.0MM EBITDA L+5.50%-7.50% floating (1.00% floor) <$7.5MM EBITDA L+8.00%-11.00% floating (1.00% floor) >$10.0MM EBITDA L+6.00%-9.00% floating (1.00% floor) >$25.0 MM EBITDA L+5.50%-7.50% floating (1.00% floor) Subordinated Debt Pricing <$7.5MM EBITDA 12.0%-14.0% >$10.0MM EBITDA 11.0%-13.0% >$20.0MM EBITDA 10.0%-12.0% Warrants limited to special situations; Second lien may buy down rate to ~9.0%. Equity co-invests readily available. <$7.5MM EBITDA 12.0%-14.0% >$10.0MM EBITDA 11.0%-13.0% >$20.0MM EBITDA 10.0%-12.0% Warrants limited to special situations; Second lien may buy down rate to ~9.0%. <$7.5MM EBITDA 12.0%-14.0% >$10.0MM EBITDA 11.0%-13.0% >$25.0MM EBITDA 11.0%-12.0% Warrants limited to special situations; Second lien may buy down rate to ~9.0%. Unitranche Pricing <$7.5MM EBITDA L+9.50%-11.00% (1.00% floor) >$10.0MM EBITDA L+7.00%-8.50% (1.00% floor) >$20.0MM EBITDA L+6.00%-7.50% (1.00% floor) Potential for fixed rate with BDC or mezz lender. Most unitranche lenders allow a small ABL facility outside of the unitranche facility; larger ABL facilities are provided directly by unitranche lenders (internally arranged with ABL bank lender). Capex and acquisition lines are readily available. Equity co- invests readily available. <$7.5MM EBITDA L+8.50%-11.00% (1.00% floor) >$10.0MM EBITDA L+7.00%-8.50% (1.00% floor) >$20.0MM EBITDA L+6.00%-7.50% (1.00% floor) Potential for fixed rate with BDC or mezz lender. Most unitranche lenders allow a small ABL facility outside of the unitranche facility; larger ABL facilities are provided directly by unitranche lenders (internally arranged with ABL bank lender). Capex and acquisition lines are readily available. <$7.5MM EBITDA L+8.00%-11.00% (1.00% floor) >$10.0MM EBITDA L+6.00%-8.00% (1.00% floor) >$25.0 MM EBITDA L+5.50%-7.50% (1.00% floor) Potential for fixed rate with BDC or mezz lender. Most Unitranche lenders allow a small ABL facility outside of the loan. Libor Floors No Libor floor for club bank deals. Generally 1.00% floor for large, syndicated bank facilities, non-bank senior deals, second lien, and floating-rate unitranche facilities. No Libor floor for club bank deals. Generally 1.00% floor for large, syndicated bank facilities, non-bank senior deals, second lien, and floating-rate unitranche facilities. No Libor floor for most bank deals; 1.00% for non-bank deals, second lien, and floating- rate unitranche. Minimum Equity Contribution Acquisitions need 25.0%-40.0% total equity (inclusive of rollover); minimum 10.0% new cash combined with rollover or seller notes. The market continues to be increasingly sensitive to “thin capitalization” and will seek greater equity cushion in cyclical sectors and challenged credit stories. Fortunately, there is significant (and growing) interest in structured equity products to supplement equity contributions from independent sponsors, management teams, etc. Acquisitions need 25.0%-40.0% total equity (inclusive of rollover); minimum 10.0% new cash combined with rollover or seller notes. The market continues to be increasingly sensitive to “thin capitalization” and will seek greater equity cushion in cyclical sectors and challenged credit stories. Fortunately, there is significant (and growing) interest in structured equity products to supplement equity contributions from independent sponsors, management teams, etc. 25.0%-35.0% total equity (including rollover); minimum 10.0% new cash combined with rollover or seller notes. Focus continues to be more on aggregate credit metrics (Total Debt/EBITDA, etc.) than on the level of equity contribution. “Promote to Independent Sponsors” will differ but fall in the 5.0%-15.0% range with or without a minimum return to common. Equity Co- Investment Equity co-investment is readily available for traditionally sponsored, independently sponsored, and unsponsored deals. Options include structured “debt- like” preferred as an adjunct to a sub or unitranche facility and heads-up equity (with or without a promote) from equity-only investors. Investors include BDCs, insurance companies, credit opportunity funds, SBICs, and traditional mezz funds. N/A N/A Recap Liquidity Recaps are becoming less palatable to lenders with Q4 recap activity among the lowest in years. High leverage recaps (above 3.00x/4.00x) are a non-starter for most banks and BDCs. Low leverage recaps with an acquisitional or accretive use of capital are still viable, but are subject to heightened scrutiny. Refinancings of sponsor-provided junior debt are still getting done. There is a profound drop in recap activity recorded for Q4 2015. The rationale for the significant drop can be attributed to a tighter and more risk adverse credit lending community and a significant jump in sponsors harvesting their portfolios (what was a recap in 2013 and 2014, is a sale in 2015). Recap activity is increasing as many sponsors continue to “2-Step” closings. Funds close a deal on an expedited basis with legacy banks and sponsor “bridge” capital (generally structured as mezz or preferred), and then within 120 days, refinance and recap both the bridge capital and additional equity. Strong pricing fundamentals across the credit spectrum. Story Receptivity While the environment around high base rates and strict credit risk concerns develops, January is traditionally a ripe market for storied paper, distressed assets, and cyclical issuers. Non-bank lenders and credit opportunity funds are among the most aggressive lenders while unitranche loans are the most common form of financing. Expect a higher cost of capital as the markets account for higher risk. Story receptivity has sharply declined due to the traditional Q4 market influences (investors are trying to close deals by year-end and there is an increased focus on straightforward, non-storied issuers) and, in part, a greater secular credit risk rationalization at play in the middle market. This is a good time for challenging credits to prep materials with the intention to launch in January. January and February tend to be quiet months in the market and accordingly, story receptivity is at its best. Perfect time to engage those transactions that need to be remediated, or simply switch-out lender groups. There is no better time to get a larger, more receptive audience for a challenging credit than the next 90 days. Tone of the Market We kick off 2016 in a very different place than where we were a year ago. Base rates are higher, credit standards are stricter, and pricing for high-risk or leveraged profiles is at a premium. Yields for 144A and public high-risk bonds are approaching the 12% range (a new high since 2010). While middle market terms tend to be less volatile and stubbornly stable in light of high-yield dysfunction, the potential for contagion (tighter leverage and higher pricing metrics) is high. There may be a sea change underway in middle market leverage lending. Tighter leverage guidance for commercial banks, greater credit risk sensitivity by BDC lenders, and a growing perception that many credits are beginning to “cycle down” (more downgrades, increased leverage defaults, reduced EBITDA growth) have contributed to a more risk sensitive leveraged lending environment. The market kicks off 2015 with liquidity conditions that are as robust as they ever have been. Cash flow deal pricings are at all time lows and credit metrics are as aggressive as we have seen them in years. Banks will back off where total debt exceeds 5.00x, but most will aggressively bid middle market deals to 4.50x. *Changes from last month are in red
Transcript of Market Update January 2016 SPP’s Middle Market...
Check out SPP online: http://sppcapital.com/
Market Update January 2016
SPP’s Middle Market Leverage Cash Flow Market At A Glance
Deal Component January ‘16 December ‘15 January ‘15
Cash Flow Senior Debt
(x EBITDA)
<$7.5MM EBITDA 1.50x-2.50x >$10.0MM EBITDA 2.50x-3.50x >$20.0MM EBITDA 3.00x-4.00x
<$7.5MM EBITDA 1.50x-2.50x >$10.0MM EBITDA 2.50x-3.50x >$20.0MM EBITDA 3.00x-4.00x
<$7.5MM EBITDA 1.50x-2.00x >$10.0MM EBITDA 2.00x-3.50x >$25.0MM EBITDA 3.00-4.25x
Total Debt Limit (x EBITDA)
<$7.5MM EBITDA 3.00x-4.00x >$10.0MM EBITDA 3.75x-4.50x >$20.0MM EBITDA 4.00x-5.50x
<$7.5MM EBITDA 3.00x-4.00x >$10.0MM EBITDA 3.75x-4.50x >$20.0MM EBITDA 4.00x-5.50x
<$7.5MM EBITDA 3.00x-4.00x >$10.0MM EBITDA 3.75x-4.50x >$25.0MM EBITDA 4.00x-5.00x
Senior Cash Flow Pricing
L+3.00%-4.00% (bank) L+4.50%-6.50% (non-bank; potential for a 1.00% floor)
L+2.50%-3.50% (bank) L+4.50%-6.00% (non-bank; potential for a 1.00% floor)
L+3.00%-4.00% (bank) L+4.50%-6.00% (non-bank)
Second Lien Pricing (Avg)
<$7.5MM EBITDA L+9.00%-11.00% floating (1.00% floor) >$10.0MM EBITDA L+7.00%-9.00% floating (1.00% floor) >$20.0MM EBITDA L+5.50%-7.50% floating (1.00% floor)
<$7.5MM EBITDA L+8.50%-11.00% floating (1.00% floor) >$10.0MM EBITDA L+7.00%-9.00% floating (1.00% floor) >$20.0MM EBITDA L+5.50%-7.50% floating (1.00% floor)
<$7.5MM EBITDA L+8.00%-11.00% floating (1.00% floor) >$10.0MM EBITDA L+6.00%-9.00% floating (1.00% floor) >$25.0 MM EBITDA L+5.50%-7.50% floating (1.00% floor)
Subordinated Debt Pricing
<$7.5MM EBITDA 12.0%-14.0% >$10.0MM EBITDA 11.0%-13.0% >$20.0MM EBITDA 10.0%-12.0% Warrants limited to special situations; Second lien may buy down rate to ~9.0%. Equity co-invests readily available.
<$7.5MM EBITDA 12.0%-14.0% >$10.0MM EBITDA 11.0%-13.0% >$20.0MM EBITDA 10.0%-12.0% Warrants limited to special situations; Second lien may buy down rate to ~9.0%.
<$7.5MM EBITDA 12.0%-14.0% >$10.0MM EBITDA 11.0%-13.0% >$25.0MM EBITDA 11.0%-12.0% Warrants limited to special situations; Second lien may buy down rate to ~9.0%.
Unitranche Pricing <$7.5MM EBITDA L+9.50%-11.00% (1.00% floor) >$10.0MM EBITDA L+7.00%-8.50% (1.00% floor) >$20.0MM EBITDA L+6.00%-7.50% (1.00% floor) Potential for fixed rate with BDC or mezz lender. Most unitranche lenders allow a small ABL facility outside of the unitranche facility; larger ABL facilities are provided directly by unitranche lenders (internally arranged with ABL bank lender). Capex and acquisition lines are readily available. Equity co-invests readily available.
<$7.5MM EBITDA L+8.50%-11.00% (1.00% floor) >$10.0MM EBITDA L+7.00%-8.50% (1.00% floor) >$20.0MM EBITDA L+6.00%-7.50% (1.00% floor) Potential for fixed rate with BDC or mezz lender. Most unitranche lenders allow a small ABL facility outside of the unitranche facility; larger ABL facilities are provided directly by unitranche lenders (internally arranged with ABL bank lender). Capex and acquisition lines are readily available.
<$7.5MM EBITDA L+8.00%-11.00% (1.00% floor) >$10.0MM EBITDA L+6.00%-8.00% (1.00% floor) >$25.0 MM EBITDA L+5.50%-7.50% (1.00% floor) Potential for fixed rate with BDC or mezz lender. Most Unitranche lenders allow a small ABL facility outside of the loan.
Libor Floors No Libor floor for club bank deals. Generally 1.00% floor for large, syndicated bank facilities, non-bank senior deals, second lien, and floating-rate unitranche facilities.
No Libor floor for club bank deals. Generally 1.00% floor for large, syndicated bank facilities, non-bank senior deals, second lien, and floating-rate unitranche facilities.
No Libor floor for most bank deals; 1.00% for non-bank deals, second lien, and floating-rate unitranche.
Minimum Equity Contribution
Acquisitions need 25.0%-40.0% total equity (inclusive of rollover); minimum 10.0% new cash combined with rollover or seller notes. The market continues to be increasingly sensitive to “thin capitalization” and will seek greater equity cushion in cyclical sectors and challenged credit stories. Fortunately, there is significant (and growing) interest in structured equity products to supplement equity contributions from independent sponsors, management teams, etc.
Acquisitions need 25.0%-40.0% total equity (inclusive of rollover); minimum 10.0% new cash combined with rollover or seller notes. The market continues to be increasingly sensitive to “thin capitalization” and will seek greater equity cushion in cyclical sectors and challenged credit stories. Fortunately, there is significant (and growing) interest in structured equity products to supplement equity contributions from independent sponsors, management teams, etc.
25.0%-35.0% total equity (including rollover); minimum 10.0% new cash combined with rollover or seller notes. Focus continues to be more on aggregate credit metrics (Total Debt/EBITDA, etc.) than on the level of equity contribution. “Promote to Independent Sponsors” will differ but fall in the 5.0%-15.0% range with or without a minimum return to common.
Equity Co-Investment
Equity co-investment is readily available for traditionally sponsored, independently sponsored, and unsponsored deals. Options include structured “debt-like” preferred as an adjunct to a sub or unitranche facility and heads-up equity (with or without a promote) from equity-only investors. Investors include BDCs, insurance companies, credit opportunity funds, SBICs, and traditional mezz funds.
N/A N/A
Recap Liquidity Recaps are becoming less palatable to lenders with Q4 recap activity among the lowest in years. High leverage recaps (above 3.00x/4.00x) are a non-starter for most banks and BDCs. Low leverage recaps with an acquisitional or accretive use of capital are still viable, but are subject to heightened scrutiny. Refinancings of sponsor-provided junior debt are still getting done.
There is a profound drop in recap activity recorded for Q4 2015. The rationale for the significant drop can be attributed to a tighter and more risk adverse credit lending community and a significant jump in sponsors harvesting their portfolios (what was a recap in 2013 and 2014, is a sale in 2015).
Recap activity is increasing as many sponsors continue to “2-Step” closings. Funds close a deal on an expedited basis with legacy banks and sponsor “bridge” capital (generally structured as mezz or preferred), and then within 120 days, refinance and recap both the bridge capital and additional equity. Strong pricing fundamentals across the credit spectrum.
Story Receptivity While the environment around high base rates and strict credit risk concerns develops, January is traditionally a ripe market for storied paper, distressed assets, and cyclical issuers. Non-bank lenders and credit opportunity funds are among the most aggressive lenders while unitranche loans are the most common form of financing. Expect a higher cost of capital as the markets account for higher risk.
Story receptivity has sharply declined due to the traditional Q4 market influences (investors are trying to close deals by year-end and there is an increased focus on straightforward, non-storied issuers) and, in part, a greater secular credit risk rationalization at play in the middle market. This is a good time for challenging credits to prep materials with the intention to launch in January.
January and February tend to be quiet months in the market and accordingly, story receptivity is at its best. Perfect time to engage those transactions that need to be remediated, or simply switch-out lender groups. There is no better time to get a larger, more receptive audience for a challenging credit than the next 90 days.
Tone of the Market We kick off 2016 in a very different place than where we were a year ago. Base rates are higher, credit standards are stricter, and pricing for high-risk or leveraged profiles is at a premium. Yields for 144A and public high-risk bonds are approaching the 12% range (a new high since 2010). While middle market terms tend to be less volatile and stubbornly stable in light of high-yield dysfunction, the potential for contagion (tighter leverage and higher pricing metrics) is high.
There may be a sea change underway in middle market leverage lending. Tighter leverage guidance for commercial banks, greater credit risk sensitivity by BDC lenders, and a growing perception that many credits are beginning to “cycle down” (more downgrades, increased leverage defaults, reduced EBITDA growth) have contributed to a more risk sensitive leveraged lending environment.
The market kicks off 2015 with liquidity conditions that are as robust as they ever have been. Cash flow deal pricings are at all time lows and credit metrics are as aggressive as we have seen them in years. Banks will back off where total debt exceeds 5.00x, but most will aggressively bid middle market deals to 4.50x.
*Changes from last month are in red

Hey Do you hear, do you hear that sound? It's the sound of the lost gone found It's the sound of a mute gone loud It's the sound of a new start Kiss with a mouth of shooting stars Of lost and broken hearts Unafraid you can name your scars With a touch of a new heart It sounds like It sounds like It sounds like Ladeedadadadada, dadadadada Now, oh, now is the start “Now is the Start,” A Fine Frenzy Now is the Start The process of monetary “normalization” has begun and with it, the beginning of a planned withdrawal of stimulus from the zero rate interest policy in effect since 2008. Unsurprisingly, lift-off was achieved without any pronounced dysfunction in the U.S. economy. To raise rates, the Fed employed a few different tactics: First, it set a new range for the Fed Funds rate (the rate that banks lend to
each other, and that other rates [such as LIBOR, Prime, etc.] are based on) to 0.25%-0.50% (0.25% above the 0%-0.25% range that has been in effect since 2008), thereby raising the interest rates it pays banks to hold their reserves at the Fed to 0.50% from 0.25%;
Second, the Fed said it would offer reverse repos at 0.25% (up from 0.05%)
to foster the withdrawal of reserves and keep the Fed Funds rate above 0.25%. The reverse repos lift the floor on short term rates because the Fed pays to borrow money from the market (between the 0.50% the Fed pays on reserves and the 0.25% offered on repos, the Fed has set a new range for short term rates); and
Third, the Fed hiked the discount rate to 1.00% from 0.75%. The discount rate is a last resort for banks that need emergency overnight funds to cover reserve requirements (i.e. - the Fed “Discount Window”).
The focus is now on the magnitude and frequency of future rate increases. In her most recent comments, Fed Chairwoman Janet Yellen suggested that the Fed will continue its accommodative policy and that future increases will be gradual (~1.4% at the end of 2016 and ~2.4% at the end of 2017). At this juncture, that translates to four 0.25% rate increases (one every other FOMC meeting) for the next two years. While the decision to increase rates at the last FOMC meeting was unanimous, there is considerably less agreement with respect to the course of future rate hikes. Seven of the 17 members of the policy-making committee believe that the Fed should pursue a more measured course and only raise rates 0.50% in 2016. The Fed has indicated it will continue to guide monetary policy and the timing of future rate increases on a “data dependent” basis. While consumer spending remains robust and employment numbers continue to improve, the strong dollar has crippled manufacturing, core inflation (excluding food and energy) remains below the Fed’s 2.0% threshold, housing is mixed, and wage growth remains stubbornly sluggish. When one factors in an increasing geopolitical volatility in the Middle East, the ubiquitous risk of terrorist activity, hazardous weather months ahead, and a U.S. Presidential election, it looks like 2016 will offer the Fed no dearth of data to be dependent on.
Private Economist Number of ‘16 Rate Hikes Forecast
Source: Daily Shot
U.S. Economic Indicators – Last Fed Rate Rise vs. Now
Source: Daily Shot
U.S. to Euro Exchange Rate
Source: FRED
Consumer Confidence Index
Source: Conference Board
0.0%
5.0%
10.0%
15.0%
20.0%
25.0%
30.0%
35.0%
0 1 2 3 4 5 6
December 31, 2015 January 05, 2016 January 07, 2016
0.0%
1.0%
2.0%
3.0%
4.0%
5.0%
6.0%
GDP Growth Rate Unemployment Rate Inflation Rate
June 2004 Now
1.09
1.00
1.10
1.20
1.30
1.40
1.50
1.60U
.S. D
oll
ars
to
On
e E
uro
96.5
0.0
20.0
40.0
60.0
80.0
100.0
120.0
Below is a quick recap of the month’s headline economic reports: Consumer Confidence/Retail Sales: As 2016 kicks off, most measures of
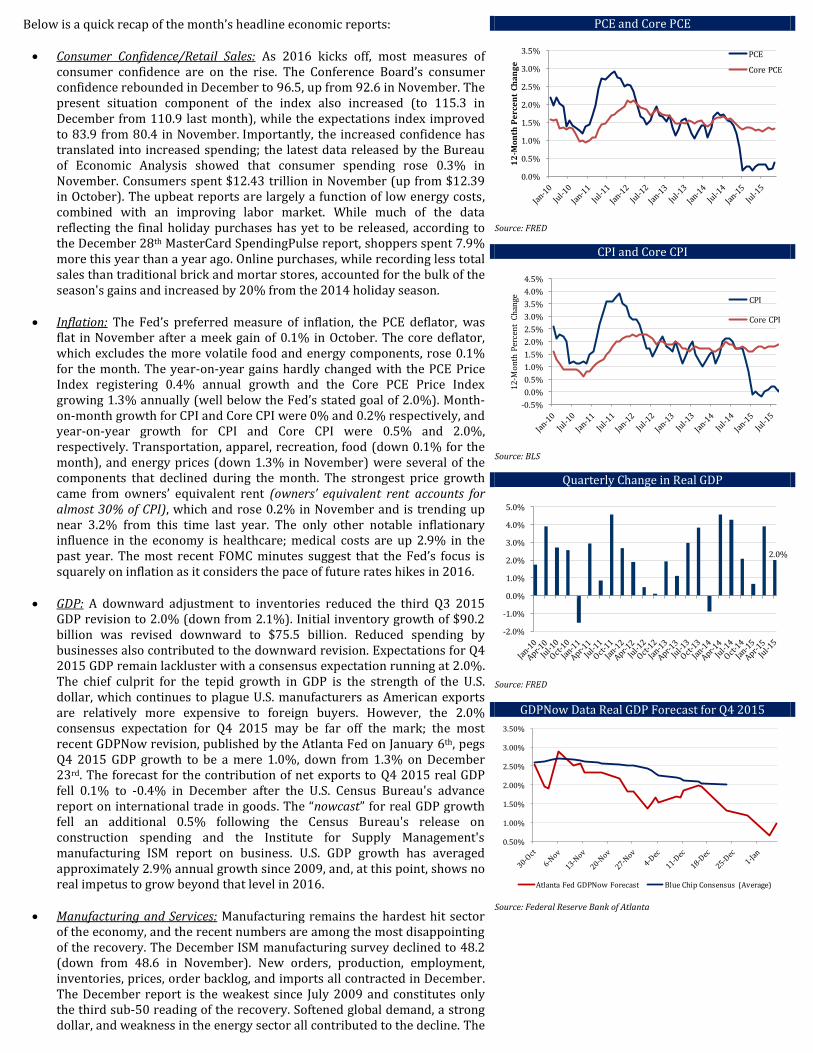
consumer confidence are on the rise. The Conference Board’s consumer confidence rebounded in December to 96.5, up from 92.6 in November. The present situation component of the index also increased (to 115.3 in December from 110.9 last month), while the expectations index improved to 83.9 from 80.4 in November. Importantly, the increased confidence has translated into increased spending; the latest data released by the Bureau of Economic Analysis showed that consumer spending rose 0.3% in November. Consumers spent $12.43 trillion in November (up from $12.39 in October). The upbeat reports are largely a function of low energy costs, combined with an improving labor market. While much of the data reflecting the final holiday purchases has yet to be released, according to the December 28th MasterCard SpendingPulse report, shoppers spent 7.9% more this year than a year ago. Online purchases, while recording less total sales than traditional brick and mortar stores, accounted for the bulk of the season's gains and increased by 20% from the 2014 holiday season.
Inflation: The Fed’s preferred measure of inflation, the PCE deflator, was flat in November after a meek gain of 0.1% in October. The core deflator, which excludes the more volatile food and energy components, rose 0.1% for the month. The year-on-year gains hardly changed with the PCE Price Index registering 0.4% annual growth and the Core PCE Price Index growing 1.3% annually (well below the Fed’s stated goal of 2.0%). Month-on-month growth for CPI and Core CPI were 0% and 0.2% respectively, and year-on-year growth for CPI and Core CPI were 0.5% and 2.0%, respectively. Transportation, apparel, recreation, food (down 0.1% for the month), and energy prices (down 1.3% in November) were several of the components that declined during the month. The strongest price growth came from owners’ equivalent rent (owners’ equivalent rent accounts for almost 30% of CPI), which and rose 0.2% in November and is trending up near 3.2% from this time last year. The only other notable inflationary influence in the economy is healthcare; medical costs are up 2.9% in the past year. The most recent FOMC minutes suggest that the Fed’s focus is squarely on inflation as it considers the pace of future rates hikes in 2016.
GDP: A downward adjustment to inventories reduced the third Q3 2015 GDP revision to 2.0% (down from 2.1%). Initial inventory growth of $90.2 billion was revised downward to $75.5 billion. Reduced spending by businesses also contributed to the downward revision. Expectations for Q4 2015 GDP remain lackluster with a consensus expectation running at 2.0%. The chief culprit for the tepid growth in GDP is the strength of the U.S. dollar, which continues to plague U.S. manufacturers as American exports are relatively more expensive to foreign buyers. However, the 2.0% consensus expectation for Q4 2015 may be far off the mark; the most recent GDPNow revision, published by the Atlanta Fed on January 6th, pegs Q4 2015 GDP growth to be a mere 1.0%, down from 1.3% on December 23rd. The forecast for the contribution of net exports to Q4 2015 real GDP fell 0.1% to -0.4% in December after the U.S. Census Bureau's advance report on international trade in goods. The “nowcast” for real GDP growth fell an additional 0.5% following the Census Bureau's release on construction spending and the Institute for Supply Management's manufacturing ISM report on business. U.S. GDP growth has averaged approximately 2.9% annual growth since 2009, and, at this point, shows no real impetus to grow beyond that level in 2016.
Manufacturing and Services: Manufacturing remains the hardest hit sector of the economy, and the recent numbers are among the most disappointing of the recovery. The December ISM manufacturing survey declined to 48.2 (down from 48.6 in November). New orders, production, employment, inventories, prices, order backlog, and imports all contracted in December. The December report is the weakest since July 2009 and constitutes only the third sub-50 reading of the recovery. Softened global demand, a strong dollar, and weakness in the energy sector all contributed to the decline. The
PCE and Core PCE
Source: FRED
CPI and Core CPI
Source: BLS
Quarterly Change in Real GDP
Source: FRED
GDPNow Data Real GDP Forecast for Q4 2015
Source: Federal Reserve Bank of Atlanta
0.0%
0.5%
1.0%
1.5%
2.0%
2.5%
3.0%
3.5%
12
-Mo
nth
Pe
rce
nt
Ch
an
ge
PCE
Core PCE
-0.5%
0.0%
0.5%
1.0%
1.5%
2.0%
2.5%
3.0%
3.5%
4.0%
4.5%
12
-Mo
nth
Per
cen
t C
han
ge CPI
Core CPI
2.0%
-2.0%
-1.0%
0.0%
1.0%
2.0%
3.0%
4.0%
5.0%
0.50%
1.00%
1.50%
2.00%
2.50%
3.00%
3.50%
Atlanta Fed GDPNow Forecast Blue Chip Consensus (Average)
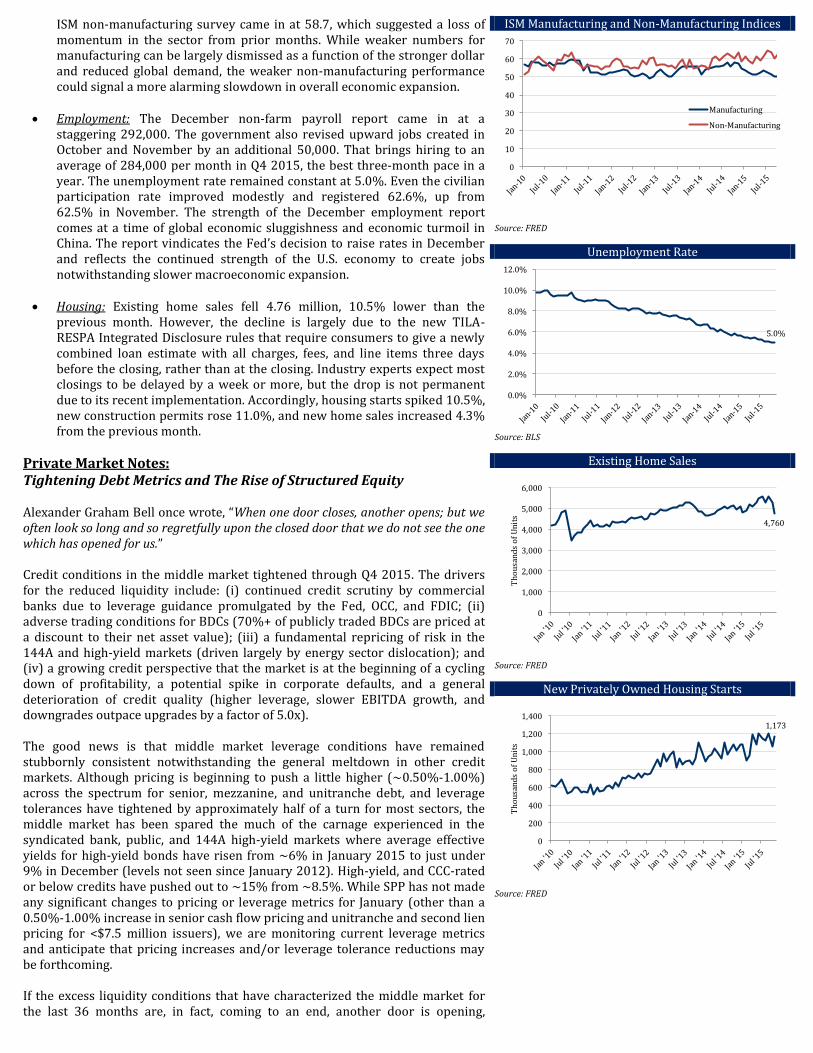
ISM non-manufacturing survey came in at 58.7, which suggested a loss of momentum in the sector from prior months. While weaker numbers for manufacturing can be largely dismissed as a function of the stronger dollar and reduced global demand, the weaker non-manufacturing performance could signal a more alarming slowdown in overall economic expansion.
Employment: The December non-farm payroll report came in at a
staggering 292,000. The government also revised upward jobs created in October and November by an additional 50,000. That brings hiring to an average of 284,000 per month in Q4 2015, the best three-month pace in a year. The unemployment rate remained constant at 5.0%. Even the civilian participation rate improved modestly and registered 62.6%, up from 62.5% in November. The strength of the December employment report comes at a time of global economic sluggishness and economic turmoil in China. The report vindicates the Fed’s decision to raise rates in December and reflects the continued strength of the U.S. economy to create jobs notwithstanding slower macroeconomic expansion.
Housing: Existing home sales fell 4.76 million, 10.5% lower than the previous month. However, the decline is largely due to the new TILA-RESPA Integrated Disclosure rules that require consumers to give a newly combined loan estimate with all charges, fees, and line items three days before the closing, rather than at the closing. Industry experts expect most closings to be delayed by a week or more, but the drop is not permanent due to its recent implementation. Accordingly, housing starts spiked 10.5%, new construction permits rose 11.0%, and new home sales increased 4.3% from the previous month.
Private Market Notes: Tightening Debt Metrics and The Rise of Structured Equity Alexander Graham Bell once wrote, “When one door closes, another opens; but we often look so long and so regretfully upon the closed door that we do not see the one which has opened for us.” Credit conditions in the middle market tightened through Q4 2015. The drivers for the reduced liquidity include: (i) continued credit scrutiny by commercial banks due to leverage guidance promulgated by the Fed, OCC, and FDIC; (ii) adverse trading conditions for BDCs (70%+ of publicly traded BDCs are priced at a discount to their net asset value); (iii) a fundamental repricing of risk in the 144A and high-yield markets (driven largely by energy sector dislocation); and (iv) a growing credit perspective that the market is at the beginning of a cycling down of profitability, a potential spike in corporate defaults, and a general deterioration of credit quality (higher leverage, slower EBITDA growth, and downgrades outpace upgrades by a factor of 5.0x). The good news is that middle market leverage conditions have remained stubbornly consistent notwithstanding the general meltdown in other credit markets. Although pricing is beginning to push a little higher (~0.50%-1.00%) across the spectrum for senior, mezzanine, and unitranche debt, and leverage tolerances have tightened by approximately half of a turn for most sectors, the middle market has been spared the much of the carnage experienced in the syndicated bank, public, and 144A high-yield markets where average effective yields for high-yield bonds have risen from ~6% in January 2015 to just under 9% in December (levels not seen since January 2012). High-yield, and CCC-rated or below credits have pushed out to ~15% from ~8.5%. While SPP has not made any significant changes to pricing or leverage metrics for January (other than a 0.50%-1.00% increase in senior cash flow pricing and unitranche and second lien pricing for <$7.5 million issuers), we are monitoring current leverage metrics and anticipate that pricing increases and/or leverage tolerance reductions may be forthcoming. If the excess liquidity conditions that have characterized the middle market for the last 36 months are, in fact, coming to an end, another door is opening,
ISM Manufacturing and Non-Manufacturing Indices
Source: FRED
Unemployment Rate
Source: BLS
Existing Home Sales
Source: FRED
New Privately Owned Housing Starts
Source: FRED
0
10
20
30
40
50
60
70
Manufacturing
Non-Manufacturing
5.0%
0.0%
2.0%
4.0%
6.0%
8.0%
10.0%
12.0%
4,760
0
1,000
2,000
3,000
4,000
5,000
6,000
Th
ou
san
ds
of
Un
its
1,173
0
200
400
600
800
1,000
1,200
1,400
Th
ou
san
ds
of
Un
its
specifically, the market for minority equity investments. Credit opportunity funds, BDCs, insurance companies, and many traditional mezzanine funds are actively marketing structured equity products as either an adjunct component to a unitranche or mezzanine debt instrument or as an independent private equity security. Given the proliferation of independent sponsors in the private equity landscape, the timing for this newfound equity liquidity could not be more fortuitous. As a general proposition, these structures take one of two forms: (i) debt-like redeemable preferred shares (aka. “below the line sub debt”) and (ii) equity-like “heads-up” common shares with a graduated promote feature to the sponsor. Because redeemable preferred shares are usually structured more similar to debt than equity, they generally contain a PIK dividend of 5.0%-12.0% (similar to a sub debt cash coupon of 12.0%) and offer the purchaser nominal common share warrants. Similar to sub debt, they are priced to achieve a target internal rate of return (“IRR”) of approximately 16.0%-19.0%. They are almost exclusively a component of a larger unitranche or mezzanine debt investment and are typically less than ~20% of the size of the corresponding debt investment. Co-invest common structures are more equity-like, may contain a preferred dividend (~5.0%-8.0%), and generally mimic the terms of the sponsor’s equity contribution. Unlike the structured equity product that is priced to achieve a specific IRR, these investments lend themselves to a more traditional pre-money/post-money analysis and generally provide for an approximately 15% promote to the sponsor’s common shares once the preferred PIK and principal are returned (there is often an incentive step-up feature for better performance in the promote). These securities can be arranged in connection with larger unitranche or mezzanine debt instruments or as a single piece of the capital structure. Unlike the more structured redeemable preferred shares, the amount of the equity co-investment is not limited to a percentage of a corresponding debt instrument. Equity co-investment is likely to be one of the fastest growing sectors in middle market financing in 2016. It provides quick access to capital for independent sponsors, the capacity to preserve capital for buy-and-build platforms, and a readily available source of liquidity for vintage portfolio investments.
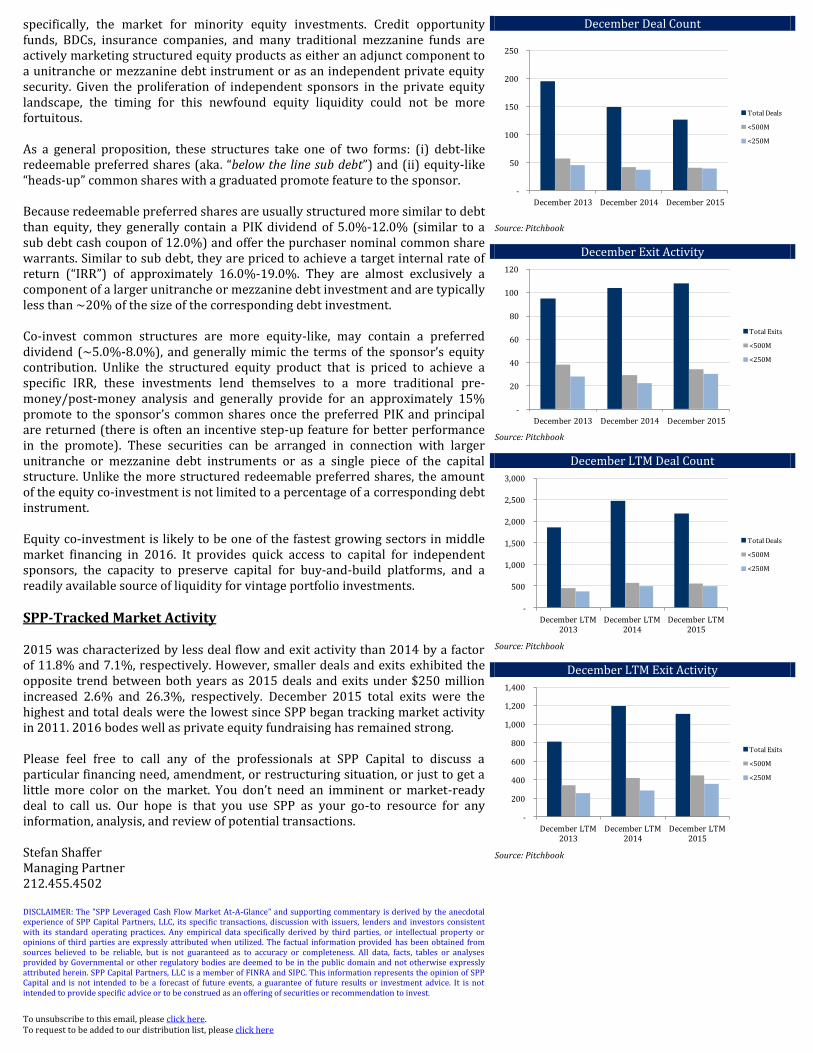
SPP-Tracked Market Activity 2015 was characterized by less deal flow and exit activity than 2014 by a factor of 11.8% and 7.1%, respectively. However, smaller deals and exits exhibited the opposite trend between both years as 2015 deals and exits under $250 million increased 2.6% and 26.3%, respectively. December 2015 total exits were the highest and total deals were the lowest since SPP began tracking market activity in 2011. 2016 bodes well as private equity fundraising has remained strong. Please feel free to call any of the professionals at SPP Capital to discuss a particular financing need, amendment, or restructuring situation, or just to get a little more color on the market. You don’t need an imminent or market-ready deal to call us. Our hope is that you use SPP as your go-to resource for any information, analysis, and review of potential transactions. Stefan Shaffer Managing Partner 212.455.4502 DISCLAIMER: The "SPP Leveraged Cash Flow Market At-A-Glance" and supporting commentary is derived by the anecdotal experience of SPP Capital Partners, LLC, its specific transactions, discussion with issuers, lenders and investors consistent with its standard operating practices. Any empirical data specifically derived by third parties, or intellectual property or opinions of third parties are expressly attributed when utilized. The factual information provided has been obtained from sources believed to be reliable, but is not guaranteed as to accuracy or completeness. All data, facts, tables or analyses provided by Governmental or other regulatory bodies are deemed to be in the public domain and not otherwise expressly attributed herein. SPP Capital Partners, LLC is a member of FINRA and SIPC. This information represents the opinion of SPP Capital and is not intended to be a forecast of future events, a guarantee of future results or investment advice. It is not intended to provide specific advice or to be construed as an offering of securities or recommendation to invest.
To unsubscribe to this email, please click here. To request to be added to our distribution list, please click here
December Deal Count
Source: Pitchbook
December Exit Activity
Source: Pitchbook
December LTM Deal Count
Source: Pitchbook
December LTM Exit Activity
Source: Pitchbook
-
50
100
150
200
250
December 2013 December 2014 December 2015
Total Deals
<500M
<250M
-
20
40
60
80
100
120
December 2013 December 2014 December 2015
Total Exits
<500M
<250M
-
500
1,000
1,500
2,000
2,500
3,000
December LTM 2013
December LTM 2014
December LTM 2015
Total Deals
<500M
<250M
-
200
400
600
800
1,000
1,200
1,400
December LTM 2013
December LTM 2014
December LTM 2015
Total Exits
<500M
<250M
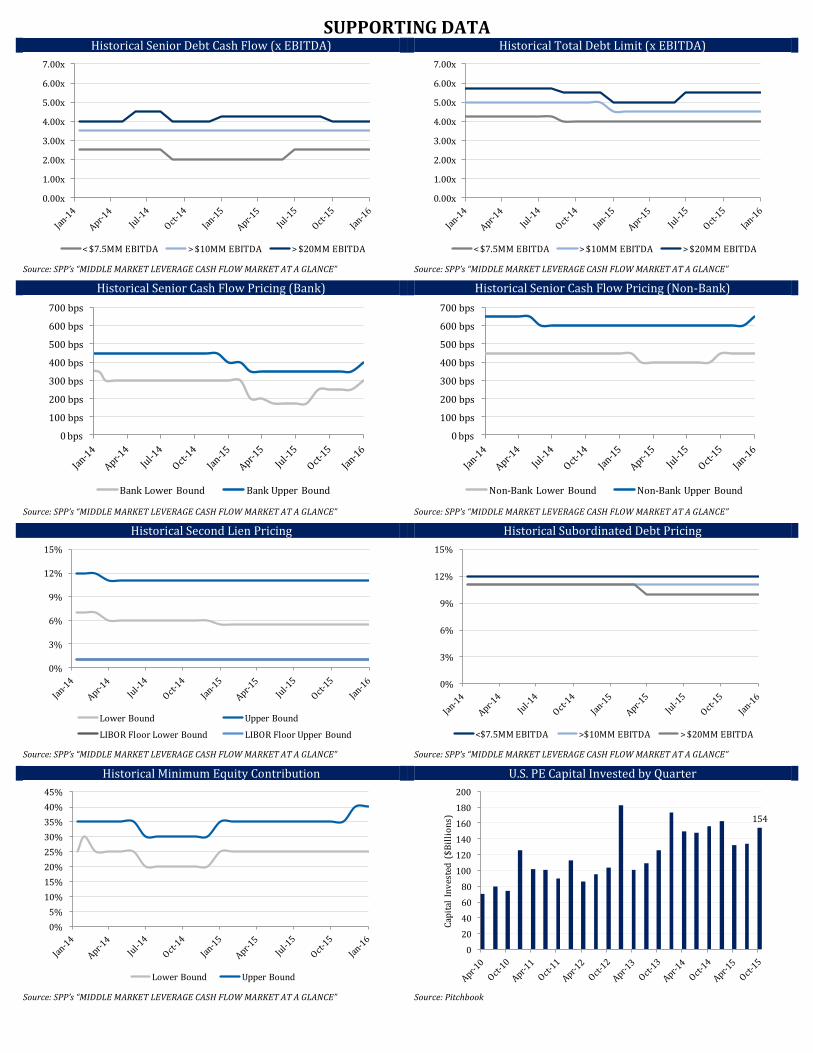
SUPPORTING DATA Historical Senior Debt Cash Flow (x EBITDA) Historical Total Debt Limit (x EBITDA)
Source: SPP’s “MIDDLE MARKET LEVERAGE CASH FLOW MARKET AT A GLANCE” Source: SPP’s “MIDDLE MARKET LEVERAGE CASH FLOW MARKET AT A GLANCE”
Historical Senior Cash Flow Pricing (Bank) Historical Senior Cash Flow Pricing (Non-Bank)
Source: SPP’s “MIDDLE MARKET LEVERAGE CASH FLOW MARKET AT A GLANCE” Source: SPP’s “MIDDLE MARKET LEVERAGE CASH FLOW MARKET AT A GLANCE”
Historical Second Lien Pricing Historical Subordinated Debt Pricing
Source: SPP’s “MIDDLE MARKET LEVERAGE CASH FLOW MARKET AT A GLANCE” Source: SPP’s “MIDDLE MARKET LEVERAGE CASH FLOW MARKET AT A GLANCE”
Historical Minimum Equity Contribution U.S. PE Capital Invested by Quarter
Source: SPP’s “MIDDLE MARKET LEVERAGE CASH FLOW MARKET AT A GLANCE” Source: Pitchbook
0.00x
1.00x
2.00x
3.00x
4.00x
5.00x
6.00x
7.00x
< $7.5MM EBITDA > $10MM EBITDA > $20MM EBITDA
0.00x
1.00x
2.00x
3.00x
4.00x
5.00x
6.00x
7.00x
< $7.5MM EBITDA > $10MM EBITDA > $20MM EBITDA
0 bps
100 bps
200 bps
300 bps
400 bps
500 bps
600 bps
700 bps
Bank Lower Bound Bank Upper Bound
0 bps
100 bps
200 bps
300 bps
400 bps
500 bps
600 bps
700 bps
Non-Bank Lower Bound Non-Bank Upper Bound
0%
3%
6%
9%
12%
15%
Lower Bound Upper Bound
LIBOR Floor Lower Bound LIBOR Floor Upper Bound
0%
3%
6%
9%
12%
15%
<$7.5MM EBITDA >$10MM EBITDA > $20MM EBITDA
0%
5%
10%
15%
20%
25%
30%
35%
40%
45%
Lower Bound Upper Bound
154
0
20
40
60
80
100
120
140
160
180
200
Cap
ital
In
ves
ted
($
Bil
lio
ns)