
KPI White Paper
34
125.21 4 4 4 4 4 4 4 4 4 4 4 4 4 4 4 4 4 4 4 4 4 4 4 4 4 4 4 4 4 4 4 4 4 5 5 5 5 5 5 5 5 5 5 5 5 5 5 5 5 5 5 5 5 5 5 5 5 5 5 5 5 5 5 5 5 5 5 5 5 3 3 3 3 3 3 3 3 3 3 3 3 3 3 3 3 3 3 . . . . . . . . 2 2 2 2 2 2 2 2 2 2 2 2 2 2 2 2 2 2 2 2 2 2 2 1 1 1 1 1 1 1 1 1 1 1 1 1 1 1 1 1 1 1 1 1 1 1 1 1 1 1 1 1 1 1 1 1 1 1 1 1 1 1 1 1 1 1 1 1 1 1 1 1 1 1 1 1 1 1 1 1 1 1 1 1 1 1 1 1 1 1 1 1 20.01 5 21 85.698 45.75 1 | From numbers to action © 2010 by Advito. All rights reserved From numbers to action White Paper Improving travel program management through strategic KPIs and meaningful savings measurements
-
Upload
pamela-wilson -
Category
Documents
-
view
213 -
download
0
Transcript of KPI White Paper
125.21
44444444444444444444444444444444444444444444444444555555555555555555555555555555555555555555555555555555555555333333333333333333333333........2222222222222222222222211111111111111111111111111111111111111111111111111111111111111111111111111
20.015 2185.698
45.75
1 �|����From numbers to action���©�2010�by�Advito.�All�rights�reserved
From numbers to actionWhite Paper
Improving travel program management through strategic KPIs and meaningful
savings measurements
2 �|����From numbers to action���©�2010�by�Advito.�All�rights�reserved
Back�to�Index�>
ContentsExecutive Summary 3
Introduction: The data challenge for travel managers 8
Section 1: Strategic KPIs 10
Section 2: Meaningful savings measurement 23
Section 3: Sourcing, combining and managing data 29
Final word: The role of benchmarking in strategic performance management 32
Contents
125.2144444444444444444444444444444444444444444444444444555555555555555555555555555555555555555555555555555555555555333333333333333333333333........2222222222222222222222211111111111111111111111111111111111111111111111111111111111111111111111111
20.015 2185.698
45.75
3 �|����From numbers to action���©�2010�by�Advito.�All�rights�reserved
Back�to�Index�>
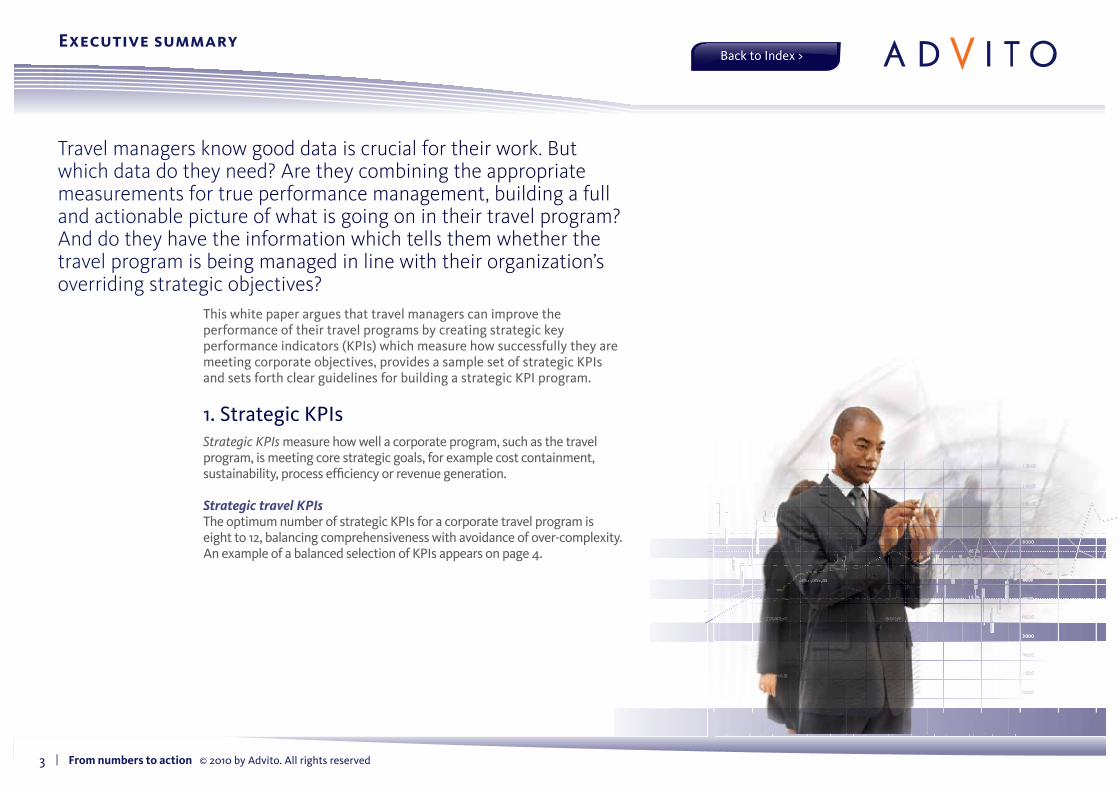
This�white�paper�argues�that�travel�managers�can�improve�the�performance�of�their�travel�programs�by�creating�strategic�key�performance�indicators�(KPIs)�which�measure�how�successfully�they�are�meeting�corporate�objectives,�provides�a�sample�set�of�strategic�KPIs�and�sets�forth�clear�guidelines�for�building�a�strategic�KPI�program.
1.�Strategic�KPIsStrategic KPIs�measure�how�well�a�corporate�program,�such�as�the�travel�program,�is�meeting�core�strategic�goals,�for�example�cost�containment,�sustainability,�process�efficiency�or�revenue�generation.�
Strategic travel KPIsThe�optimum�number�of�strategic�KPIs�for�a�corporate�travel�program�is�eight�to�12,�balancing�comprehensiveness�with�avoidance�of�over-complexity.�An�example�of�a�balanced�selection�of�KPIs�appears�on�page�4.�
Executive summary
Travel managers know good data is crucial for their work. But which data do they need? Are they combining the appropriate measurements for true performance management, building a full and actionable picture of what is going on in their travel program? And do they have the information which tells them whether the travel program is being managed in line with their organization’s overriding strategic objectives?
4 �|����From numbers to action���©�2010�by�Advito.�All�rights�reserved
Back�to�Index�>Executive summary
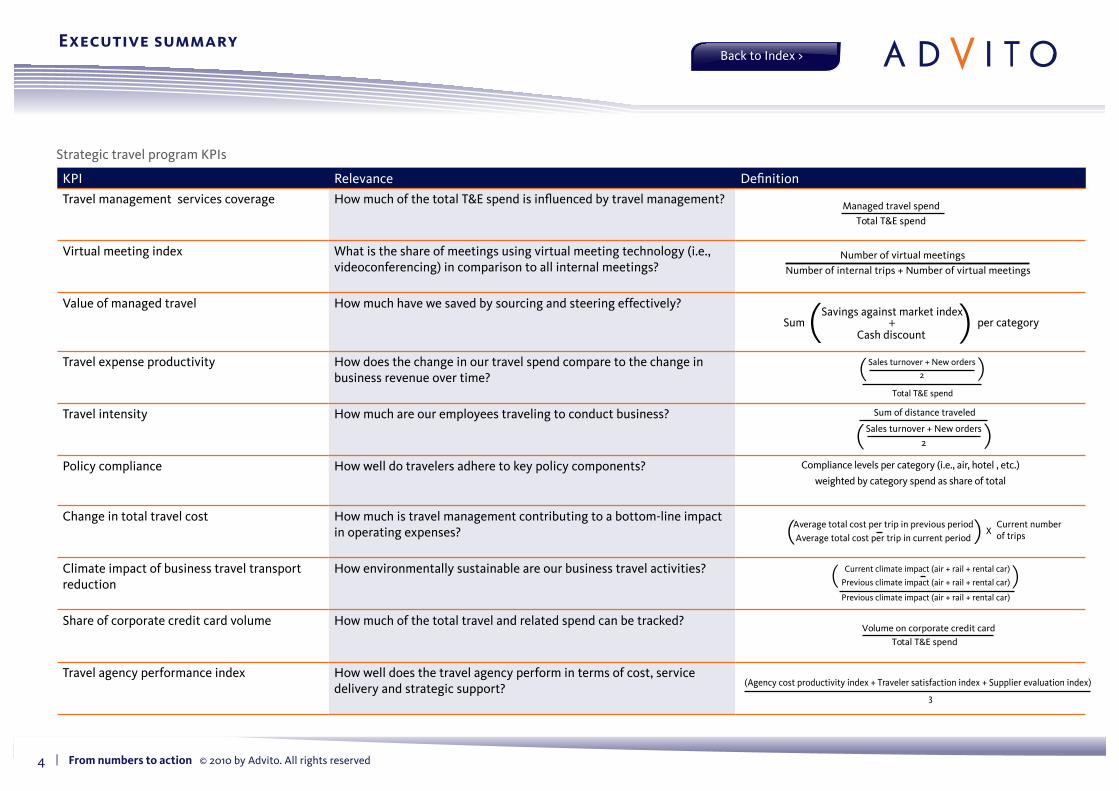
Strategic�travel�program�KPIs
KPI Relevance Definition
Travel�management��services�coverage How�much�of�the�total�T&E�spend�is�influenced�by�travel�management?
Virtual�meeting�index What�is�the�share�of�meetings�using�virtual�meeting�technology�(i.e.,�videoconferencing)�in�comparison�to�all�internal�meetings?
Value�of�managed�travel How�much�have�we�saved�by�sourcing�and�steering�effectively?
Travel�expense�productivity How�does�the�change�in�our�travel�spend�compare�to�the�change�in�business�revenue�over�time?
Travel�intensity How�much�are�our�employees�traveling�to�conduct�business?
Policy�compliance How�well�do�travelers�adhere�to�key�policy�components? Compliance�levels�per�category�(i.e.,�air,�hotel�,�etc.)��
weighted�by�category�spend�as�share�of�total
Change�in�total�travel�cost How�much�is�travel�management�contributing�to�a�bottom-line�impact�in�operating�expenses?
Climate�impact�of�business�travel�transport�reduction
How�environmentally�sustainable�are�our�business�travel�activities?
Share�of�corporate�credit�card�volume How�much�of�the�total�travel�and�related�spend�can�be�tracked?
Travel�agency�performance�index How�well�does�the�travel�agency�perform�in�terms�of�cost,�service�delivery�and�strategic�support?
Managed�travel�spend
Total�T&E�spend
Savings�against�market�indexSum per�category
Cash�discount+( (
Number�of�internal�trips�+�Number�of�virtual�meetings
Number�of�virtual�meetings
Volume�on�corporate�credit�card�
Total�T&E�spend
3
(Agency�cost�productivity�index�+�Traveler�satisfaction�index�+�Supplier�evaluation�index)
Sales�turnover�+�New�orders
Total�T&E�spend
2( (Sales�turnover�+�New�orders
Sum�of�distance�traveled
2( (
Current�numberof�tripsX
Average�total�cost�per�trip�in�previous�periodAverage�total�cost�per�trip�in�current�period( (
( (Current�climate�impact�(air�+�rail�+�rental�car)
Previous�climate�impact�(air�+�rail�+�rental�car)
Previous�climate�impact�(air�+�rail�+�rental�car)
5 �|����From numbers to action���©�2010�by�Advito.�All�rights�reserved
Back�to�Index�>
Value of strategic KPIs•� Education�–�allow�travel�managers�and�other�relevant�managers�to�gain�a�
deeper�understanding�of�the�purpose�of�the�travel�program�•� �Decisive intervention�–�managers�can�intervene�quickly�with�remedies�if�
target�ranges�are�not�being�met•� Communication�–�effective�tools�for�convincing�departments�or�budget-
holders�to�change�their�behavior•� Career progression�–�provide�a�showcase�for�the�issues�travel�managers�
work�on�and�prove�they�are�capable�of�high-level�strategic�thinking
Tips on building a strategic KPI programStep 1�–�Take�it�seriouslyIt�is�a�straightforward�task�for�companies�with�mature�travel�programs�but�it�does�take�time�and�manpower.
Step 2�–�Map�out�your�corporate�strategic�goalsSimplified�examples�include:�cost�containment,�sustainability,�duty�of�care�and�governance/compliance,�employee�productivity�and�employee�satisfaction.
Step 3�–�Map�your�travel�goals�to�your�corporate�strategic�goalsE.g.,�cost�containment�–�reduced�travel�purchasing�costs,�reduced�travel�processing�costs,�reduced�trip�volumes�(travel�program�goals:�savings/cost�avoidance,�demand�management,�negotiation/sourcing)�
Step 4�–�Define�the�appropriate�KPIs�to�measure�your�progressThen�create�a�matrix�to�grade�the�relevance�of�each�KPI�to�each�travel�goal.
Step 5�–�Identify�master�data�sourcesFor�each�KPI,�map�suggested�data�sources,�frequency�of�reporting,�who�has�responsibility�and�the�process�owner.
Step 6�–�Act�on�the�dataInvestigate�and�take�action�on�results�which�fall�outside�anticipated��KPI�ranges.
2.�Meaningful�savings�measurementSince�cost-containment�is�a�critical�corporate�goal�for�most�businesses,�some�of�their�strategic�travel�KPIs�will�also�be�savings-related.�However,�unless�savings�are�given�a�real-world�comparative�context,�they�can�prove�meaningless�and�possibly�misleading.
The procurement perspectiveChange in price�–�cost�saving�based�on�price�comparison�with�previous�yearChange in price compared to change in market index�–�cost�saving/avoidance�based�on�price�comparison�with�index,�e.g.,�volume�variance�(change�in�number�of�bookings�made)�and�market�index�(benchmark�against�average�price�achieved�by�other�companies)Sourcing performance metrics�–�cost�saving/avoidance�achieved�by�changing�requirements,�using�e-auctions,�etc.
Beyond procurementTravel�program�savings�measurements�go�beyond�the�traditional�procurement�context�above.�Key�savings/cost�avoidance�measurements�include:
Behavioral savings�–�equipping�travelers�with�tools�and�motivation�to�“do�the�right�thing”Demand management�–�e.g,�using�video-conferencing�and�other�travel�alternatives
Executive summary
6 �|����From numbers to action���©�2010�by�Advito.�All�rights�reserved
Back�to�Index�>
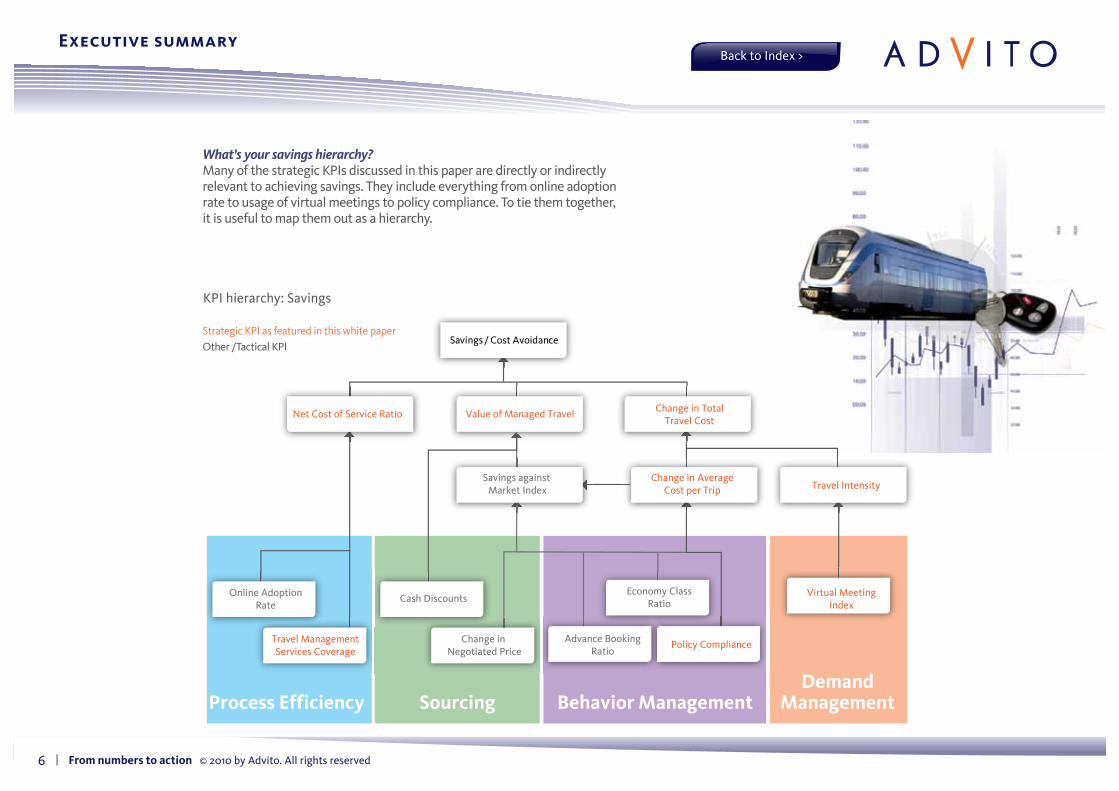
Strategic�KPI�as�featured�in�this�white�paperOther�/Tactical�KPI
What’s your savings hierarchy? Many�of�the�strategic�KPIs�discussed�in�this�paper�are�directly�or�indirectly�relevant�to�achieving�savings.�They�include�everything�from�online�adoption�rate�to�usage�of�virtual�meetings�to�policy�compliance.�To�tie�them�together,�it�is�useful�to�map�them�out�as�a�hierarchy.
Executive summary
KPI�hierarchy:�Savings�
Value�of�Managed�TravelNet�Cost�of�Service�Ratio Change�in�TotalTravel�Cost
Change�in�AverageCost�per�Trip Travel�Intensity
Virtual�MeetingIndex
Travel�ManagementServices�Coverage
Savings�/�Cost�Avoidance�
Savings�against�Market�Index
Policy�ComplianceAdvance�BookingRatio
Economy�ClassRatio
Change�in�Negotiated�Price
Cash�DiscountsOnline�AdoptionRate
Process Efficiency Sourcing Behavior ManagementDemand
Management
7 �|����From numbers to action���©�2010�by�Advito.�All�rights�reserved
Back�to�Index�>
3.�Sourcing,�combining�and�managing�dataSourcing data A�survey�of�Association�of�Corporate�Travel�Executives�buyer�members�carried�out�for�this�white�paper�on�behalf�of�Advito�found�the�most�popular�sources�for�data�are�corporate�card�provider�(86�percent),�travel�management�company�(82�percent),�travel�expense�management�system�(59�percent)�and�accounts�payable�(50�percent).
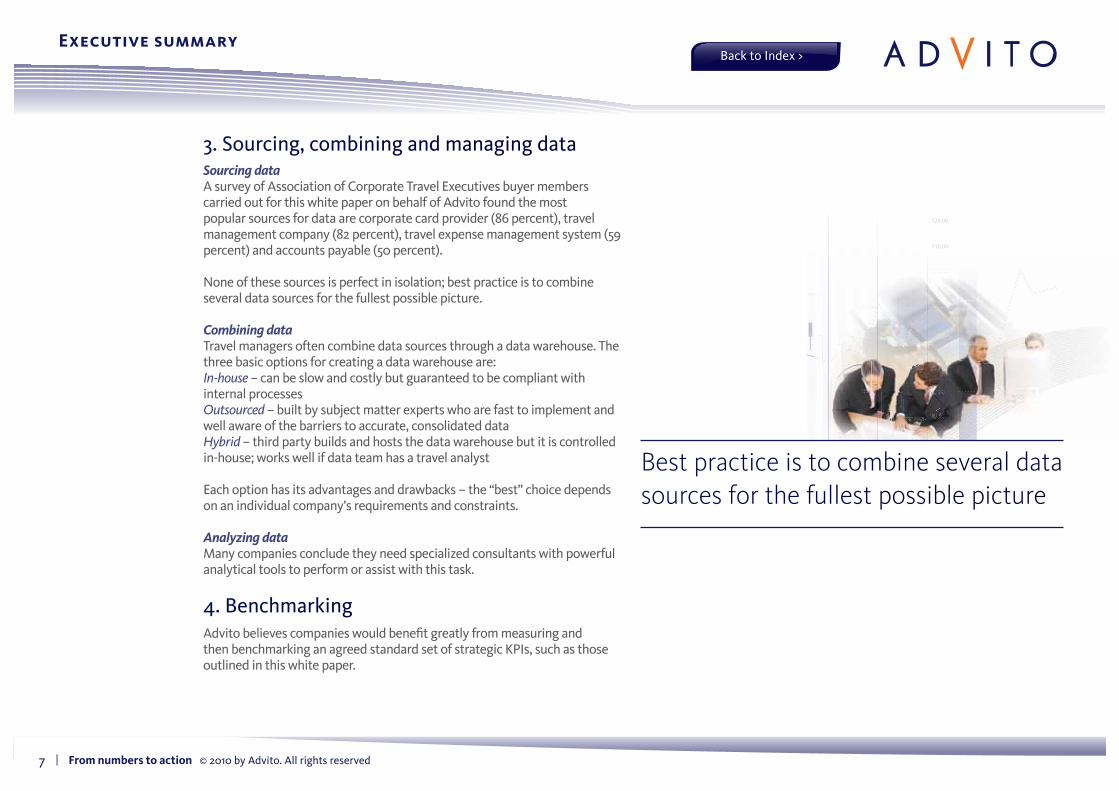
None�of�these�sources�is�perfect�in�isolation;�best�practice�is�to�combine�several�data�sources�for�the�fullest�possible�picture.
Combining dataTravel�managers�often�combine�data�sources�through�a�data�warehouse.�The�three�basic�options�for�creating�a�data�warehouse�are:In-house�–�can�be�slow�and�costly�but�guaranteed�to�be�compliant�with�internal�processesOutsourced�–�built�by�subject�matter�experts�who�are�fast�to�implement�and�well�aware�of�the�barriers�to�accurate,�consolidated�dataHybrid�–�third�party�builds�and�hosts�the�data�warehouse�but�it�is�controlled�in-house;�works�well�if�data�team�has�a�travel�analyst
Each�option�has�its�advantages�and�drawbacks�–�the�“best”�choice�depends�on�an�individual�company’s�requirements�and�constraints.
Analyzing dataMany�companies�conclude�they�need�specialized�consultants�with�powerful�analytical�tools�to�perform�or�assist�with�this�task.
4.�BenchmarkingAdvito�believes�companies�would�benefit�greatly�from�measuring�and�then�benchmarking�an�agreed�standard�set�of�strategic�KPIs,�such�as�those�outlined�in�this�white�paper.
Executive summary
Best practice is to combine several data sources for the fullest possible picture
8 �|����From numbers to action���©�2010�by�Advito.�All�rights�reserved
Back�to�Index�>Introduction | The data challenge for travel managers
From measurement to management There is a well-known business dictum that what gets measured, gets managed. Given the complexity of modern commerce, leadership based largely on “gut feel” has no chance of success.
However,�there�are�also�dangers�inherent�in�this�principle.�If�companies�make�the�wrong�choices�about�what�to�measure,�they�will�form�a�misleading�picture�of�their�performance.�And�there�is�also�the�risk�of�complacency:�the�management�process�starts,�rather�than�finishes,�with�measurement.�Data�does�not�become�useful�unless�it�is�acted�upon�to�make�practical�improvements.
Performance management for corporate travelTravel�managers�know�good�data�is�crucial�for�their�work.�But�which�data�do�they�need?�Are�they�combining�the�appropriate�measurements�for�true�performance�management,�building�a�full�and�actionable�picture�of�what�is�going�on�in�their�travel�program?�And�do�they�have�the�information�which�tells�them�whether�the�travel�program�is�being�managed�in�line�with�their�organization’s�overriding�strategic�objectives?
In�many�cases�the�answer�is�no.�A�good�example�examined�in�this�white�paper�is�the�measurement�of�savings.�Corporations�often�bring�the�wrong�data�sets�together�to�make�comparisons�which�lack�important�context.�As�a�result,�travel�managers�gain�no�meaningful�understanding�of�whether�the�savings�they�have�achieved�match�or�under-perform�their�true�cost-reduction�potential�and�benefit�for�the�corporation.
The crucial role of strategic KPIsWhile�most�travel�managers�use�metrics�to�manage�their�various�program�components�and�initiatives,�their�measurements�are�often�tactical�in�nature—and�sometimes�misleading�as�indicators�of�program�effectiveness.�Frequently�used�metrics�tend�to�monitor�isolated�silos�of�data�such�as�missed�savings�opportunities,�the�average�time�needed�for�a�travel�management�company�to�answer�the�phone�or�average�daily�hotel�rate�in�the�top�ten�cities.�Corporations�frequently�fail�to�analyze�their�travel�data�holistically,�or�to�make�the�essential�connection�that�is�the�key�to�performance�management:�linking�what�they�measure�to�overall�corporate�objectives.�
Advito�believes�businesses�should�create�a�small�set�(around�eight�to�12)�of�strategic�key�performance�indicators�(KPIs)�which�gauge�the�overall�health�and�effectiveness�of�a�travel�program.�These�strategic�KPIs�will�allow�the�travel�manager�to�work�smartly�and�quickly�with�senior�management�to�make�appropriate�decisions�to�meet�corporate�needs.�Rather�than�expecting�stakeholders�without�travel�background�(usually�a�majority�in�any�given�corporation)�to�learn�travel�management�jargon�and�idiosyncrasies,�it�is�up�to�travel�management�to�translate�the�value�of�a�managed�program�into�the�language�of�the�corporation.�This�is�what�strategic�KPIs�do.
9 �|����From numbers to action���©�2010�by�Advito.�All�rights�reserved
Back�to�Index�>
Start collecting your strategic KPIs hereNot�many�companies�have�strategic�KPIs�in�place�today.�However,�that�could,�and�arguably�should,�change.�Getting�this�project�underway�does�not�have�to�entail�an�inordinate�amount�of�work,�especially�for�companies�with�high�levels�of�travel�program�compliance.�This�white�paper�is�intended�to�act�as�a�starting�point�for�travel�performance�management�through�establishing�strategic�KPIs�and�improving�techniques�for�measuring�savings�–�which�is�itself�a�strategic�KPI,�given�that�savings/cost-containment�is�a�key�goal�for�nearly�all�businesses.�
We�also�believe�strategic�KPIs�are�an�area�where�travel�managers�can�benefit�enormously�by�benchmarking�with�each�other.�We�therefore�hope�this�white�paper�will�provide�the�launch�pad�for�an�industry-wide�effort�to�establish�a�set�of�KPIs�that�businesses�can�use�not�only�to�track�their�performance�internally�but�to�understand�where�they�sit�in�comparison�with�their�peers.�
Introduction | The data challenge for travel managers
KPIs and SLAsWhat’s�the�difference?It�can�be�easy�to�blur�the�boundaries�between�KPIs�and�Service�Level�Agreements�(SLAs)—perhaps�because�SLAs�are�more�familiar�territory�for�managed�travel�programs.�But�it�is�important�to�understand�the�difference,�particularly�when�it�comes�to�the�strategic�KPIs�under�discussion�in�this�white�paper.
An�SLA�is�a�formal�negotiated�agreement�between�a�client�and�a�service�provider�which�defines�parameters�and�responsibilities�for�the�delivery�of�a�service.�Adherence�to�the�SLA�is�judged�according�to�measurements�that�quantify�the�performance�of�the�supplier�against�those�parameters.�These�measurements�are�specific,�operational�and/or�tactical.�They�may�be�considered�KPIs�for�the�particular�agreement�in�question,�but�they�are�not�strategic�KPIs�for�the�overall�travel�program�and�its�link�to�strategic�objectives.
However,�suppliers�admittedly�have�an�important�role�to�play�in�helping�companies�achieve�program�and,�in�turn,�corporate�objectives�Once�you�establish�your�strategic�travel�program�KPIs,�you�should�review�relevant�SLAs�to�be�sure�that�they�support�those�KPIs.
KPIs are an area where travel managers can benefit enormously by benchmarking with each other
10 �|����From numbers to action���©�2010�by�Advito.�All�rights�reserved
Back�to�Index�>Section 1 | Strategic KPIs
What is a strategic KPI? Key performance indicators measure operational and management performance against a stated set of objectives. These objectives should be SMART: Specific, Measurable, Achievable, Realistic and Time-limited. Although all KPIs are, by definition, important, strategic KPIs are the most fundamental of all. They measure how well a program, such as the travel program, is performing in meeting core strategic corporate goals, such as revenue generation, cost containment, governance or sustainability. Simply put, they are the critical few metrics that link the travel program goals to corporate objectives.
What is wrong with tactical KPIs?Nothing.�Tactical�KPIs�are�any�quantifiable�measurements�that�can�be�tracked�and�evaluated,�so�they�are�very�important.�However,�they�are�inadequate�to�tell�the�whole�story.�To�take�a�simple�example,�a�useful�tactical�KPI�is�to�know�how�much�cash�discount�is�being�paid�by�suppliers.�However,�if�an�airline�is�paying�a�large�discount�based�on�the�most�expensive�fare�buckets,�then�the�price�reduction�is�less�impressive.�The�tactical�rebate�KPI�therefore�needs�to�contribute�to�a�more�complex�strategic�savings�KPI�to�enable�fuller�understanding�–�and�action.
How many strategic KPIs?We�believe�eight�to�12�is�the�optimum�range.�A�smaller�number�may�fail�to�provide�a�broad�enough�perspective�of�the�travel�program.�A�larger�number�risks�leaving�managers�adrift�in�a�sea�of�data,�unsure�where�and�what�to�prioritize.
The value of strategic KPIs•� Education�–�The�process�of�creating�strategic�KPIs�allows�
travel�managers�and�other�relevant�managers�to�gain�a�deeper�understanding�of�the�purpose�of�the�travel�program.�It�ensures�they�are�aligning�the�program�with�corporate�goals,�reviews�the�program’s�data�sources�and�starts�a�dialogue�with�other�internal�departments�(such�as�finance�or�sustainability).�
•� �Decisive intervention�–�By�creating�target�ranges�for�each�strategic�KPI,�managers�can�identify�at�a�glance�whether�a�strategic�goal�is�being�met�and�intervene�quickly�with�remedies�if�it�is�not.�Intervention�is�not�the�sole�province�of�the�travel�manager;�actions�may�need�to�be�owned�or�implemented�by�other�stakeholders.
•� Communication�–�Strategic�KPIs�are�very�effective�tools�for�convincing�departments�or�budget-holders�to�change�their�behavior,�especially�if�they�are�shown�to�be�under-performing�against�other�units.
•� �Career progression�–�Strategic�KPIs�make�travel�managers�look�good.�Not�only�do�they�provide�a�showcase�for�the�wide�range�of�issues�travel�managers�work�on,�using�strategic�KPIs�also�proves�they�are�capable�of�high-level�strategic�thinking�to�drive�forward�company�objectives.
11 �|����From numbers to action���©�2010�by�Advito.�All�rights�reserved
Back�to�Index�>
ScorecardsReaders�trained�in�business�management�will�be�aware�of�a�strong�link�between�strategic�KPIs�and�the�concept�of�scorecards.�Scorecards�identify�a�small�number�of�financial�and�non-financial�measurements�and�attach�targets�to�them�to�analyze�whether�current�performance�is�meeting�expectations.�In�consequence,�managers�are�able�to�focus�attention�on�those�areas�where�targets�are�not�being�hit.
As�will�be�seen�later,�the�strategic�KPIs�proposed�by�Advito�would�fit�neatly�into�a�scorecard,�with�some�of�the�KPIs�measuring�financial�objectives,�but�others�measuring�a�small�range�of�non-financial�objectives,�such�as�governance�and�sustainability.
Examples of strategic KPIsAdvito�has�identified�a�sample�set�of�generic�strategic�travel�program�KPIs�that�we�believe�would�be�useful�for�many�organizations�to�consider�as�they�support�various�corporate�goals�(see�Figure�1).
Case study�Why�EADS�has�created�strategic�travel�KPIs�EADS�owns�the�commercial�aircraft�manufacturer�Airbus�and�also�makes�military�transport�and�fighter�aircraft,�defense�electronics�and�security�systems�and�space�systems.
“We rely on tactical KPIs as baseline measurements of performance, but more and more we are combining them to produce strategic KPIs which measure the management of our business. They help us to identify issues such as why our spend has risen or if we are missing opportunities to improve our savings.”
“Strategic KPIs are not a collection of numbers. They are a value-adding set of tools which enable us to take decisions. It’s what lies behind the statistics in trending and more qualitative analysis of statistics that helps us identify areas of concern and what we have to deal with. Without strategic KPIs, we cannot be relevant to stakeholders and take relevant actions.”
James Westgarth Head of Extended Travel Enterprise, EADS
Section 1 | Strategic KPIs
Scorecards identify a small number of financial and non-financial measurements and attach targets to them to analyze whether current performance is meeting expectations

12 �|����From numbers to action���©�2010�by�Advito.�All�rights�reserved
Back�to�Index�>
Figure 1�–�Strategic�travel�program�KPIs
Section 1 | Strategic KPIs
KPI Relevance Definition
Travel�management��services�coverage How�much�of�the�total�T&E�spend�is�influenced�by�travel�management?
Virtual�meeting�index What�is�the�share�of�meetings�using�virtual�meeting�technology�(i.e.,�videoconferencing)�in�comparison�to�all�internal�meetings?
Value�of�managed�travel How�much�have�we�saved�by�sourcing�and�steering�effectively?
Travel�expense�productivity How�does�the�change�in�our�travel�spend�compare�to�the�change�in�business�revenue�over�time?
Travel�intensity How�much�are�our�employees�traveling�to�conduct�business?
Policy�compliance How�well�do�travelers�adhere�to�key�policy�components? Compliance�levels�per�category�(i.e.,�air,�hotel�,�etc.)��
weighted�by�category�spend�as�share�of�total
Change�in�total�travel�cost How�much�is�travel�management�contributing�to�a�bottom-line�impact�in�operating�expenses?
Climate�impact�of�business�travel�transport�reduction
How�environmentally�sustainable�are�our�business�travel�activities?
Share�of�corporate�credit�card�volume How�much�of�the�total�travel�and�related�spend�can�be�tracked?
Travel�agency�performance�index How�well�does�the�travel�agency�perform�in�terms�of�cost,�service�delivery�and�strategic�support?
Managed�travel�spend
Total�T&E�spend
Savings�against�market�indexSum per�category
Cash�discount+( (
Number�of�internal�trips�+�Number�of�virtual�meetings
Number�of�virtual�meetings
Volume�on�corporate�credit�card�
Total�T&E�spend
3
(Agency�cost�productivity�index�+�Traveler�satisfaction�index�+�Supplier�evaluation�index)
Sales�turnover�+�New�orders
Total�T&E�spend
2( (Sales�turnover�+�New�orders
Sum�of�distance�traveled
2( (
Current�numberof�tripsX
Average�total�cost�per�trip�in�previous�periodAverage�total�cost�per�trip�in�current�period( (
( (Current�climate�impact�(air�+�rail�+�rental�car)
Previous�climate�impact�(air�+�rail�+�rental�car)
Previous�climate�impact�(air�+�rail�+�rental�car)
13 �|����From numbers to action���©�2010�by�Advito.�All�rights�reserved
Back�to�Index�>
A broad rangeThis�selection�of�KPIs�addresses�a�broad�range�of�corporate�goals,�both�financial�and�non-financial.�There�are�also�major�variations�between�them�in�their�complexity,�in�terms�of:�•� How�much�data�they�combine�•� �The�extent�to�which�they�cover�different�aspects�of�the�corporate�
travel�program�and�the�company’s�wider�activities
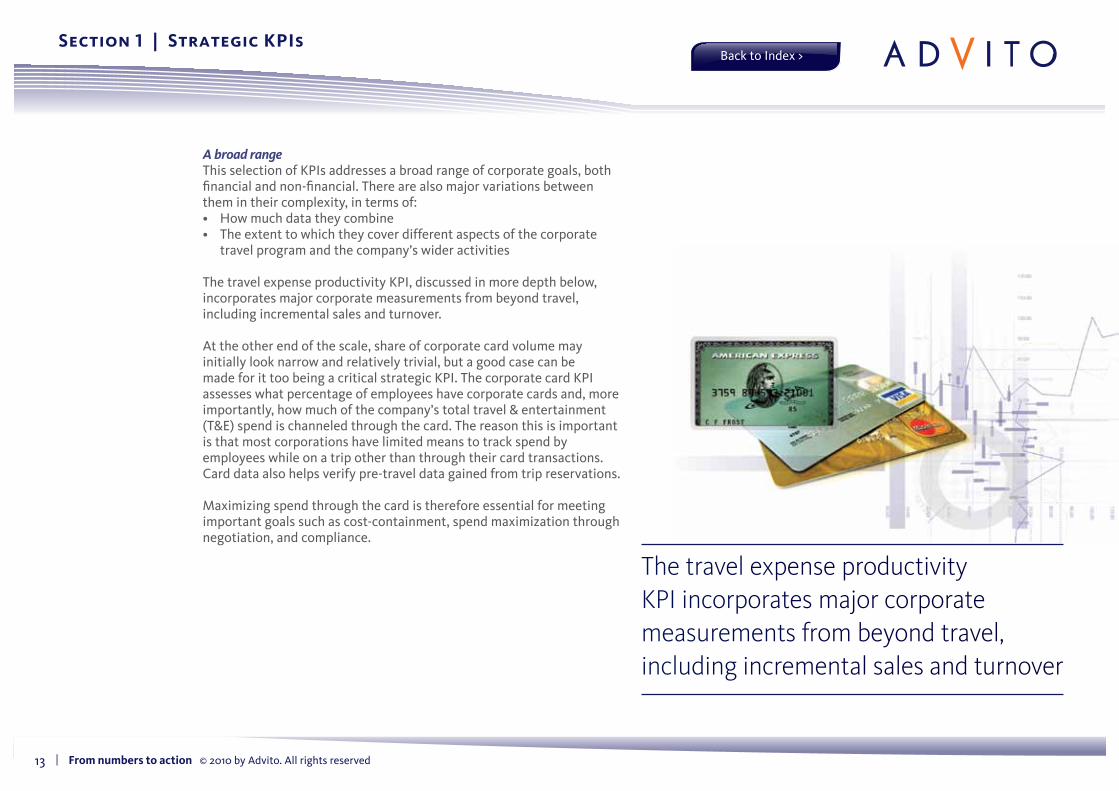
The�travel�expense�productivity�KPI,�discussed�in�more�depth�below,�incorporates�major�corporate�measurements�from�beyond�travel,�including�incremental�sales�and�turnover.�
At�the�other�end�of�the�scale,�share�of�corporate�card�volume�may�initially�look�narrow�and�relatively�trivial,�but�a�good�case�can�be�made�for�it�too�being�a�critical�strategic�KPI.�The�corporate�card�KPI�assesses�what�percentage�of�employees�have�corporate�cards�and,�more�importantly,�how�much�of�the�company’s�total�travel�&�entertainment�(T&E)�spend�is�channeled�through�the�card.�The�reason�this�is�important�is�that�most�corporations�have�limited�means�to�track�spend�by�employees�while�on�a�trip�other�than�through�their�card�transactions.�Card�data�also�helps�verify�pre-travel�data�gained�from�trip�reservations.�
Maximizing�spend�through�the�card�is�therefore�essential�for�meeting�important�goals�such�as�cost-containment,�spend�maximization�through�negotiation,�and�compliance.
Section 1 | Strategic KPIs
The travel expense productivity KPI incorporates major corporate measurements from beyond travel, including incremental sales and turnover
14 �|����From numbers to action���©�2010�by�Advito.�All�rights�reserved
Back�to�Index�>
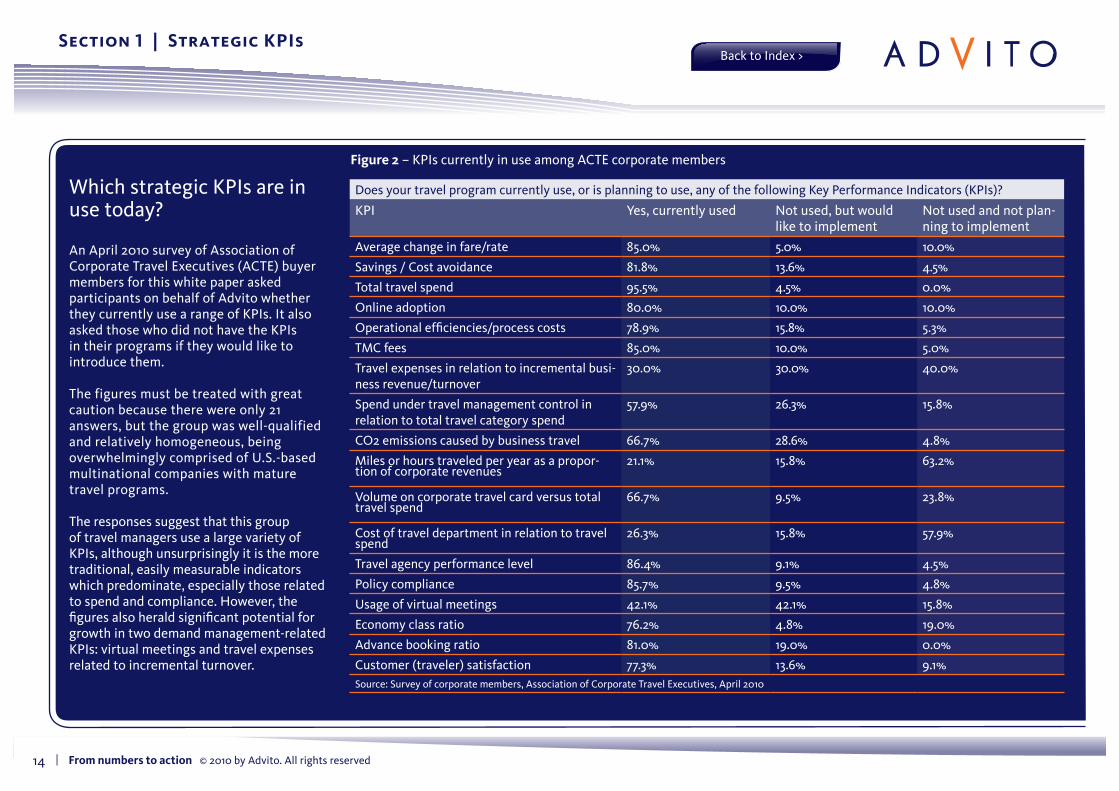
Which�strategic�KPIs�are�in��use�today?�
An�April�2010�survey�of�Association�of�Corporate�Travel�Executives�(ACTE)�buyer�members�for�this�white�paper�asked�participants�on�behalf�of�Advito�whether�they�currently�use�a�range�of�KPIs.�It�also�asked�those�who�did�not�have�the�KPIs�in�their�programs�if�they�would�like�to�introduce�them.
The�figures�must�be�treated�with�great�caution�because�there�were�only�21�answers,�but�the�group�was�well-qualified�and�relatively�homogeneous,�being�overwhelmingly�comprised�of�U.S.-based�multinational�companies�with�mature�travel�programs.
The�responses�suggest�that�this�group�of�travel�managers�use�a�large�variety�of�KPIs,�although�unsurprisingly�it�is�the�more�traditional,�easily�measurable�indicators�which�predominate,�especially�those�related�to�spend�and�compliance.�However,�the�figures�also�herald�significant�potential�for�growth�in�two�demand�management-related�KPIs:�virtual�meetings�and�travel�expenses�related�to�incremental�turnover.
Does�your�travel�program�currently�use,�or�is�planning�to�use,�any�of�the�following�Key�Performance�Indicators�(KPIs)?
KPI Yes,�currently�used Not�used,�but�would�like�to�implement
Not�used�and�not�plan-ning�to�implement
Average�change�in�fare/rate� 85.0% 5.0% 10.0%
Savings�/�Cost�avoidance 81.8% 13.6% 4.5%
Total�travel�spend 95.5% 4.5% 0.0%
Online�adoption 80.0% 10.0% 10.0%
Operational�efficiencies/process�costs 78.9% 15.8% 5.3%
TMC�fees 85.0% 10.0% 5.0%
Travel�expenses�in�relation�to�incremental�busi-ness�revenue/turnover
30.0% 30.0% 40.0%
Spend�under�travel�management�control�in�relation�to�total�travel�category�spend
57.9% 26.3% 15.8%
CO2�emissions�caused�by�business�travel 66.7% 28.6% 4.8%
Miles�or�hours�traveled�per�year�as�a�propor-tion�of�corporate�revenues
21.1% 15.8% 63.2%
Volume�on�corporate�travel�card�versus�total�travel�spend
66.7% 9.5% 23.8%
Cost�of�travel�department�in�relation�to�travel�spend
26.3% 15.8% 57.9%
Travel�agency�performance�level 86.4% 9.1% 4.5%
Policy�compliance 85.7% 9.5% 4.8%
Usage�of�virtual�meetings 42.1% 42.1% 15.8%
Economy�class�ratio 76.2% 4.8% 19.0%
Advance�booking�ratio 81.0% 19.0% 0.0%
Customer�(traveler)�satisfaction 77.3% 13.6% 9.1%Source:�Survey�of�corporate�members,�Association�of�Corporate�Travel�Executives,�April�2010
Figure 2�–�KPIs�currently�in�use�among�ACTE�corporate�members
Section 1 | Strategic KPIs
15 �|����From numbers to action���©�2010�by�Advito.�All�rights�reserved
Back�to�Index�>
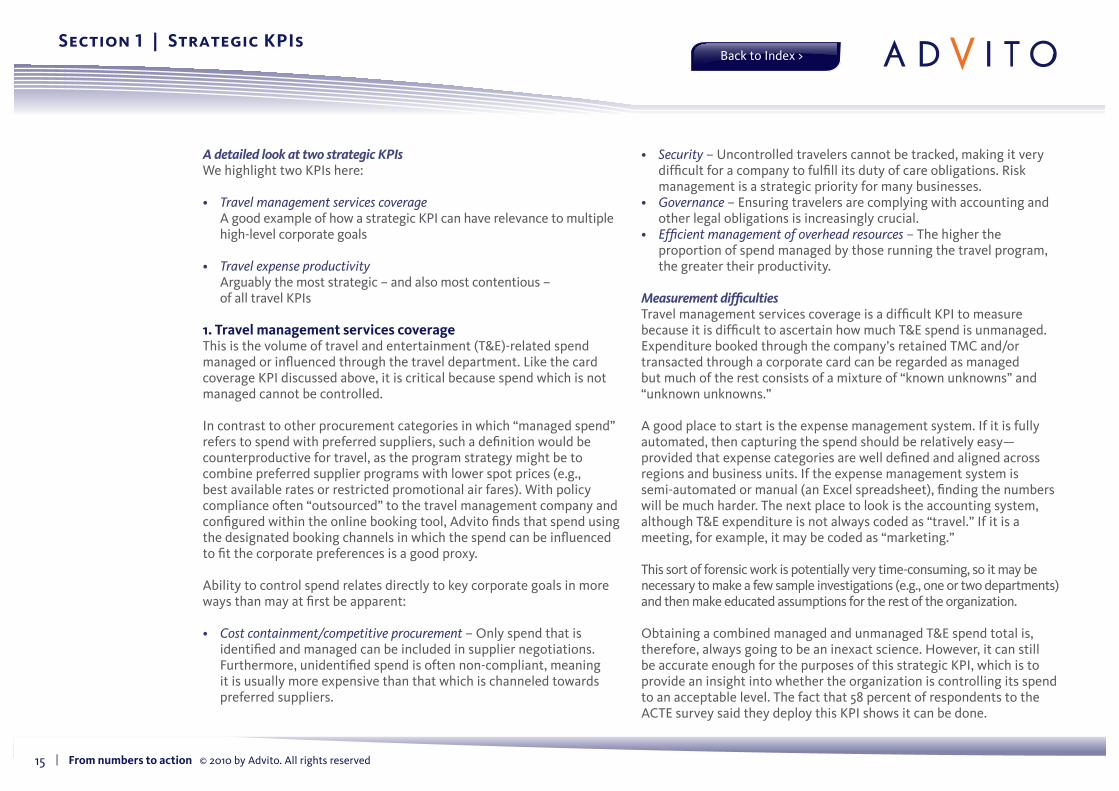
A detailed look at two strategic KPIsWe�highlight�two�KPIs�here:
• Travel management services coverageA�good�example�of�how�a�strategic�KPI�can�have�relevance�to�multiple�high-level�corporate�goals
• Travel expense productivityArguably�the�most�strategic�–�and�also�most�contentious�–��of�all�travel�KPIs
1. Travel management services coverageThis�is�the�volume�of�travel�and�entertainment�(T&E)-related�spend�managed�or�influenced�through�the�travel�department.�Like�the�card�coverage�KPI�discussed�above,�it�is�critical�because�spend�which�is�not�managed�cannot�be�controlled.
In�contrast�to�other�procurement�categories�in�which�“managed�spend”�refers�to�spend�with�preferred�suppliers,�such�a�definition�would�be�counterproductive�for�travel,�as�the�program�strategy�might�be�to�combine�preferred�supplier�programs�with�lower�spot�prices�(e.g.,�best�available�rates�or�restricted�promotional�air�fares).�With�policy�compliance�often�“outsourced”�to�the�travel�management�company�and�configured�within�the�online�booking�tool,�Advito�finds�that�spend�using�the�designated�booking�channels�in�which�the�spend�can�be�influenced�to�fit�the�corporate�preferences�is�a�good�proxy.
Ability�to�control�spend�relates�directly�to�key�corporate�goals�in�more�ways�than�may�at�first�be�apparent:
• Cost containment/competitive procurement –�Only�spend�that�is�identified�and�managed�can�be�included�in�supplier�negotiations.�Furthermore,�unidentified�spend�is�often�non-compliant,�meaning�it�is�usually�more�expensive�than�that�which�is�channeled�towards�preferred�suppliers.
• Security�–�Uncontrolled�travelers�cannot�be�tracked,�making�it�very�difficult�for�a�company�to�fulfill�its�duty�of�care�obligations.�Risk�management�is�a�strategic�priority�for�many�businesses.
• Governance�–�Ensuring�travelers�are�complying�with�accounting�and�other�legal�obligations�is�increasingly�crucial.
• Efficient management of overhead resources�–�The�higher�the�proportion�of�spend�managed�by�those�running�the�travel�program,�the�greater�their�productivity.
Measurement difficultiesTravel�management�services�coverage�is�a�difficult�KPI�to�measure�because�it�is�difficult�to�ascertain�how�much�T&E�spend�is�unmanaged.�Expenditure�booked�through�the�company’s�retained�TMC�and/or�transacted�through�a�corporate�card�can�be�regarded�as�managed�but�much�of�the�rest�consists�of�a�mixture�of�“known�unknowns”�and�“unknown�unknowns.”�
A�good�place�to�start�is�the�expense�management�system.�If�it�is�fully�automated,�then�capturing�the�spend�should�be�relatively�easy—provided�that�expense�categories�are�well�defined�and�aligned�across�regions�and�business�units.�If�the�expense�management�system�is�semi-automated�or�manual�(an�Excel�spreadsheet),�finding�the�numbers�will�be�much�harder.�The�next�place�to�look�is�the�accounting�system,�although�T&E�expenditure�is�not�always�coded�as�“travel.”�If�it�is�a�meeting,�for�example,�it�may�be�coded�as�“marketing.”
This�sort�of�forensic�work�is�potentially�very�time-consuming,�so�it�may�be�necessary�to�make�a�few�sample�investigations�(e.g.,�one�or�two�departments)�and�then�make�educated�assumptions�for�the�rest�of�the�organization.�
Obtaining�a�combined�managed�and�unmanaged�T&E�spend�total�is,�therefore,�always�going�to�be�an�inexact�science.�However,�it�can�still�be�accurate�enough�for�the�purposes�of�this�strategic�KPI,�which�is�to�provide�an�insight�into�whether�the�organization�is�controlling�its�spend�to�an�acceptable�level.�The�fact�that�58�percent�of�respondents�to�the�ACTE�survey�said�they�deploy�this�KPI�shows�it�can�be�done.
Section 1 | Strategic KPIs
16 �|����From numbers to action���©�2010�by�Advito.�All�rights�reserved
Back�to�Index�>
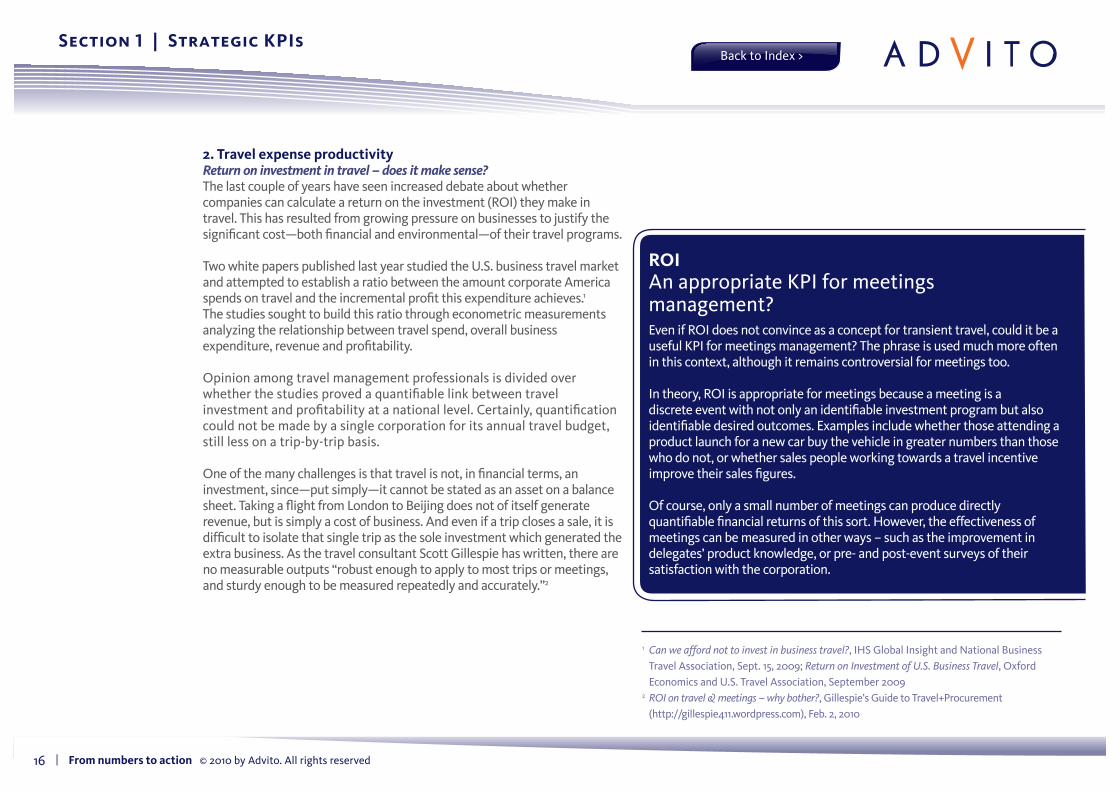
2. Travel expense productivityReturn on investment in travel – does it make sense?The�last�couple�of�years�have�seen�increased�debate�about�whether�companies�can�calculate�a�return�on�the�investment�(ROI)�they�make�in�travel.�This�has�resulted�from�growing�pressure�on�businesses�to�justify�the�significant�cost—both�financial�and�environmental—of�their�travel�programs.�
Two�white�papers�published�last�year�studied�the�U.S.�business�travel�market�and�attempted�to�establish�a�ratio�between�the�amount�corporate�America�spends�on�travel�and�the�incremental�profit�this�expenditure�achieves.1�The�studies�sought�to�build�this�ratio�through�econometric�measurements�analyzing�the�relationship�between�travel�spend,�overall�business�expenditure,�revenue�and�profitability.
Opinion�among�travel�management�professionals�is�divided�over�whether�the�studies�proved�a�quantifiable�link�between�travel�investment�and�profitability�at�a�national�level.�Certainly,�quantification�could�not�be�made�by�a�single�corporation�for�its�annual�travel�budget,�still�less�on�a�trip-by-trip�basis.
One�of�the�many�challenges�is�that�travel�is�not,�in�financial�terms,�an�investment,�since—put�simply—it�cannot�be�stated�as�an�asset�on�a�balance�sheet.�Taking�a�flight�from�London�to�Beijing�does�not�of�itself�generate�revenue,�but�is�simply�a�cost�of�business.�And�even�if�a�trip�closes�a�sale,�it�is�difficult�to�isolate�that�single�trip�as�the�sole�investment�which�generated�the�extra�business.�As�the�travel�consultant�Scott�Gillespie�has�written,�there�are�no�measurable�outputs�“robust�enough�to�apply�to�most�trips�or�meetings,�and�sturdy�enough�to�be�measured�repeatedly�and�accurately.”2
ROIAn�appropriate�KPI�for�meetings�management?Even�if�ROI�does�not�convince�as�a�concept�for�transient�travel,�could�it�be�a�useful�KPI�for�meetings�management?�The�phrase�is�used�much�more�often�in�this�context,�although�it�remains�controversial�for�meetings�too.
In�theory,�ROI�is�appropriate�for�meetings�because�a�meeting�is�a�discrete�event�with�not�only�an�identifiable�investment�program�but�also�identifiable�desired�outcomes.�Examples�include�whether�those�attending�a�product�launch�for�a�new�car�buy�the�vehicle�in�greater�numbers�than�those�who�do�not,�or�whether�sales�people�working�towards�a�travel�incentive�improve�their�sales�figures.
Of�course,�only�a�small�number�of�meetings�can�produce�directly�quantifiable�financial�returns�of�this�sort.�However,�the�effectiveness�of�meetings�can�be�measured�in�other�ways�–�such�as�the�improvement�in�delegates’�product�knowledge,�or�pre-�and�post-event�surveys�of�their�satisfaction�with�the�corporation.
1���Can we afford not to invest in business travel?,�IHS�Global�Insight�and�National�Business�Travel�Association,�Sept.�15,�2009;�Return on Investment of U.S. Business Travel,�Oxford�Economics�and�U.S.�Travel�Association,�September�2009
2���ROI on travel & meetings – why bother?,�Gillespie’s�Guide�to�Travel+Procurement�(http://gillespie411.wordpress.com),�Feb.�2,�2010
Section 1 | Strategic KPIs
17 �|����From numbers to action���©�2010�by�Advito.�All�rights�reserved
Back�to�Index�>
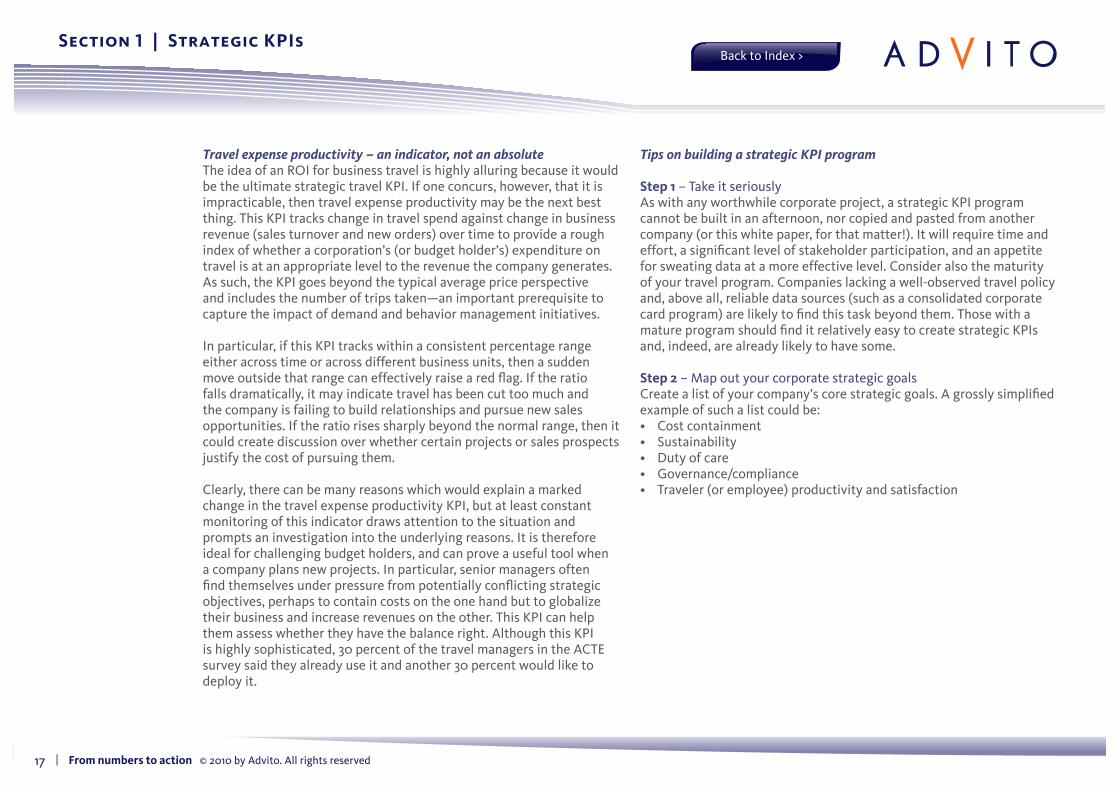
Travel expense productivity – an indicator, not an absoluteThe�idea�of�an�ROI�for�business�travel�is�highly�alluring�because�it�would�be�the�ultimate�strategic�travel�KPI.�If�one�concurs,�however,�that�it�is�impracticable,�then�travel�expense�productivity�may�be�the�next�best�thing.�This�KPI�tracks�change�in�travel�spend�against�change�in�business�revenue�(sales�turnover�and�new�orders)�over�time�to�provide�a�rough�index�of�whether�a�corporation’s�(or�budget�holder’s)�expenditure�on�travel�is�at�an�appropriate�level�to�the�revenue�the�company�generates.�As�such,�the�KPI�goes�beyond�the�typical�average�price�perspective�and�includes�the�number�of�trips�taken—an�important�prerequisite�to�capture�the�impact�of�demand�and�behavior�management�initiatives.
In�particular,�if�this�KPI�tracks�within�a�consistent�percentage�range�either�across�time�or�across�different�business�units,�then�a�sudden�move�outside�that�range�can�effectively�raise�a�red�flag.�If�the�ratio�falls�dramatically,�it�may�indicate�travel�has�been�cut�too�much�and�the�company�is�failing�to�build�relationships�and�pursue�new�sales�opportunities.�If�the�ratio�rises�sharply�beyond�the�normal�range,�then�it�could�create�discussion�over�whether�certain�projects�or�sales�prospects�justify�the�cost�of�pursuing�them.
Clearly,�there�can�be�many�reasons�which�would�explain�a�marked�change�in�the�travel�expense�productivity�KPI,�but�at�least�constant�monitoring�of�this�indicator�draws�attention�to�the�situation�and�prompts�an�investigation�into�the�underlying�reasons.�It�is�therefore�ideal�for�challenging�budget�holders,�and�can�prove�a�useful�tool�when�a�company�plans�new�projects.�In�particular,�senior�managers�often�find�themselves�under�pressure�from�potentially�conflicting�strategic�objectives,�perhaps�to�contain�costs�on�the�one�hand�but�to�globalize�their�business�and�increase�revenues�on�the�other.�This�KPI�can�help�them�assess�whether�they�have�the�balance�right.�Although�this�KPI�is�highly�sophisticated,�30�percent�of�the�travel�managers�in�the�ACTE�survey�said�they�already�use�it�and�another�30�percent�would�like�to�deploy�it.�
Tips on building a strategic KPI program
Step 1�–�Take�it�seriouslyAs�with�any�worthwhile�corporate�project,�a�strategic�KPI�program�cannot�be�built�in�an�afternoon,�nor�copied�and�pasted�from�another�company�(or�this�white�paper,�for�that�matter!).�It�will�require�time�and�effort,�a�significant�level�of�stakeholder�participation,�and�an�appetite�for�sweating�data�at�a�more�effective�level.�Consider�also�the�maturity�of�your�travel�program.�Companies�lacking�a�well-observed�travel�policy�and,�above�all,�reliable�data�sources�(such�as�a�consolidated�corporate�card�program)�are�likely�to�find�this�task�beyond�them.�Those�with�a�mature�program�should�find�it�relatively�easy�to�create�strategic�KPIs�and,�indeed,�are�already�likely�to�have�some.
Step 2�–�Map�out�your�corporate�strategic�goalsCreate�a�list�of�your�company’s�core�strategic�goals.�A�grossly�simplified�example�of�such�a�list�could�be:•� Cost�containment•� Sustainability•� Duty�of�care•� Governance/compliance•� Traveler�(or�employee)�productivity�and�satisfaction�
Section 1 | Strategic KPIs
18 �|����From numbers to action���©�2010�by�Advito.�All�rights�reserved
Back�to�Index�>
Step 3�–�Map�out�your�travel�program�goalsMap�out�which�aspects�of�your�travel�program�relate�to�your�corporate�strategic�goals:
•� �Cost containment�–�reduced�travel�purchasing�costs,�reduced�travel�processing�costs,�reduced�trip�volumes�
� o� �Travel program goals: savings/cost avoidance, demand management, negotiation/sourcing
•� Sustainability�–�reduced�CO2�emissions�caused�by�business�travel�� o� Travel program goals: sustainability, demand management•� Duty of care�–�ensuring�traveler�security,�safety�and�well-being�� o� �Travel program goals: security/duty of care, traveler satisfaction•� Governance/compliance�–�e.g.,�Sarbanes-Oxley,�codes�of�compliance�
for�pharmaceuticals�industry�meetings�� o� Travel program goal: compliance
Even�though�many�corporations�share�top-level�goals,�the�ranking�of�their�importance�to�the�company�and�their�precise�definition�vary�significantly.�It�is�therefore�crucial,�as�part�of�this�effort,�to�understand�the�corporation’s�goal�hierarchy�and�senior�management�expectations�for�the�present�and�foreseeable�future.�Remember�also�that�even�in�public�companies�some�goals�are�not�stated�formally�but�are�applied�as�part�of�a�company-wide�initiative�(e.g.,�an�increased�focus�on�sustainability)�or�emerging�concepts�(e.g.,�a�focus�on�innovation�by�promoting�collaboration).
Step 4 –�Define�the�appropriate�KPIs�to�measure�your�progressOnce�you�understand�how�your�travel�program�goals�relate�to�your�corporate�goals,�you�can�create�strategic�KPIs�to�measure�how�well�you�are�performing�in�achieving�each�of�them.�Make�an�inventory�of�relevant�metrics�you�use�already�as�part�of�managing�the�program�on�a�day-to-day�basis�and�identify�gaps.�Consider�applying�some�of�the�sample�strategic�KPIs�provided�in�figure�1�to�get�started.��
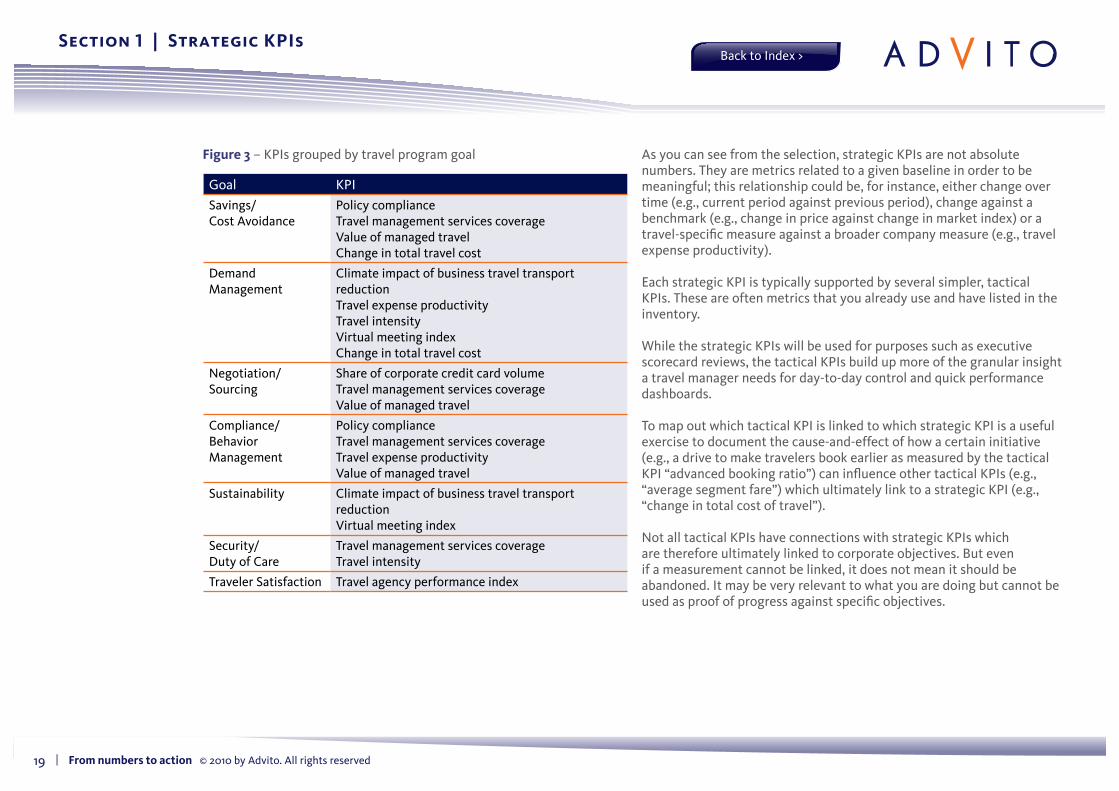
As�a�demonstration�of�how�that�exercise�might�get�underway,�we�have�grouped�the�sample�KPIs�by�their�primary�generic�travel�program�goals�(Figure�3).�Because�many�KPIs�support�several�goals,�creating�a�matrix�that�maps�KPIs�and�program�goals�can�also�be�helpful�to�manage�complexity.
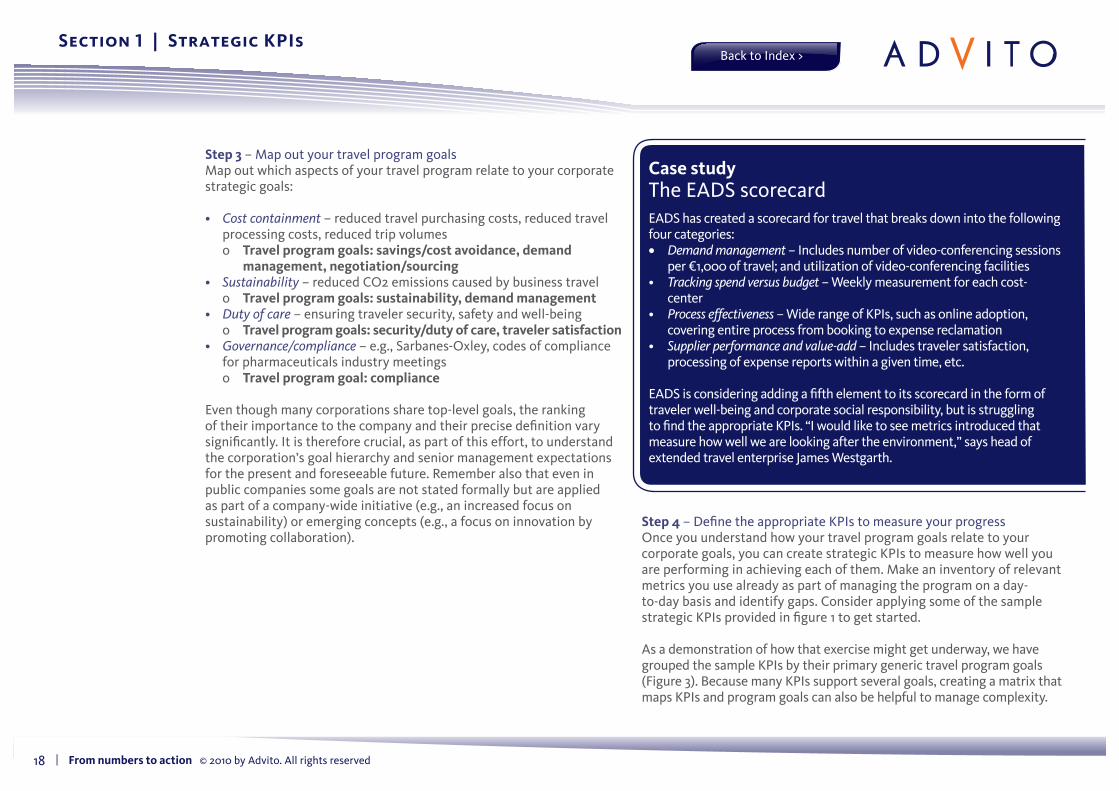
Case studyThe�EADS�scorecardEADS�has�created�a�scorecard�for�travel�that�breaks�down�into�the�following�four�categories:�• Demand management�–�Includes�number�of�video-conferencing�sessions�
per�€1,000�of�travel;�and�utilization�of�video-conferencing�facilities•� �Tracking spend versus budget�–�Weekly�measurement�for�each�cost-
center•� �Process effectiveness�–�Wide�range�of�KPIs,�such�as�online�adoption,�
covering�entire�process�from�booking�to�expense�reclamation•� �Supplier performance and value-add�–�Includes�traveler�satisfaction,�
processing�of�expense�reports�within�a�given�time,�etc.
EADS�is�considering�adding�a�fifth�element�to�its�scorecard�in�the�form�of�traveler�well-being�and�corporate�social�responsibility,�but�is�struggling�to�find�the�appropriate�KPIs.�“I�would�like�to�see�metrics�introduced�that�measure�how�well�we�are�looking�after�the�environment,”�says�head�of�extended�travel�enterprise�James�Westgarth.
Section 1 | Strategic KPIs
19 �|����From numbers to action���©�2010�by�Advito.�All�rights�reserved
Back�to�Index�>
Goal KPI
Savings/�Cost�Avoidance
Policy�compliance�Travel�management�services�coverageValue�of�managed�travelChange�in�total�travel�cost�
Demand�Management
Climate�impact�of�business�travel�transport�reductionTravel�expense�productivity�Travel�intensityVirtual�meeting�indexChange�in�total�travel�cost�
Negotiation/Sourcing
Share�of�corporate�credit�card�volumeTravel�management�services�coverageValue�of�managed�travel
Compliance/Behavior�Management
Policy�compliance�Travel�management�services�coverageTravel�expense�productivity�Value�of�managed�travel
Sustainability Climate�impact�of�business�travel�transport�reductionVirtual�meeting�index
Security/�Duty�of�Care
Travel�management�services�coverageTravel�intensity
Traveler�Satisfaction Travel�agency�performance�index
Figure 3�–�KPIs�grouped�by�travel�program�goal As�you�can�see�from�the�selection,�strategic�KPIs�are�not�absolute�numbers.�They�are�metrics�related�to�a�given�baseline�in�order�to�be�meaningful;�this�relationship�could�be,�for�instance,�either�change�over�time�(e.g.,�current�period�against�previous�period),�change�against�a�benchmark�(e.g.,�change�in�price�against�change�in�market�index)�or�a�travel-specific�measure�against�a�broader�company�measure�(e.g.,�travel�expense�productivity).
Each�strategic�KPI�is�typically�supported�by�several�simpler,�tactical�KPIs.�These�are�often�metrics�that�you�already�use�and�have�listed�in�the�inventory.
While�the�strategic�KPIs�will�be�used�for�purposes�such�as�executive�scorecard�reviews,�the�tactical�KPIs�build�up�more�of�the�granular�insight�a�travel�manager�needs�for�day-to-day�control�and�quick�performance�dashboards.�
To�map�out�which�tactical�KPI�is�linked�to�which�strategic�KPI�is�a�useful�exercise�to�document�the�cause-and-effect�of�how�a�certain�initiative�(e.g.,�a�drive�to�make�travelers�book�earlier�as�measured�by�the�tactical�KPI�“advanced�booking�ratio”)�can�influence�other�tactical�KPIs�(e.g.,�“average�segment�fare”)�which�ultimately�link�to�a�strategic�KPI�(e.g.,�“change�in�total�cost�of�travel”).
Not�all�tactical�KPIs�have�connections�with�strategic�KPIs�which�are�therefore�ultimately�linked�to�corporate�objectives.�But�even�if�a�measurement�cannot�be�linked,�it�does�not�mean�it�should�be�abandoned.�It�may�be�very�relevant�to�what�you�are�doing�but�cannot�be�used�as�proof�of�progress�against�specific�objectives.
Section 1 | Strategic KPIs
20 �|����From numbers to action���©�2010�by�Advito.�All�rights�reserved
Back�to�Index�>
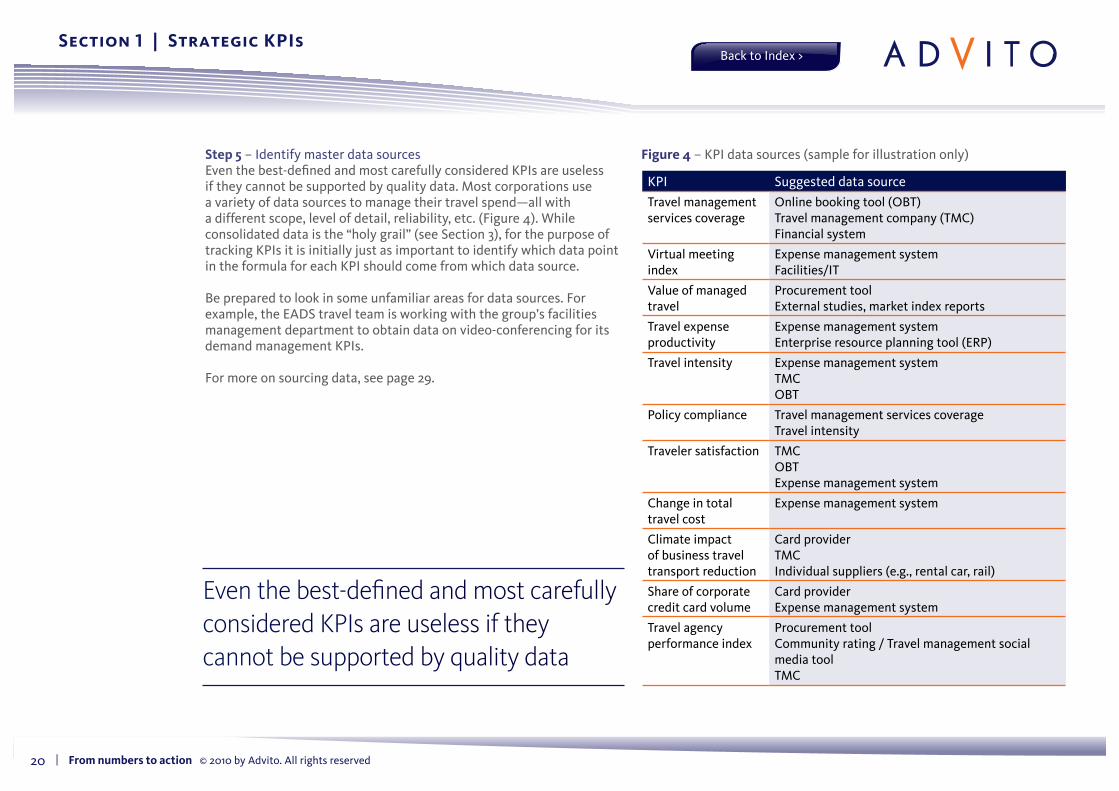
Step 5�–�Identify�master�data�sourcesEven�the�best-defined�and�most�carefully�considered�KPIs�are�useless�if�they�cannot�be�supported�by�quality�data.�Most�corporations�use�a�variety�of�data�sources�to�manage�their�travel�spend—all�with�a�different�scope,�level�of�detail,�reliability,�etc.�(Figure�4).�While�consolidated�data�is�the�“holy�grail”�(see�Section�3),�for�the�purpose�of�tracking�KPIs�it�is�initially�just�as�important�to�identify�which�data�point�in�the�formula�for�each�KPI�should�come�from�which�data�source.
Be�prepared�to�look�in�some�unfamiliar�areas�for�data�sources.�For�example,�the�EADS�travel�team�is�working�with�the�group’s�facilities�management�department�to�obtain�data�on�video-conferencing�for�its�demand�management�KPIs.
For�more�on�sourcing�data,�see�page�29.
KPI Suggested�data�source
Travel�management�services�coverage
Online�booking�tool�(OBT)Travel�management�company�(TMC)Financial�system
Virtual�meeting�index
Expense�management�systemFacilities/IT
Value�of�managed�travel
Procurement�tool�External�studies,�market�index�reports
Travel�expense�productivity
Expense�management�systemEnterprise�resource�planning�tool�(ERP)
Travel�intensity Expense�management�systemTMCOBT
Policy�compliance Travel�management�services�coverageTravel�intensity
Traveler�satisfaction TMCOBTExpense�management�system
Change�in�total�travel�cost
Expense�management�system
Climate�impact�of�business�travel�transport�reduction
Card�providerTMCIndividual�suppliers�(e.g.,�rental�car,�rail)
Share�of�corporate�credit�card�volume
Card�providerExpense�management�system
Travel�agency�performance�index
Procurement�toolCommunity�rating�/�Travel�management�social�media�toolTMC
Figure 4�–�KPI�data�sources�(sample�for�illustration�only)
Section 1 | Strategic KPIs
Even the best-defined and most carefully considered KPIs are useless if they cannot be supported by quality data
21 �|����From numbers to action���©�2010�by�Advito.�All�rights�reserved
Back�to�Index�>
Step 6�–�Track�and�act�on�the�dataSteps�one�through�five�will�only�prove�worthwhile�if�you�track�and�act�on�the�data.�
Use�your�data�to�establish�a�baseline;�work�with�stakeholders�to�establish�a�target�or�target�range�against�which�progress�will�be�measured.��Recall�that�variance�from�a�target�range�can�be�noteworthy:�If�your�KPIs�track�within�a�consistent�percentage�range�either�across�time�or�across�different�business�units,�then�a�sudden�move�outside�that�range�can�effectively�raise�a�red�flag.
Crucial�to�making�data�actionable�is�the�effort�to�make�it�quickly�and�easily�understandable,�both�purely�visually�and�in�the�context�of�overall�company�expectations�or�precedents�for�data�representation.
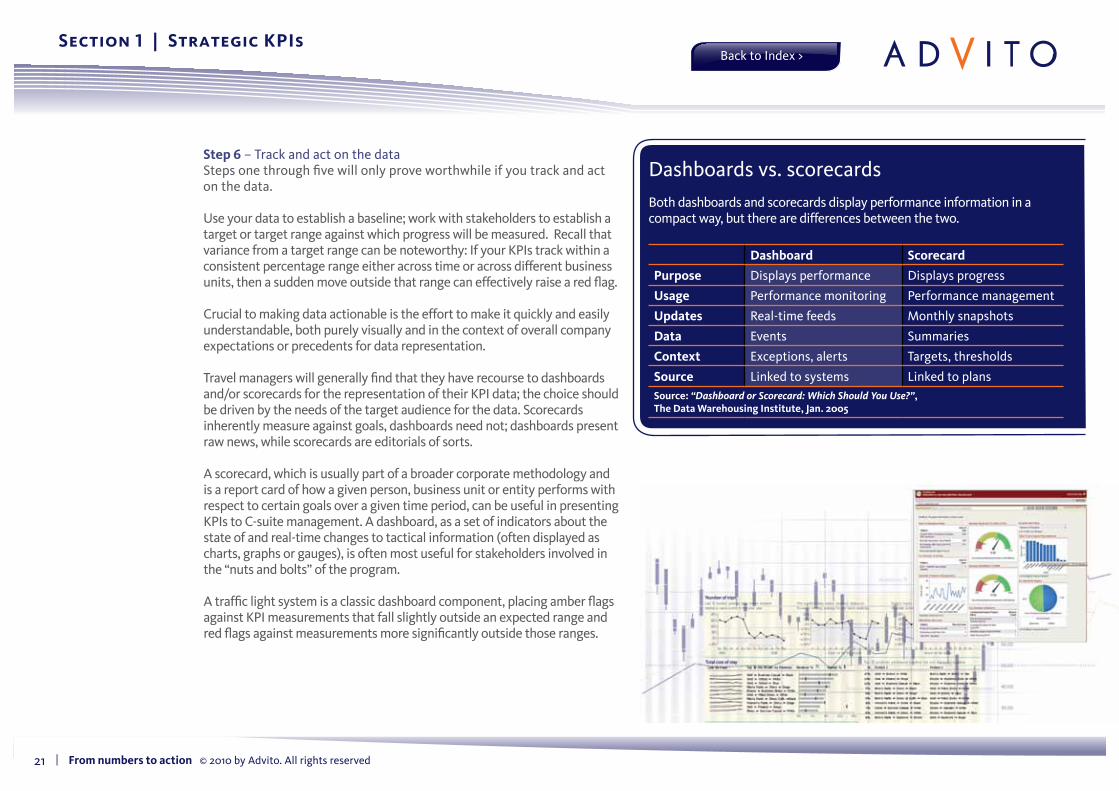
Travel�managers�will�generally�find�that�they�have�recourse�to�dashboards�and/or�scorecards�for�the�representation�of�their�KPI�data;�the�choice�should�be�driven�by�the�needs�of�the�target�audience�for�the�data.�Scorecards�inherently�measure�against�goals,�dashboards�need�not;�dashboards�present�raw�news,�while�scorecards�are�editorials�of�sorts.
A�scorecard,�which�is�usually�part�of�a�broader�corporate�methodology�and�is�a�report�card�of�how�a�given�person,�business�unit�or�entity�performs�with�respect�to�certain�goals�over�a�given�time�period,�can�be�useful�in�presenting�KPIs�to�C-suite�management.�A�dashboard,�as�a�set�of�indicators�about�the�state�of�and�real-time�changes�to�tactical�information�(often�displayed�as�charts,�graphs�or�gauges),�is�often�most�useful�for�stakeholders�involved�in�the�“nuts�and�bolts”�of�the�program.
A�traffic�light�system�is�a�classic�dashboard�component,�placing�amber�flags�against�KPI�measurements�that�fall�slightly�outside�an�expected�range�and�red�flags�against�measurements�more�significantly�outside�those�ranges.
Dashboards�vs.�scorecards
Both�dashboards�and�scorecards�display�performance�information�in�a�compact�way,�but�there�are�differences�between�the�two.
Dashboard Scorecard
Purpose Displays�performance Displays�progress
Usage Performance�monitoring Performance�management
Updates Real-time�feeds Monthly�snapshots
Data Events Summaries
Context Exceptions,�alerts Targets,�thresholds
Source Linked�to�systems Linked�to�plansSource: “Dashboard or Scorecard: Which Should You Use?”,The Data Warehousing Institute, Jan. 2005
Section 1 | Strategic KPIs
22 �|����From numbers to action���©�2010�by�Advito.�All�rights�reserved
Back�to�Index�>
Amber�and�red�flags�can�then�be�investigated,�both�through�quantitative�and�qualitative�sources,�to�understand�what�has�caused�the�variation�from�the�expected�range.�Quantitative�sources�will�most�likely�include�scrutiny�of�tactical�KPIs.�Qualitative�sources�could�include�talking�to�colleagues�in�local�markets.�
The�good�news�is�that�strategic�KPIs�are�inherently�powerful�catalysts�for�action�because�they�are�designed�for�senior�management�to�view,�understand�and�authorize�responses.�It�should�then�be�possible�to�monitor�whether�the�actions�taken�have�been�successful�by�seeing�whether�the�KPIs�return�to�their�expected�ranges.
Even�in�the�post-recession�landscape,�many�travel�managers�are�still�not�measured�beyond�the�savings�they�achieve�in�individual�trip�components�and�online�adoption.�This�should�not�hinder�travel�managers�from�proactively�approaching�the�strategic�program�KPIs�that�go�beyond�their�direct�responsibility.�A�travel�manager�can—and�should—play�the�role�of�a�“process�owner”�who�ensures�that�the�bigger�picture�is�being�addressed�and�managed�from�a�total�program�perspective.�For�each�KPI,�they�need�to�identify�who�holds�ultimate�responsibility.�
For�instance,�travel�managers�can�influence�but�not�control�the�number�of�trips�taken;�the�KPIs�of�travel�intensity�and�virtual�meeting�index�are��typically�controlled�by�the�actions�(and�non-actions)�of�department�heads�or�business�unit�leaders.�The�travel�manager,�however,�can�use�the�KPI�to�discuss�what�drives�traveler�behavior�and�recommend�ways�to�improve�performance.
Such�dialogue�with�key�stakeholders,�with�the�travel�manager�as�facilitator�and�advisor�to�the�business,�promotes�overall�program�strength�and�highlights�the�value�that�travel�management�can�bring�to�the�corporation.
Case studyEADS�takes�action�on�high�faresEADS�regularly�summarizes�its�top�ten�average�city-pair�fare�increases.�The�travel�team�responds�to�this�data�with�detailed�investigations�to�understand�why�the�fares�went�up�and�how�to�remedy�the�situation.�Among�the�reasons�for�increases�it�typically�discovers�are:•� Negotiations�should�have�been�more�aggressive•� An�airline�has�quit�the�route,�reducing�competition•� The�main�fare�class�used�no�longer�exists•� ��Inaccurate�fare�loading
As�a�result,�remedies�which�can�be�applied�include:•� Better�negotiation•� Re-configuration�of�booking�tool�to�reflect�new�booking�class•� Loading�of�correct�fares•� Better�communication�with�travelers�about�which�airline�to�use
Section 1 | Strategic KPIs
23 �|����From numbers to action���©�2010�by�Advito.�All�rights�reserved
Back�to�Index�>
Cost containment is a primary strategic objective at most corporations, so savings measurements naturally feature among their strategic KPIs. However, these measurements need to be the right measurements—ones which provide true insight into whether the actions the company is taking are reducing the cost of travel. That�may�sound�obvious,�but�in�reality�businesses�do�not�always�create�
savings�measurements�which�are�meaningful.�Knowing�an�average�ticket�price�is�$200,�for�example,�is�not�particularly�helpful.�Even�knowing�that�last�year�it�was�$250�is�not�necessarily�helpful�either.�Knowing�you�had�the�potential�to�bring�it�down�to�$180�but�only�achieved�$200,�on�the�other�hand,�is�useful.
Going�further,�the�case�can�be�made�that�some�KPIs�are�potentially�counter-productive.�They�can�drive�buying�behavior�that�pushes�up�the�cost�of�travel�as�buyers�or�budget-holders�make�decisions�which�help�them�meet�their�targets�but�are�not�beneficial�overall�for�the�business.
Stage 1�–�Layered�measurementThe�key,�therefore,�to�meaningful�savings�measurement�is�to�provide�context.�As�a�starting�point,�travel�managers�can�apply�generic�procurement/finance�measurement�approaches.
1.� �Change in price�(i.e.,�(average�previous�price�–�average�current�price)�x�current�units)This�is�an�attractive�measurement�because�it�is�easy�to�make,�but�its�lack�of�context�makes�it�of�limited�use�in�isolation.�With�travel�being�a�recurring�demand�this�looks�like�a�good�approach�(and�is�often�mandated�by�the�finance�department).�However,�the�measurement��can�be�deceptive�because�comparing�spend�year-over-year�or�month-over-month�gives�an�illusion�of�meaningful�context,�especially�for�a�stakeholder�in�a�hurry�and�without�full�understanding�of�the�price�drivers�in�travel.���An�additional�limitation�is�a�reliance�on�a�forecasted�or�expected�definition�of�“price.”�Often�procurement�tracks�the�negotiated�price�
rather�than�actual�price�achieved.�This�an�important�drawback,�since�it�means�that�savings�might�have�been�achieved�on�paper�only,�with�traveler�preference�and�behavior,�restricted�availability�and�other�factors�often�creating�a�major�difference�between�negotiated�prices�and�actual�prices.�
2. Change in price against change in market index Average�fares�and�hotel�rates�are�subject�to�market�dynamics�and�volatile�unit�prices�resulting�from�yield�management�(either�through�actual�price�fluctuations�or�inventory�management).�Consequently,�a�more�realistic�perspective�can�be�obtained�by�linking�achieved�fares�and�rates�to�an�index�showing�other�prices�being�paid�in�the�same�market.
In�turn,�indexing�creates�two�challenges:�•� �What�is�the�right�index?�The�level�of�granularity�can�make�a�big�
difference.�For�accommodation�in�New�York,�for�example,�do�you�make�your�index�the�average�daily�rate�for�upper�upscale�hotels�in�Manhattan,�business�hotels�in�the�whole�of�New�York�City,�all�hotels�in�the�state�or�an�even�broader�base?�
•� �Many�finance�departments�insist�on�a�strict�savings�definition�of�a�bottom-line�price�decrease.�This�means�that�“savings”�which�beat�the�market�but�are�not�“real�savings”�are�referred�to�as�“cost�avoidance.”�Either�way,�we�suggest�tracking�both�measurements�and�being�consistent�in�the�way�a�price�change�is�measured�and�published.�
The�importance�of�understanding�the�options�of�how�savings�may�be�defined,�and�of�understanding�the�implications�and�pros�and�cons�of�the�definition(s)�your�organization�chooses,�cannot�be�overstated.�The�“perfect”�definition�may�not�exist—or,�at�best,�will�vary�from�company�to�company—but�your�program�will�benefit�from�your�awareness�of�your�choices�and�their�consequences.3
Section 2 | meaningful savings measurement
3���For�an�excellent�introduction�to�common�savings�definitions�and�their�implications,�see�Savings Metrics, Rat Farms and KPIs Gone Bad,�Gillespie’s�Guide�to�Travel+Procurement�(http://gillespie411.wordpress.com),�Jan.�29,�2010.
24 �|����From numbers to action���©�2010�by�Advito.�All�rights�reserved
Back�to�Index�>
Market/Destination
Average�RN�price�Jan�-�Jun�‘09
Average�RN�price��Jan�-�Jun�‘08
Roomnights(total)�Jan�-�Jun�‘09
Roomnights(total)��Jan�-�Jun�‘08 Total�revenue�‘09 Total�revenue�‘08
Market�index�development
Volumevariance
Cost�evolutiondue�to�pricevariance
Cost�evolutiondue�to�hotel�industryprice�evolution
Added�value�ofprocurement
SYDNEY 160 212 500 240 80,000 50,880 1% 55,120� -26,000� 1,005.51� 27,005.51�
SHANGHAI 168 167 50 60 8,400 10,020 -13% -1,670� 50� -1,107.16� -1,157.16�
CAIRO 134 96 70 60 9,380 5,760 -6% 960� 2,660� -396.48�� -3,056.48�
DELHI 94 130 40 50 3,760 6,500 -21% -1,300� -1,440� -1,076.70� 363.30�
SEOUL 235 175 500 600 117,500 105,000 4% -17,500� 30,000�� 3,106.38� -26,893.62�
BRUSSELS 185 275 800 900 148,000 247,500 -3% -27,500� -72,000� -5,592.45� 66,407.55�
COPENHAGEN 178 270 700 80 124,600 21,600 -4% 167,400� -64,400� -7,220.47� 57,179.53�
PARIS 199 242 2,500 1,500 497,500 363,000 -2% 242,000� -107,500� -12,523.50� 94,976.50�
FRANKFURT 147 193 1,000 600 147,000 115,800 -5% 77,200� -46,000� -9,688.60� 36,311.40�
BARCELONA 164 187 2,300 2,000 377,200 374,000 -7% 56,100� -52,900� -30,584.43� 22,315.57�
LONDON�UK 155 199 1,800 2,000 279,000 398,000 -8% -39,800� -79,200� -28,548.54� 50,651.46�
MEXICO�CITY 164 153 200 140 32,800 21,420 15% 9,180� 2,200� 4,714.34� 2,514.34�
VANCOUVER 128 147 400 300 51,200 44,100 -1% 14,700� -7,600� -305.76� 7,294.24�
HOUSTON 185 163 600 780 111,000 127,140 0% -29,340� 13,200� -419.54� -13,619.54�
NEW�YORK 205 276 1,800 1,200 369,000 331,200 1% 165,600� -127,800� 2,484.00� 130,284.00�
13,260 10,510 2,356,340 2,221,920 671,150 -536,730 -86,153.41 450,576.59
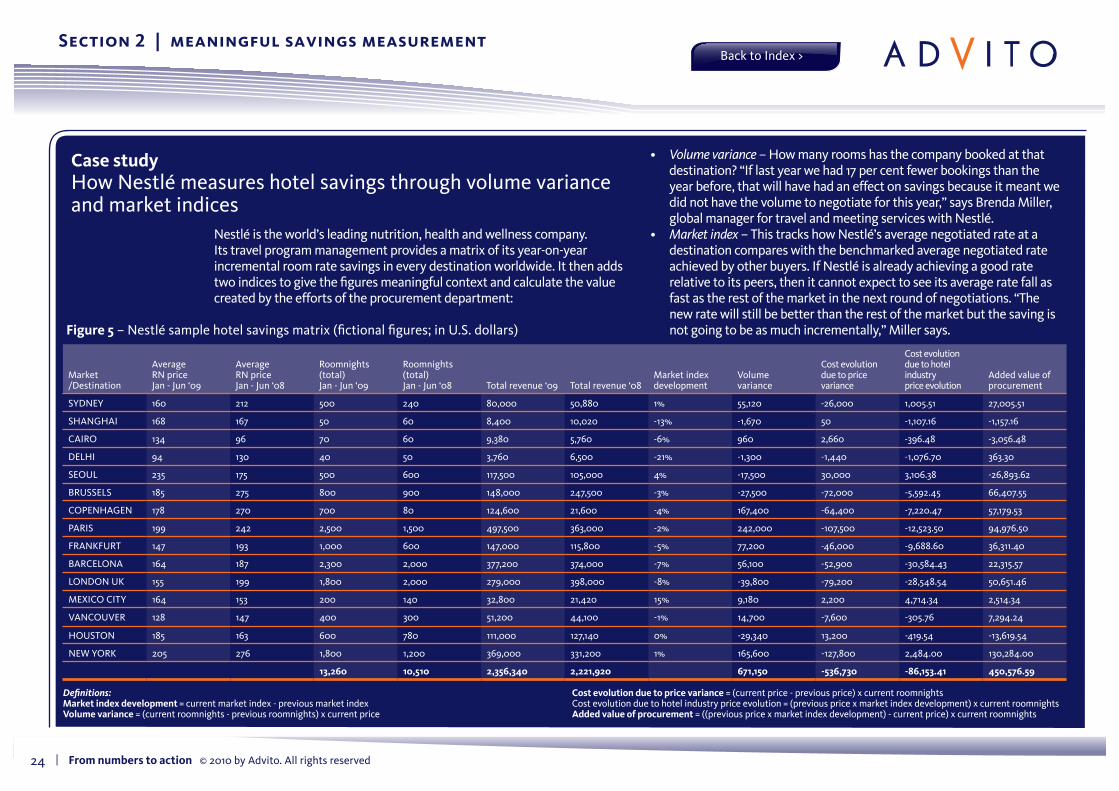
Case study�How�Nestlé�measures�hotel�savings�through�volume�variance�and�market�indices
Nestlé�is�the�world’s�leading�nutrition,�health�and�wellness�company.�Its�travel�program�management�provides�a�matrix�of�its�year-on-year�incremental�room�rate�savings�in�every�destination�worldwide.�It�then�adds�two�indices�to�give�the�figures�meaningful�context�and�calculate�the�value�created�by�the�efforts�of�the�procurement�department:
•� �Volume variance�–�How�many�rooms�has�the�company�booked�at�that�destination?�“If�last�year�we�had�17�per�cent�fewer�bookings�than�the�year�before,�that�will�have�had�an�effect�on�savings�because�it�meant�we�did�not�have�the�volume�to�negotiate�for�this�year,”�says�Brenda�Miller,�global�manager�for�travel�and�meeting�services�with�Nestlé.
•� �Market index�–�This�tracks�how�Nestlé’s�average�negotiated�rate�at�a�destination�compares�with�the�benchmarked�average�negotiated�rate�achieved�by�other�buyers.�If�Nestlé�is�already�achieving�a�good�rate�relative�to�its�peers,�then�it�cannot�expect�to�see�its�average�rate�fall�as�fast�as�the�rest�of�the�market�in�the�next�round�of�negotiations.�“The�new�rate�will�still�be�better�than�the�rest�of�the�market�but�the�saving�is�not�going�to�be�as�much�incrementally,”�Miller�says.�Figure 5�–�Nestlé�sample�hotel�savings�matrix�(fictional�figures;�in�U.S.�dollars)
Section 2 | meaningful savings measurement
Definitions:Market index development =�current�market�index�-�previous�market�indexVolume variance�=�(current�roomnights�-�previous�roomnights)�x�current�price
Cost evolution due to price variance�=�(current�price�-�previous�price)�x�current�roomnightsCost�evolution�due�to�hotel�industry�price�evolution�=�(previous�price�x�market�index�development)�x�current�roomnightsAdded value of procurement�=�((previous�price�x�market�index�development)�-�current�price)�x�current�roomnights
25 �|����From numbers to action���©�2010�by�Advito.�All�rights�reserved
Back�to�Index�>
Miller�believes�the�two�indices,�which�she�also�uses�for�air�travel,�give�a�much�more�accurate�picture�of�how�her�department�is�performing.�“In�the�first�half�of�this�year,�airlines�made�more�fares�available�in�lower�business-class�buckets,”�she�says.�“That�increased�access�for�the�rest�of�the�market�
to�lower�fares�and�brought�average�ticket�prices�much�closer�to�the�good�fares�we�were�already�getting.�The�numbers�we�provide�explained�that.�On�the�other�hand,�the�numbers�also�show�the�value�we�bring�to�the�company’s�travel�program�rather�than�just�taking�advantage�of�the�downturn.”
3.� Sourcing performance metrics (e,g., discounts achieved by changing requirements, using e-auctions, etc.)These�specific�measurements�are�helpful�for�assessing�what�impact�the�procurement�process�had�in�achieving�a�lower�price.�However,�once�again�there�are�potential�pitfalls�to�be�aware�of:�� Unit price of old contracts versus unit price of new contractsThis�measurement�tracks�the�level�of�discount�buyers�have�obtained,�but�can�be�misleading�if�it�inadvertently�rewards�buyers�for�concentrating�on�the�highest-priced�fare�or�rate�categories�where�the�potential�for�obtaining�discounts�is�greatest.��Published unit price versus negotiated unit price This�measurement�potentially�encourages�buyers�to�work�with�high-margin�suppliers�who�have�the�greatest�capacity�for�offering�discounts.�The�corporation�might�obtain�far�lower�prices�by�using�a�low-cost�carrier,�but�since�budget�airlines�do�not�usually�offer�corporate�discounts,�the�buyer�would�not�be�recognized�or�rewarded.�With�increasingly�sophisticated�yield�management�techniques�and�the�increasing�prevalence�of�best�available�rates,�looking�at�negotiated�unit�price�is�in�any�case�becoming�an�increasingly�anachronistic�form�of�analysis.
Behavioral savingsThe�aim�of�behavior�management�is�to�improve�compliance�to�policy�and—ideally—to�achieve�results�better�than�policy.�Savings�through�behavior�management�thus�refer�to�equipping�travelers�with�the�tools�and�motivation�to�“do�the�right�thing.”
Travel�managers�can�complement�supplier�programs�with�best�available�market�prices�(also�known�as�“spot�air�fares”�and�“spot�hotel�rates”),�initiate�projects�to�increase�the�advance�booking�ratio�and�run�education�and�awareness�programs.�
With�most�organizations�with�significant�travel�spend�having�mature�preferred�supplier�programs�and�minor�incremental�savings,�the�potential�that�can�be�achieved�through�behavior�management�is�significant.�As�these�savings�fall�outside�traditional�procurement�metrics,�it�is�important�to�define�related�metrics�and�achieve�consensus�on�how�they�might�be�considered�in�the�saving�framework.
One�point�of�caution:�Often�savings�are�claimed�“predictively”�following�negotiation.�Behavioral�savings�initiatives�will�tend�to�help�you�realize�the�savings�you’ve�already�claimed.�It�is�imperative�to�understand�the�overlap�and�avoid�double-counting�the�success�achieved.
Section 2 | meaningful savings measurement
26 �|����From numbers to action���©�2010�by�Advito.�All�rights�reserved
Back�to�Index�>
Demand managementBut�all�of�the�above�contextualization�still�fails�to�present�a�complete�savings�picture.�For�example,�what�about�demand�management?�Most�of�the�discussion�above�has�been�about�cost�per�trip,�but�the�number�of�trips�a�company�makes�affects�its�level�of�travel�expenditure�even�more�profoundly.�
Traditionally,�number�of�trips�has�not�been�considered�relevant�to�savings�measurement,�because�procurement�has�not�been�involved�in�making�decisions�on�whether�someone�should�travel�or�not.�Such�attitudes�are�now�changing�with�the�evolution�of�demand�management,�for�example�through�encouraging�video�conferencing�and�other�travel�alternatives.
Demand�management�appears�to�be�making�an�impact,�but�it�is�an�impact�that�is�hard�to�quantify.�How�can�one�demonstrate�that�a�specific�procurement�or�travel�management�project�really�led�to�sending�only�one�employee�to�a�meeting�instead�of�several�or�replacing�that�trip�with�a�virtual�meeting?�
For�the�time�being,�“savings”�considered�attributable�to�demand�management�are�typically�categorized�as�“cost�avoidance”�but�they�remain�important�to�track�as�part�of�the�total�cost�perspective.�Some�of�the�strategic�KPIs�provided,�such�as�travel�expense�productivity,�travel�intensity�and�virtual�meeting�index�will�help�companies�get�closer�to�providing�hard�facts.
Case studyNestlé�measures�savings�lost�through�traveler�behaviorNestlé�provides�a�dashboard�report�to�C-level�executives�detailing�lost�savings�owing�to�traveler�behavior.�The�report�includes:•� Tickets�issued�within�seven�days�of�travel•� Lowest�fares�within�policy�not�accepted•� �Missed�room�nights�–�i.e.,�when�travelers�have�booked�a�flight�involving�
overnight�travel�but�not�booked�a�hotel�room�as�well•� Online�booking�adoption
It�may�sound�obvious,�but…•� �There�is�a�big�difference�between�claiming�negotiated�savings�and�
actual�savings.•� �Savings�criteria�always�need�to�be�cleared�with�the�finance�department�
in�your�organization�–�sometimes�cost�avoidance�can�be�claimed,�sometimes�not!
Section 2 | meaningful savings measurement
27 �|����From numbers to action���©�2010�by�Advito.�All�rights�reserved
Back�to�Index�>
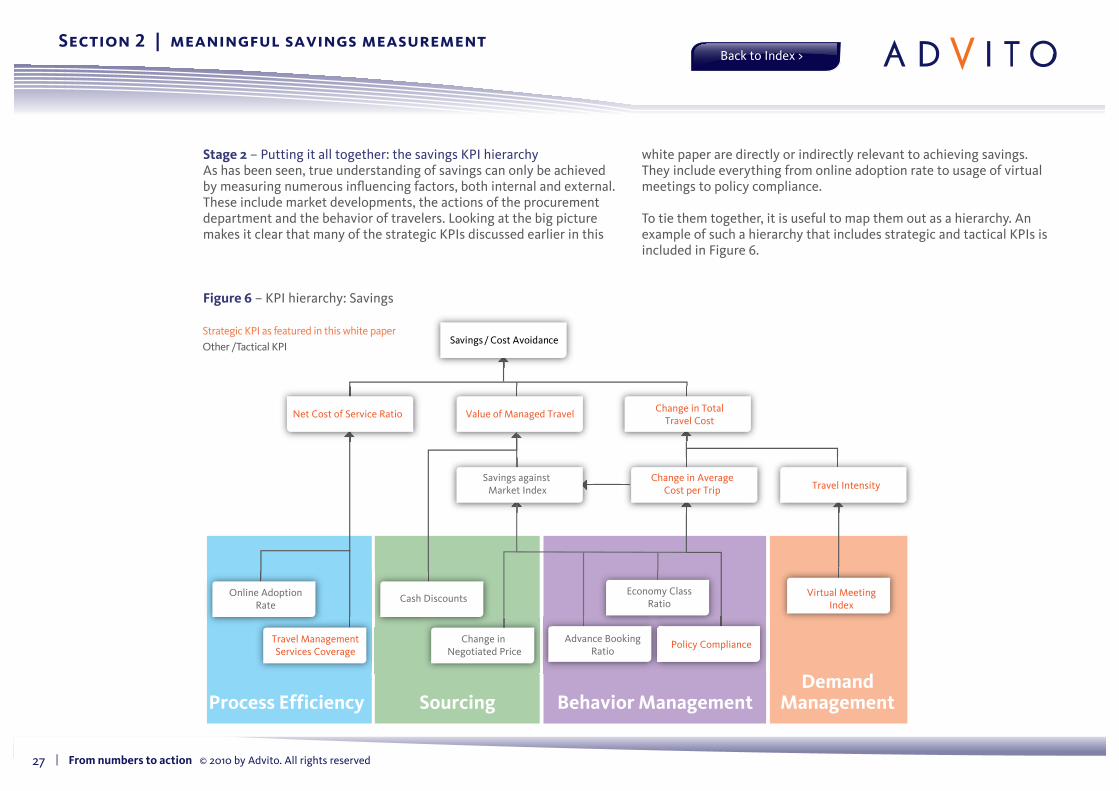
Stage 2�–�Putting�it�all�together:�the�savings�KPI�hierarchyAs�has�been�seen,�true�understanding�of�savings�can�only�be�achieved�by�measuring�numerous�influencing�factors,�both�internal�and�external.�These�include�market�developments,�the�actions�of�the�procurement�department�and�the�behavior�of�travelers.�Looking�at�the�big�picture�makes�it�clear�that�many�of�the�strategic�KPIs�discussed�earlier�in�this�
white�paper�are�directly�or�indirectly�relevant�to�achieving�savings.�They�include�everything�from�online�adoption�rate�to�usage�of�virtual�meetings�to�policy�compliance.
To�tie�them�together,�it�is�useful�to�map�them�out�as�a�hierarchy.�An�example�of�such�a�hierarchy�that�includes�strategic�and�tactical�KPIs�is�included�in�Figure�6.
Figure 6�–�KPI�hierarchy:�Savings�
Section 2 | meaningful savings measurement
Strategic�KPI�as�featured�in�this�white�paperOther�/Tactical�KPI
Value�of�Managed�TravelNet�Cost�of�Service�Ratio Change�in�TotalTravel�Cost
Change�in�AverageCost�per�Trip Travel�Intensity
Virtual�MeetingIndex
Travel�ManagementServices�Coverage
Savings�/�Cost�Avoidance�
Savings�against�Market�Index
Policy�ComplianceAdvance�BookingRatio
Economy�ClassRatio
Change�in�Negotiated�Price
Cash�DiscountsOnline�AdoptionRate
Process Efficiency Sourcing Behavior ManagementDemand
Management
28 �|����From numbers to action���©�2010�by�Advito.�All�rights�reserved
Back�to�Index�>
The�hierarchical�approach�illustrated�here�for�a�savings/cost�avoidance�strategic�objective�can�of�course�be�applied�to�all�strategic�objectives�(i.e.,�sustainability,�traveler�satisfaction,�etc.)�
This�illustration�is�also�simplified;�readers�may�rightly�note�that�there�are�potential�overlaps�in�the�assignment�of�KPIs�to�“foundation”�categories�(i.e.,�Process�Efficiency,�Behavior�Management).�Online�adoption�rate�could,�for�example,�be�placed�under�Behavior�Management.�The�structure�of�the�hierarchy�will�depend�on�an�individual�company’s�priorities,�strategy,�initiatives�and�company�culture.
It�should�be�clear�by�now�that�the�quest�for�a�perfect,�20/20�vision�of�savings�is�one�that�can�never�be�fully�achieved.�However,�judicious�use�of�KPIs�and�an�understanding�that�savings�have�to�be�measured�from�multiple�perspectives�can�give�buyers�more�than�enough�visibility�to�reduce�cost�within�their�organization.
Case studyBudget�tracking,�demand�management�and�fare�rise�investigations�–�how�EADS�measures�its�savingsLike�Nestlé,�there�are�some�distinctive�aspects�to�the�EADS�travel�savings�strategy.�
Tracking spend versus budgetPrimarily,�EADS�takes�a�top-down�approach.�“We�find�it�much�more�meaningful�if�the�group�sets�targets�for�how�much�each�business�can�spend�on�travel,”�says�head�of�extended�travel�enterprise�James�Westgarth.�“Financial�controllers�are�well�aware�of�what�the�targets�are.�We�measure�whether�they�hit�them.”
Cost analysisEADS�divides�its�cost�analysis�into�three�categories:•� �Unit�cost�–�the�traditional�area�of�travel�management.�Like�Nestlé,�
there�is�significant�focus�on�booking�behavior,�including�average�time�between�booking�and�departure,�usage�of�restricted�tickets�and�number�of�hotel�bookings�in�policy.
•� �Transaction�cost�–�e.g.,�online�adoption�rate�(booking�offline�generates�a�higher�TMC�fee)
•� �Effective�management�of�demand�–�attempting�to�quantify�how�much�is�saved�by�eliminating�travel.�EADS�collects�data�on�use�of�video-conferencing�and�has�also�introduced�a�program�to�track�whether�two�people�from�the�same�cost-center�are�traveling�to�the�same�destination�on�the�same�day.�Any�duplication�is�highlighted�in�the�travelers’�itineraries�and�it�is�logged�if�one�of�them�cancels�their�trip�in�consequence.
Section 2 | meaningful savings measurement
The structure of the hierarchy will depend on an individual company’s priorities, strategy, initiatives and company culture
29 �|����From numbers to action���©�2010�by�Advito.�All�rights�reserved
Back�to�Index�>
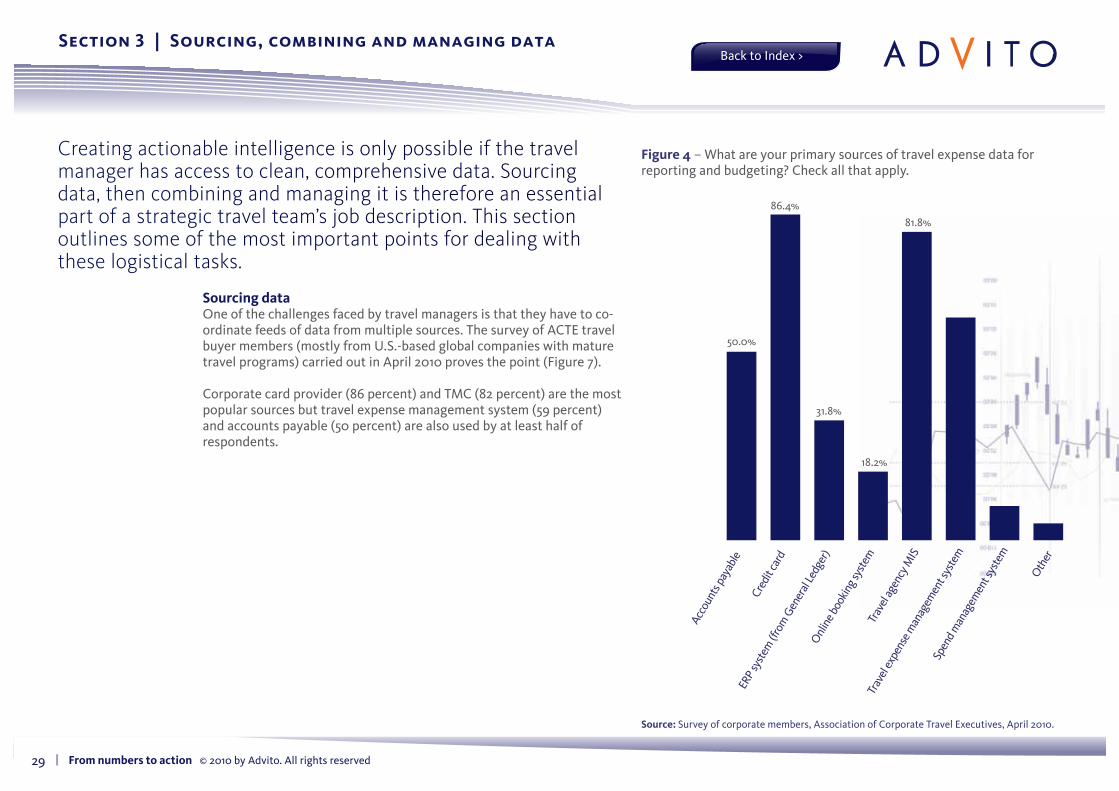
Creating actionable intelligence is only possible if the travel manager has access to clean, comprehensive data. Sourcing data, then combining and managing it is therefore an essential part of a strategic travel team’s job description. This section outlines some of the most important points for dealing with these logistical tasks.
Sourcing dataOne�of�the�challenges�faced�by�travel�managers�is�that�they�have�to�co-ordinate�feeds�of�data�from�multiple�sources.�The�survey�of�ACTE�travel�buyer�members�(mostly�from�U.S.-based�global�companies�with�mature�travel�programs)�carried�out�in�April�2010�proves�the�point�(Figure�7).�
Corporate�card�provider�(86�percent)�and�TMC�(82�percent)�are�the�most�popular�sources�but�travel�expense�management�system�(59�percent)�and�accounts�payable�(50�percent)�are�also�used�by�at�least�half�of�respondents.
Accounts�payable
Credit�card
ERP�system
�(from�General�Ledger)
Online�b
ooking�system
Travel�ag
ency�MIS
Travel�ex
pense�m
anagem
ent�system
Spend�managem
ent�system
Other
50.0%
86.4%
81.8%
31.8%
18.2%
Figure 4�–�What�are�your�primary�sources�of�travel�expense�data�for�reporting�and�budgeting?�Check�all�that�apply.�
Source: Survey�of�corporate�members,�Association�of�Corporate�Travel�Executives,�April�2010.
Section 3 | Sourcing, combining and managing data
30 �|����From numbers to action���©�2010�by�Advito.�All�rights�reserved
Back�to�Index�>
Working�with�internal�sources�can�be�problematic�because�expense�categories�often�vary�across�the�business.�This�leads�to�some�travel-related�expenses�being�missed�if�they�are,�for�example,�labeled�as�“training.”�
However,�as�the�survey�indicates,�managers�of�mature�travel�programs�usually�have�access�to�high-quality�data�feeds�through�those�two�crucial�external�data�channels—card�and�TMC.�If�a�high�percentage�of�spend�is�not�directed�through�these�two�channels,�any�attempts�to�analyze�and�act�upon�data�will�prove�an�uphill�struggle.�If�a�high�percentage�is�driven�through�them,�there�is�every�chance�of�success.�“Travel�has�a�big�advantage�over�some�other�procurement�categories�because�we�have�great�data�suppliers,”�says�Nestlé�global�manager�for�travel�and�meetings�Brenda�Miller.�
Combining dataEven�though�travel�managers�have�access�to�some�excellent�sources�of�data,�there�can,�for�many�reasons,�be�gaps�and�overlaps�in�those�sources’�coverage.�As�an�example—leaving�aside�data�consolidation�capabilities,�the�travel�management�company�primarily�provides�data�based�on�bookings�made�via�the�agency.�So�this�source�misses�most�of�the�on-trip�expenses�such�as�meal�and�taxi.�
And�even�a�card�cannot�offer�everything.�The�detail�provided�by�individual�plastic�cards�is�often�sparse,�especially�compared�with�central�billing�accounts�(also�known�as�lodge�cards),�and�some�cards�have�better�levels�of�acceptance�than�others.�Also,�many�programs—even�if�they�offer�corporate�cards—cannot�mandate�their�use�and�thus�miss�out�on�important�spend�information.�The�expense�management�system�is�the�source�that�should�have�the�broadest�view�on�travel-related�spend�information,�but�unfortunately�often�does�not�provide�sufficient�detail.
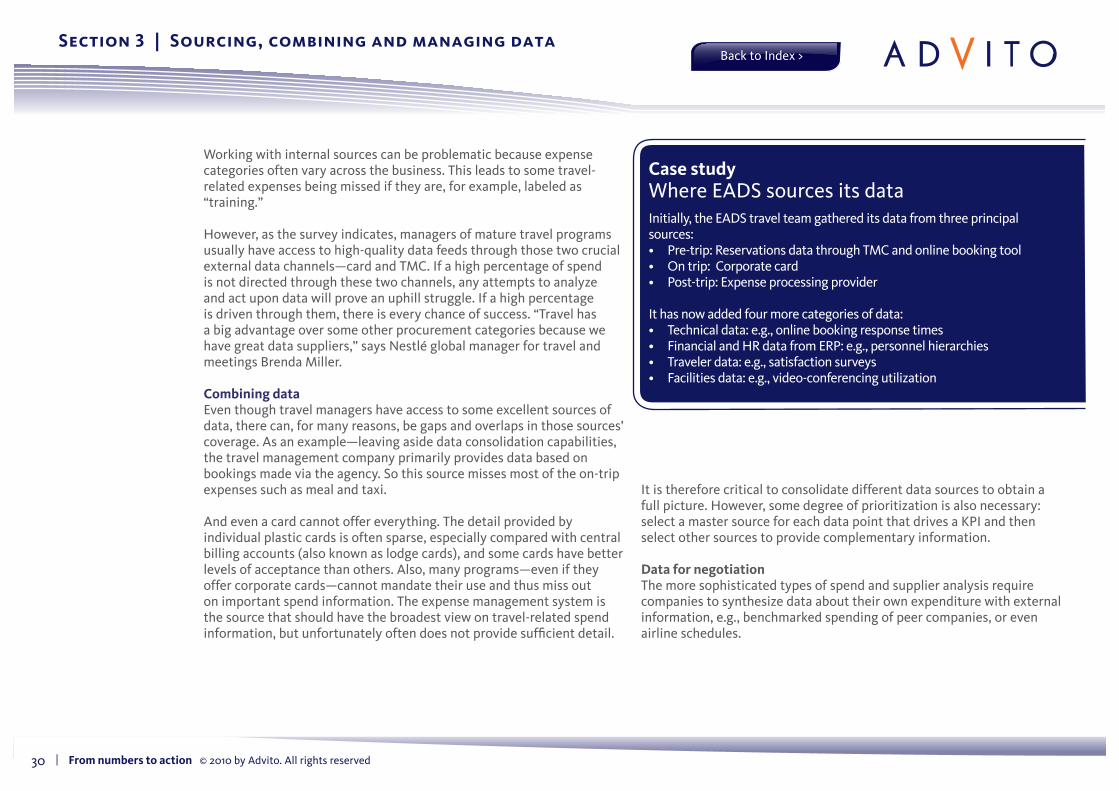
Case study Where�EADS�sources�its�dataInitially,�the�EADS�travel�team�gathered�its�data�from�three�principal�sources:•� Pre-trip:�Reservations�data�through�TMC�and�online�booking�tool•� On�trip:��Corporate�card•� Post-trip:�Expense�processing�provider
It�has�now�added�four�more�categories�of�data:•� Technical�data:�e.g.,�online�booking�response�times•� Financial�and�HR�data�from�ERP:�e.g.,�personnel�hierarchies•� Traveler�data:�e.g.,�satisfaction�surveys•� Facilities�data:�e.g.,�video-conferencing�utilization
It�is�therefore�critical�to�consolidate�different�data�sources�to�obtain�a�full�picture.�However,�some�degree�of�prioritization�is�also�necessary:�select�a�master�source�for�each�data�point�that�drives�a�KPI�and�then�select�other�sources�to�provide�complementary�information.
Data for negotiationThe�more�sophisticated�types�of�spend�and�supplier�analysis�require�companies�to�synthesize�data�about�their�own�expenditure�with�external�information,�e.g.,�benchmarked�spending�of�peer�companies,�or�even�airline�schedules.
Section 3 | Sourcing, combining and managing data
31 �|����From numbers to action���©�2010�by�Advito.�All�rights�reserved
Back�to�Index�>
Data warehouses – the optionsTravel�buyers�who�use�more�than�one�source�of�data�often�conclude�they�need�a�mechanism�to�combine�them,�usually�in�what�is�called�a�data�warehouse.�“I�can’t�emphasize�how�important�a�data�warehouse�is,”�says�EADS�head�of�extended�travel�enterprise�James�Westgarth.�“There�is�an�initial�investment�to�get�it�up�and�running,�but�once�in�place�it�pays�for�itself�repeatedly.”
There�are�three�basic�options�for�creating�a�data�warehouse:
In-houseThis�could�be�a�stand-alone�data�warehouse�or�it�could�be�one�already�used�for�other�functions�within�the�organization,�such�as�an�ERP�system.�If�that�is�the�case,�then�feeding�links�from�key�travel�providers�can�be�straightforward,�and�the�travel�data�will�be�reported�on�the�company�profit�and�loss�statements�as�a�line�item.�However,�extra�resources�will�be�needed�either�way�to�support�an�internal�solution,�whether�stand-alone�or�as�part�of�a�larger�data�warehouse.�Setting�this�up�could�be�slow�and�costly,�but�one�major�advantage�is�that�the�final�product�is�guaranteed�to�be�compliant�with�internal�processes.
OutsourcedThis�task�can�be�handed�to�an�existing�travel�data�supplier,�such�as�a�TMC�or�card�provider,�or�to�specialist�travel�data�consolidators�such�as�TRX�or�Prism.�One�advantage�of�outsourcing�is�that�third�parties�are�subject�matter�experts�who�are�fast�to�implement�and�are�well�aware�of�the�pitfalls�which�obstruct�the�path�to�accurate,�consolidated�data.�Their�flexibility�and�security�standards�are�of�an�acceptable�standard�for�most�corporations.�However,�beware�of�one�potential�problem,�which�is�the�possible�reluctance�of�other�data�suppliers�to�hand�off�data�to�the�outsourced�provider.
HybridA�hybrid�solution�is�for�a�third�party�to�build�and�host�the�data�warehouse�but�to�manipulate�and�control�it�in-house.�This�can�be�done�through�a�software-as-a-service�license.�It�works�particularly�well�if�the�travel�team�includes�a�dedicated�data�analyst.
Yet�another�option�is�to�create�a�hybrid�the�other�way�round,�an�option�favored�by�EADS.�“The�best�answer�for�us�is�to�have�the�data�warehouse�created�internally�but�managed�externally,”�says�Westgarth.�“I�am�very�interested�in�outsourcing�our�data�management�because�it�is�not�a�core�competence.�However,�not�only�does�the�outsourced�party�need�good�technical�skills,�but�it�needs�functional�skills�to�deliver�the�right�reports�on�time.”
Analyzing dataAdded�to�the�question�of�outsourcing�data�management�is�the�question�of�whether�a�travel�team�has�enough�expertise�in-house�to�analyze�its�data.�Some�of�the�most�detailed�analyses,�such�as�for�airline�contracting,�require�powerful�analytical�engines�and�scenario�modeling.�Many�buyers�conclude�they�cannot�perform�such�tasks�alone�and�turn�to�a�consultancy�which�can�integrate�flight�schedule�data,�discount�data,�market�forecast�and�airline�cost�data,�and�then�create�an�algorithm�to�provide�a�range�of�negotiating�options.
Section 3 | Sourcing, combining and managing data
32 �|����From numbers to action���©�2010�by�Advito.�All�rights�reserved
Back�to�Index�>
As the section on measuring savings demonstrated, measurements cannot be looked at in isolation. They need context, such as historical comparisons and market perspectives. In addition, companies often find it useful to compare performance between business units internally, and they also like to make comparisons externally with peer companies. Comparisons of this nature—especially externally—are known as benchmarking.
There�are�numerous�ways�in�which�companies�can�benchmark�against�each�other,�including�comparing�strategies,�processes�and�performance.�At�its�most�basic,�benchmarking�is�a�four-step�procedure:
1.� Map�out�your�own�existing�business�practice.2.� �Analyze�the�business�practice�of�peer�companies�(similar�industry�
sector,�similar�size,�similar�spend,�similar�policy,�similar�geographic�spread,�etc.).�Be�aware�that�the�definition�of�peer�may�change�according�to�the�practice�you�want�to�benchmark.
3.� �Compare�your�own�business�performance�against�the�analysis�of�the�peer�companies.
4.� �Initiate�actions�to�close�the�gaps�where�you�identify�your�performance�lags�behind�your�peers.
Benchmarking�travel�programs�between�different�corporations�has�a�long�and�complicated�history.�While�formal�and�informal�sharing�of�best�practice�for�process�is�widely�recognized�as�extremely�valuable,�feelings�are�more�mixed�about�data.�With�so�many�variables,�can�comparisons�ever�be�meaningful?�
The�skepticism�could�arguably�be�even�greater�for�benchmarking�of�strategic�KPIs.�This�creates�a�double�barrier�of�potential�incompatibility:�different�strategic�aims�and�different�travel�program�configurations.�On�the�other�hand,�some�of�the�strategic�KPIs�may�provide�a�basis�for�helping�you�select�the�right�peer�group�and�make�benchmarking�more�meaningful.
Advito�believes�benchmarking�strategic�KPIs�would�be�extremely�beneficial�for�companies�with�mature�travel�programs.�Of�course�each�company�has�a�different�structure�and�strategic�priorities.�However,�the�purpose�of�strategic�KPIs�is�not�to�produce�absolute�figures�but�an�index�or�a�range�against�which�to�make�comparisons.�This�is�not�just�true�for�companies�comparing�themselves�with�other�companies,�but�also�within�organizations—business�unit�against�business�unit,�for�example.
Turning a vicious circle in a virtuous oneOne�reason�companies�have�not�benchmarked�strategic�KPIs�is�that�there�are�still�not�many�which�track�them.�But�this�is�a�vicious�circle:�one�reason�not�many�companies�have�started�producing�strategic�KPIs�is�that�they�have�few�role�models�to�copy.
We�hope�this�white�paper�will�act�as�a�catalyst�to�convert�that�vicious�circle�into�a�virtuous�one.�Ideally,�it�will�encourage�more�companies�to�create�strategic�KPIs�and�they�will�prove�the�role�model�for�still�more�to�join�in�with�them.
There�are�no�hard�and�fast�rules�here,�but�the�starting�point�could�be�some�of�the�strategic�KPIs�outlined�in�Section�1,�namely:
•� Travel�management�services�coverage•� Virtual�meeting�index•� Value�of�managed�travel•� Travel�expense�productivity�•� Travel�intensity•� Policy�compliance�•� Change�in�total�travel�cost�•� Climate�impact�of�business�travel�transport�reduction•� Share�of�corporate�credit�card�volume•� Travel�agency�performance�index
(See�page�4�for�a�definition�of�each�of�these�strategic�KPIs.)
final word | the role of benchmarking in strategic performance management
33 �|����From numbers to action���©�2010�by�Advito.�All�rights�reserved
Back�to�Index�>
ConclusionBenchmarking�is�perhaps�the�last�link�in�a�chain�which�runs�throughout�this�white�paper.�It�adds�yet�another�layer�of�context�to�data�and�reminds�us�that�good�data�is�all�about�achieving�deeper,�actionable�insight�into�how�a�company�is�run.�
Strategic�travel�KPIs�are�important�for�precisely�this�reason.�Travel�does�not�exist�in�its�own�bubble.�It�is�a�vital�function�which�ensures�a�company�constantly�renews�itself,�whether�in�terms�of�seeking�new�markets�and�customers�or�developing�new�products.�At�the�same�time,�the�costs�generated�by�travel�affect�profitability�significantly�and�therefore�it�is�important�to�find�accurate�ways�of�measuring�those�costs�and�monitor�how�successfully�they�are�being�contained.
The�prioritization�of�cost�containment�which�characterizes�corporations�in�developed�markets�means�savings�KPIs�are�perhaps�the�front�line�of�strategic�travel�KPIs.�However,�they�are�not�the�only�important�strategic�financial�indicator.�The�travel�expense�productivity�KPI,�for�example,�can�gauge�whether�the�level�of�travel�expenditure�is�appropriate�for�a�company’s�revenues.
Wider�still,�no�company�can�measure�it�progress�purely�in�financial�terms.�Issues�like�sustainability�and�duty�of�care�are�also�at�the�forefront�of�boardroom�agendas,�as�is�compliance.�Each�of�these�issues�affects�travel�and�there�are�strategic�KPIs�to�measure�all�of�them.
It�is�worth�repeating�the�cautionary�note�that�effective�performance�management�requires�a�high�degree�of�stakeholder�participation�during�the�design�phase.�It�also�needs�to�be�fully�aligned�with�the�performance�management�framework�and�terminology�used�in�the�corporation�and�link�directly�to�the�company’s�specific�goal�prioritization.�As�such�this�whitepaper�can�provide�a�framework�and�some�food�for�thought�but�should�not�be�seen�as�a�blueprint�that�can�be�applied�identically�for�every�organization.
That�said,�Advito�firmly�believes�that�strategic�travel�KPIs�are�the�glue�which�join�a�travel�program�to�the�core�functions�of�the�company�that�the�program�serves.�They�ensure�the�program�remains�relevant�and�appreciated�by�senior�management.�They�also�provide�a�permanently�evolving�agenda�for�action,�allowing�travel�managers�to�maintain�optimum�performance�management�of�their�travel�programs.��AcknowledgementsAdvito�would�like�to�thank�the�following�for�the�significant�contributions�they�made�to�this�white�paper:
Scott�Gillespie;�Brenda�Miller,�Nestlé;�James�Westgarth,�EADS;�Association of Corporate Travel Executives
final word | the role of benchmarking in strategic performance management
Costs generated by travel affect profitability significantly and therefore it is important to find accurate ways of measuring those costs and monitor how successfully they are being contained
34 �|����From numbers to action���©�2010�by�Advito.�All�rights�reserved
Back�to�Index�>
About Advito Advito provides travel-management advisory, procurement and outsourcing services that guide clients through a complex travel environment. Advito’s focus on consulting delivers proven value, unbiased counsel and a customized approach for every client and every engagement, together with industry expertise and access to data to drive quantifiable decision-making. Advito is headquartered in Atlanta and London and operates in key business markets around the world. Advito is an independent operating unit of BCD Travel, the world’s third-largest travel-management company, owned by BCD Holdings N.V. About BCD Holdings N.V. BCD Holdings N.V., a Dutch family-owned company founded in 1975 by John Fentener van Vlissingen, is a market leader in the travel industry. The BCD Holdings companies are BCD Travel (global corporate travel management), Park ‘N Fly (off-airport parking), TRX (travel transaction processing and data integration), Airtrade (consolidating and online travel), VakantieXperts (leisure), Vayama (online travel USA) and Parkmobile International (mobile parking and traffic applications). BCD Holdings employs approximately 13,000 people and operates in more than 90 countries with total sales, including franchising, of U.S.$ 14.8 billion. For more information, visit: www.bcd-nv.com.
For more information please contact
Six Concourse Parkway NE,Suite 2400,Atlanta, GA 30328