
Friction force microscopy as an alternative method to probe molecular interactions
8
Friction force microscopy as an alternative method to probe molecular interactions Małgorzata Lekka, Andrzej J. Kulik, Sylvia Jeney, Joanna Raczkowska, Janusz Lekki, Andrzej Budkowski, and László Forró Citation: The Journal of Chemical Physics 123, 014702 (2005); doi: 10.1063/1.1949187 View online: http://dx.doi.org/10.1063/1.1949187 View Table of Contents: http://scitation.aip.org/content/aip/journal/jcp/123/1?ver=pdfcov Published by the AIP Publishing Articles you may be interested in Efficient implementation of the three-dimensional reference interaction site model method in the fragment molecular orbital method J. Chem. Phys. 140, 214118 (2014); 10.1063/1.4879795 Dynamics simulations for engineering macromolecular interactions Chaos 23, 025110 (2013); 10.1063/1.4810915 Structure prediction of an S-layer protein by the mean force method J. Chem. Phys. 128, 065106 (2008); 10.1063/1.2826375 The importance of vibronic perturbations in ferrocytochrome c spectra: A reevaluation of spectral properties based on low-temperature optical absorption, resonance Raman, and molecular-dynamics simulations J. Chem. Phys. 123, 054508 (2005); 10.1063/1.1961556 Theoretical study of intramolecular interaction energies during dynamics simulations of oligopeptides by the fragment molecular orbital-Hamiltonian algorithm method J. Chem. Phys. 122, 094905 (2005); 10.1063/1.1857481 This article is copyrighted as indicated in the article. Reuse of AIP content is subject to the terms at: http://scitation.aip.org/termsconditions. Downloaded to IP: 132.174.255.116 On: Thu, 18 Dec 2014 16:35:51
Transcript of Friction force microscopy as an alternative method to probe molecular interactions

Friction force microscopy as an alternative method to probe molecular interactionsMałgorzata Lekka, Andrzej J. Kulik, Sylvia Jeney, Joanna Raczkowska, Janusz Lekki, Andrzej Budkowski, andLászló Forró Citation: The Journal of Chemical Physics 123, 014702 (2005); doi: 10.1063/1.1949187 View online: http://dx.doi.org/10.1063/1.1949187 View Table of Contents: http://scitation.aip.org/content/aip/journal/jcp/123/1?ver=pdfcov Published by the AIP Publishing Articles you may be interested in Efficient implementation of the three-dimensional reference interaction site model method in the fragmentmolecular orbital method J. Chem. Phys. 140, 214118 (2014); 10.1063/1.4879795 Dynamics simulations for engineering macromolecular interactions Chaos 23, 025110 (2013); 10.1063/1.4810915 Structure prediction of an S-layer protein by the mean force method J. Chem. Phys. 128, 065106 (2008); 10.1063/1.2826375 The importance of vibronic perturbations in ferrocytochrome c spectra: A reevaluation of spectral propertiesbased on low-temperature optical absorption, resonance Raman, and molecular-dynamics simulations J. Chem. Phys. 123, 054508 (2005); 10.1063/1.1961556 Theoretical study of intramolecular interaction energies during dynamics simulations of oligopeptides by thefragment molecular orbital-Hamiltonian algorithm method J. Chem. Phys. 122, 094905 (2005); 10.1063/1.1857481
This article is copyrighted as indicated in the article. Reuse of AIP content is subject to the terms at: http://scitation.aip.org/termsconditions. Downloaded to IP:
132.174.255.116 On: Thu, 18 Dec 2014 16:35:51
Friction force microscopy as an alternative method to probemolecular interactions
Małgorzata Lekkaa�
The Henryk Niewodniczański Institute of Nuclear Physics, Polish Academy of Sciences, Radzikowskiego152, 31-342 Kraków, Poland and Institute of Physics of Complex Matter, Ecole Polytechnique Fédérale deLausanne, CH-1015 Lausanne, Switzerland
Andrzej J. Kulik and Sylvia JeneyInstitute of Physics of Complex Matter, Ecole Polytechnique Fédérale de Lausanne, CH-1015 Lausanne,Switzerland
Joanna RaczkowskaInstitute of Physics, Jagiellonian University, Reymonta 4, 30-059 Kraków, Poland
Janusz LekkiThe Henryk Niewodniczański Institute of Nuclear Physics, Polish Academy of Sciences,Radzikowskiego 152, 31-342 Kraków, Poland
Andrzej BudkowskiInstitute of Physics, Jagiellonian University, Reymonta 4, 30-059 Kraków, Poland
László ForróInstitute of Physics of Complex Matter, Ecole Polytechnique Fédérale de Lausanne, CH-1015 Lausanne,Switzerland
�Received 12 January 2005; accepted 16 May 2005; published online 12 July 2005�
Friction force microscopy was applied to study protein–carbohydrate interactions that are importantin many cellular recognition processes. The expression and structure of carbohydrates can beinvestigated using lectins as molecular probes since they recognize different types of sugarmolecules. Lectins �concanavalin A and lentil lectin, recognizing mannose-type carbohydrates� wereattached to the probing tip and carboxypeptidase Y �possessing complementary carbohydrates� wasimmobilized on a modified glass surface using microcontact printing. The results obtained fromfriction force maps and dependencies on the loading rate �measured in a physiological buffer� weredivided in two distinct groups. The first group of results obtained for lectin–protein complexes wasassigned to molecular recognition events, whereas the other including all control measurements wasattributed to nonspecific interaction. All results presented here indicate that friction forcemicroscopy can be successfully employed to study recognition processes. © 2005 AmericanInstitute of Physics. �DOI: 10.1063/1.1949187�
I. INTRODUCTION
Many methods have been used to investigate unbindingprocesses between two molecules, especially those inducedby the action of an external force causing bond breaking.These methods encompass, for example, a biomembraneforce probe with pipette suction,1 hydrodynamic-flow-basedmethods,2 laser tweezers,3 and also atomic force microscopy�AFM�.4 During the last years, the latter method has becomean indispensable tool applied in many scientific areas such asbiology, material science, etc. The power of AFM lies notonly in a high-quality imaging of the surface topographiesbut also in its ability to measure sample properties such asadhesion or elasticity by the detection of forces acting per-pendicular to the investigated A surface.5 The functionaliza-tion of the AFM probes significantly enhances the micro-scope’s applicability since the molecular interactions can be
studied with chemical sensitivity.6 AFM offers a convenientway to measure forces involved in specific interactions bydetection of unbinding events between the AFM tip function-alized with one type of molecules probing its complementarypartner immobilized on the substrate.7 The unbinding force,determined from the force required to separate the tip fromthe substrate, has been measured for single molecular com-plexes, e.g., avidin–biotin,8 human serum albumin �HSA�,and a polyclonal anti-HSA antibody,9 or even betweencomplementary strands of DNA oligomers.10 Such studiesrequire a huge number of force curves to be recorded, mak-ing the measurement and the analysis very time consuming.The method of analysis proposed by Lo et al.11 using Poissonstatistics diminishes the number of curves, but still a largeamount of data sets are needed to be measured and analyzed.Additionally to the obtained strength of molecular interac-tion, the AFM offers deeper insight into the unbinding pro-cess �i.e., bond dissociation� by recording the unbindingforce as a function of the loading rate. Such measurementsa�Electronic mail: [email protected]
THE JOURNAL OF CHEMICAL PHYSICS 123, 014702 �2005�
0021-9606/2005/123�1�/014702/7/$22.50 © 2005 American Institute of Physics123, 014702-1
This article is copyrighted as indicated in the article. Reuse of AIP content is subject to the terms at: http://scitation.aip.org/termsconditions. Downloaded to IP:
132.174.255.116 On: Thu, 18 Dec 2014 16:35:51
were performed for several molecular complexes such asbiotin–streptavidin,12 fibronectin–integrin,13 lectins,14 orcadherins.15
Bond formation and dissociation between moleculesfreely dissolved in solution was described in the frame ofKramer’s rate theory,16 where a binding affinity is describedby rates of bond association and/or bond dissociation. How-ever, a majority of molecules involved in cellular interactionsare not free but immobilized in the cell membrane and thedissociation process depends on external forces causing theirunbinding,17 modifying their binding affinity. The first de-scription of the molecular complex unbinding due to the ac-tion of an external force stated that the force applied to abond determines the lifetime of the bond.18 Later on, Evansand Ritchie19 showed that the unbinding force F* observed ineach particular experiment is a function of the applied load-ing rate. For all molecular complexes investigated so far, thedependence between the unbinding force and the logarithmof the loading rate ln�r� is linear. According to the transitionstate theory, the dissociation of the ligand–receptor complexcan proceed via an intermediate state which is related to thepresence of two �or more� linear regions in the above-mentioned dependence.
Carbohydrate ligands are important mediators of biomo-lecular recognition since they are often an integral part offunctional membrane proteins. Interactions between carbo-hydrate chains located on the outer part of cell membranesand receptor proteins are involved in cell adhesion phenom-ena present in cell signaling, organogenesis, fertilization, andinflammation. Additionally, changes in the cell carbohydrateexpression facilitate the initial attachment of pathogens tohost cells, the metastasis, and the growth of malignant cancercells.20 Carbohydrates are commonly detected with the useof lectins, i.e., proteins possessing the selective affinity todifferent types of carbohydrate structures.
The carbohydrate–protein interaction was studied bymonitoring the forces using AFM. The friction force can bedelivered from the lateral forces measured by the detectionof the torsional bending of the cantilever on which the tip ismounted. Such AFM mode of operation is called frictionforce microscopy �FFM�. Using FFM, many aspects of fric-tion phenomena on the atomic scale were investigated so far,for example, the stick-slip behavior when the moving tiphops over atoms.21 The velocity dependence of friction onatomic scales was also observed for the AFM tip sliding on aNaCl �100� surface where the friction force was dependenton the logarithm of the scanning velocity. Other surfacestudies22 showed the friction dependence on wettability. Hy-drophilic surfaces showed a logarithmic decrease of the fric-tion with increasing velocity, whereas on hydrophobic sur-faces the logarithmic increase was reported.
The idea of the present paper was to show that frictionforce microscopy can be applied to study molecular recogni-tion processes by analyzing friction force images and rela-tionships between the friction and the lateral loading rate.Measurements were carried out for two lectins: concanavalinA �from Canavalia ensiformis� and lentil lectin �from Lensculinaris agglutinin�, having the same type of specificity tomannose and glucose sugars. As a complementary glycopro-
tein �i.e., a protein with a covalently attached carbohydratechain�, carboxypeptidase Y was chosen, since its carbohy-drate moiety is mainly composed of mannose.23 Frictionforce maps and dependencies on the lateral loading rate wereinvestigated by recording lateral force images in two oppo-site directions. The obtained results demonstrated the pos-sible applicability of friction measurements in the investiga-tions of the protein–carbohydrate interaction.
II. MATERIALS AND METHODS
A. Proteins
Carboxypeptidase Y �CaY� and two lectins, concanava-lin A �ConA� from Canavalia ensiformis, agglutinin �LcH�from Lens culinaris, were purchased from ICN Biomedicals.Bovine serum albumin �BSA, Sigma� was chosen as refer-ence proteins, as no recognition events were expected sincealbumin does not bear carbohydrate component. Protein so-lutions were prepared using a 10-mM phosphate-buffered sa-line �PBS, Sigma� containing 137-mM NaCl, 2.7-mM KCl �pH of 7.4�. The final concentration of all used proteins was0.1 mg/ml.
B. Cantilever and sample preparation
Cantilever functionalization with proteins �ConA, LcH,and CaY� was performed following the protocol described inLekka et al.24 Briefly, silicon nitride cantilevers were si-lanized �using 3-aminopropyltriethoxysilane, APTES,Sigma� and subsequently immersed in a 2.5% glutaraldehyde�Sigma� aqueous solution for 30 min. Afterwards, they werewashed with PBS and incubated with the lectin solution�0.1 mg/ml� for 1 h. Next, cantilevers were washed again inPBS buffer and used for AFM measurements. The proteinsCaY and BSA were immobilized on a glass coverslip surfacepreviously activated with glutaraldehyde, using the aboveprotocol. A polydimethylsiloxane �PDMS� stamp25 contain-ing a pattern of periodically arranged holes, with a diameterof 5 �m and a depth of 1.5 �m, was used to deposit proteinsto the surface. The stamp was inked in PBS solution contain-ing either CaY or BSA �0.1 mg/ml� for 30 min. Next, theexcess solution was removed and the PDMS stamp wasbrought into contact with the modified substrate for 15 min.Afterwards, the substrate was washed with PBS, the possibleactive aldehyde groups were blocked with glycine �4% inPBS for 15 min�, and the sample was directly measured. Itwas reported elsewhere26 that such way of protein immobi-lization does not influence significantly the protein’s biologi-cal activity.
C. AFM measurements
AFM measurements were carried out in Tris bufferedsaline �TBS=50-mM Tris-HCl+150-mM NaCl, pH=7.4�supplemented with Ca++ and Mn++ ions �1 mM each� en-suring the lectin binding activity. All measurements wereperformed at room temperature using an AFM equipped witha “liquid cell” setup �model M5, Park Scientific�. Commer-cially available silicon nitride cantilevers with a resonancefrequency around 7 kHz were used. This value was moni-
014702-2 Lekka et al. J. Chem. Phys. 123, 014702 �2005�
This article is copyrighted as indicated in the article. Reuse of AIP content is subject to the terms at: http://scitation.aip.org/termsconditions. Downloaded to IP:
132.174.255.116 On: Thu, 18 Dec 2014 16:35:51
tored using thermal excitation and only cantilevers with asimilar resonant frequency were chosen for measurements.The lateral spring constant was determined using geometricalparameters27 and its value was calculated to be 59.6 N/m
�Table I�. The photodetector sensitivity was determined fromthe slope of the force versus distance curve recorded on ahard substrate. Both values were used for the calibration offriction force.28,29 During measurement, the lateral force wasrecorded over a scan area of 20�20 �m2 under a constantloading force of about 2 nN. The friction force is the lateralcomponent of the total force acting on the moving tip and itsvalue can be determined by subtracting means �i.e., averagevalues from a given region of the protein-covered surface�obtained from scans performed in two opposite directions�forward and backward scans� along the same path.21,22
III. RESULTS
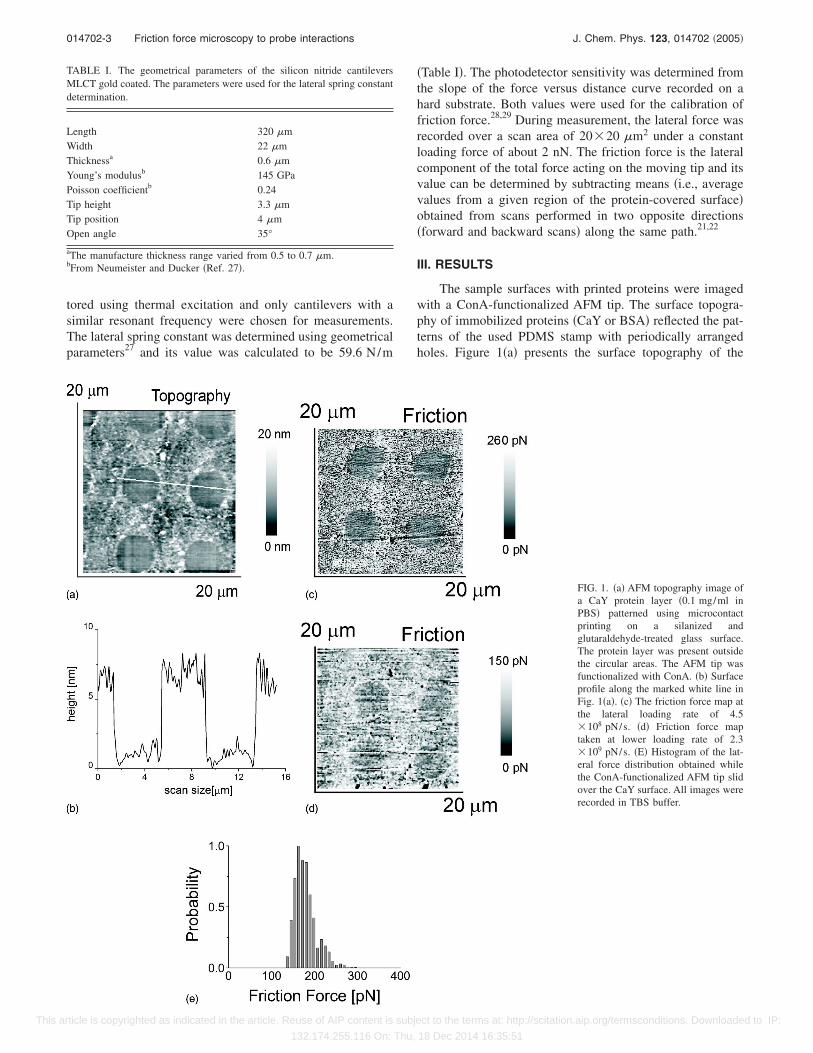
The sample surfaces with printed proteins were imagedwith a ConA-functionalized AFM tip. The surface topogra-phy of immobilized proteins �CaY or BSA� reflected the pat-terns of the used PDMS stamp with periodically arrangedholes. Figure 1�a� presents the surface topography of the
TABLE I. The geometrical parameters of the silicon nitride cantileversMLCT gold coated. The parameters were used for the lateral spring constantdetermination.
Length 320 �mWidth 22 �mThicknessa 0.6 �mYoung’s modulusb 145 GPaPoisson coefficientb 0.24Tip height 3.3 �mTip position 4 �mOpen angle 35°
aThe manufacture thickness range varied from 0.5 to 0.7 �m.bFrom Neumeister and Ducker �Ref. 27�.
FIG. 1. �a� AFM topography image ofa CaY protein layer �0.1 mg/ml inPBS� patterned using microcontactprinting on a silanized andglutaraldehyde-treated glass surface.The protein layer was present outsidethe circular areas. The AFM tip wasfunctionalized with ConA. �b� Surfaceprofile along the marked white line inFig. 1�a�. �c� The friction force map atthe lateral loading rate of 4.5�108 pN/s. �d� Friction force maptaken at lower loading rate of 2.3�109 pN/s. �E� Histogram of the lat-eral force distribution obtained whilethe ConA-functionalized AFM tip slidover the CaY surface. All images wererecorded in TBS buffer.
014702-3 Friction force microscopy to probe interactions J. Chem. Phys. 123, 014702 �2005�
This article is copyrighted as indicated in the article. Reuse of AIP content is subject to the terms at: http://scitation.aip.org/termsconditions. Downloaded to IP:
132.174.255.116 On: Thu, 18 Dec 2014 16:35:51
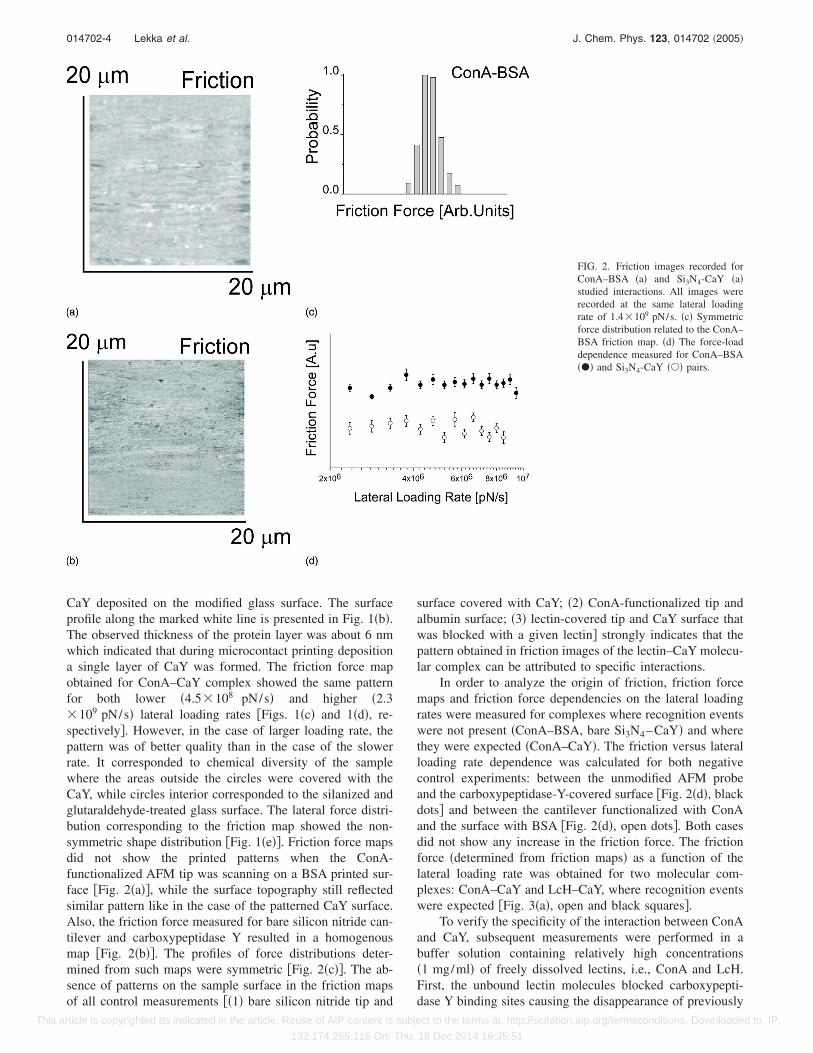
CaY deposited on the modified glass surface. The surfaceprofile along the marked white line is presented in Fig. 1�b�.The observed thickness of the protein layer was about 6 nmwhich indicated that during microcontact printing depositiona single layer of CaY was formed. The friction force mapobtained for ConA–CaY complex showed the same patternfor both lower �4.5�108 pN/s� and higher �2.3�109 pN/s� lateral loading rates �Figs. 1�c� and 1�d�, re-spectively�. However, in the case of larger loading rate, thepattern was of better quality than in the case of the slowerrate. It corresponded to chemical diversity of the samplewhere the areas outside the circles were covered with theCaY, while circles interior corresponded to the silanized andglutaraldehyde-treated glass surface. The lateral force distri-bution corresponding to the friction map showed the non-symmetric shape distribution �Fig. 1�e��. Friction force mapsdid not show the printed patterns when the ConA-functionalized AFM tip was scanning on a BSA printed sur-face �Fig. 2�a��, while the surface topography still reflectedsimilar pattern like in the case of the patterned CaY surface.Also, the friction force measured for bare silicon nitride can-tilever and carboxypeptidase Y resulted in a homogenousmap �Fig. 2�b��. The profiles of force distributions deter-mined from such maps were symmetric �Fig. 2�c��. The ab-sence of patterns on the sample surface in the friction mapsof all control measurements ��1� bare silicon nitride tip and
surface covered with CaY; �2� ConA-functionalized tip andalbumin surface; �3� lectin-covered tip and CaY surface thatwas blocked with a given lectin� strongly indicates that thepattern obtained in friction images of the lectin–CaY molecu-lar complex can be attributed to specific interactions.
In order to analyze the origin of friction, friction forcemaps and friction force dependencies on the lateral loadingrates were measured for complexes where recognition eventswere not present �ConA–BSA, bare Si3N4–CaY� and wherethey were expected �ConA–CaY�. The friction versus lateralloading rate dependence was calculated for both negativecontrol experiments: between the unmodified AFM probeand the carboxypeptidase-Y-covered surface �Fig. 2�d�, blackdots� and between the cantilever functionalized with ConAand the surface with BSA �Fig. 2�d�, open dots�. Both casesdid not show any increase in the friction force. The frictionforce �determined from friction maps� as a function of thelateral loading rate was obtained for two molecular com-plexes: ConA–CaY and LcH–CaY, where recognition eventswere expected �Fig. 3�a�, open and black squares�.
To verify the specificity of the interaction between ConAand CaY, subsequent measurements were performed in abuffer solution containing relatively high concentrations�1 mg/ml� of freely dissolved lectins, i.e., ConA and LcH.First, the unbound lectin molecules blocked carboxypepti-dase Y binding sites causing the disappearance of previously
FIG. 2. Friction images recorded forConA–BSA �a� and Si3N4-CaY �a�studied interactions. All images wererecorded at the same lateral loadingrate of 1.4�109 pN/s. �c� Symmetricforce distribution related to the ConA–BSA friction map. �d� The force-loaddependence measured for ConA–BSA��� and Si3N4-CaY ��� pairs.
014702-4 Lekka et al. J. Chem. Phys. 123, 014702 �2005�
This article is copyrighted as indicated in the article. Reuse of AIP content is subject to the terms at: http://scitation.aip.org/termsconditions. Downloaded to IP:
132.174.255.116 On: Thu, 18 Dec 2014 16:35:51
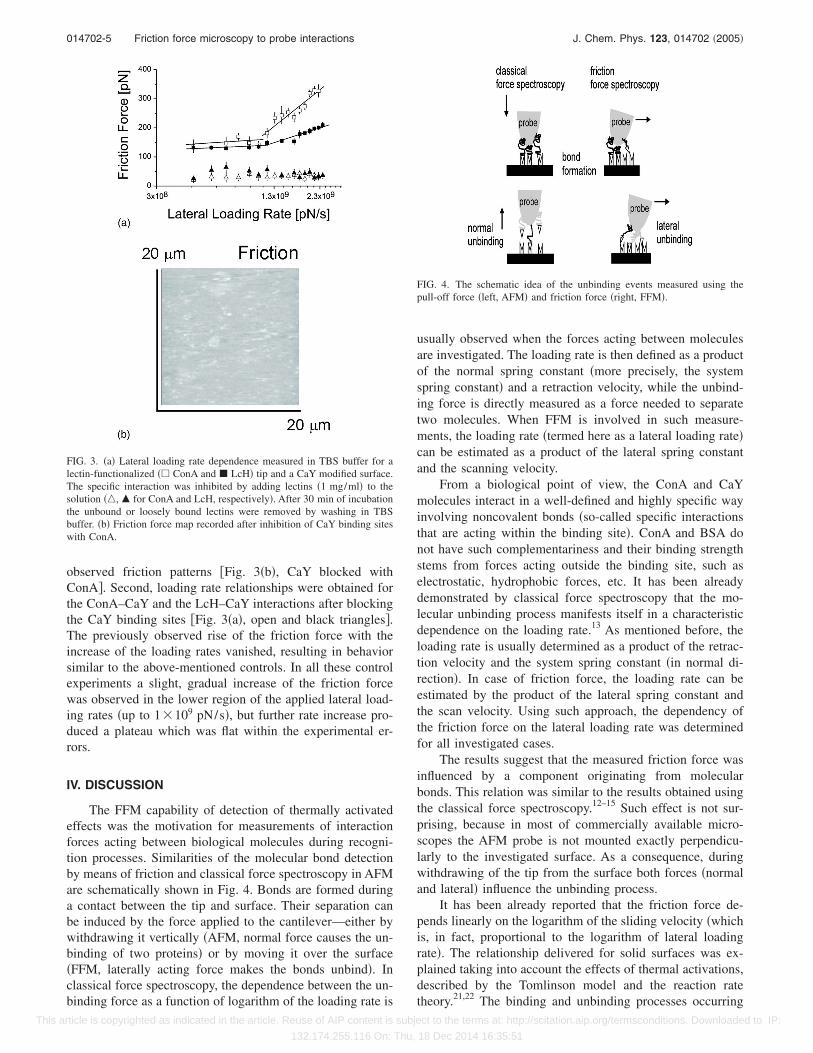
observed friction patterns �Fig. 3�b�, CaY blocked withConA�. Second, loading rate relationships were obtained forthe ConA–CaY and the LcH–CaY interactions after blockingthe CaY binding sites �Fig. 3�a�, open and black triangles�.The previously observed rise of the friction force with theincrease of the loading rates vanished, resulting in behaviorsimilar to the above-mentioned controls. In all these controlexperiments a slight, gradual increase of the friction forcewas observed in the lower region of the applied lateral load-ing rates �up to 1�109 pN/s�, but further rate increase pro-duced a plateau which was flat within the experimental er-rors.
IV. DISCUSSION
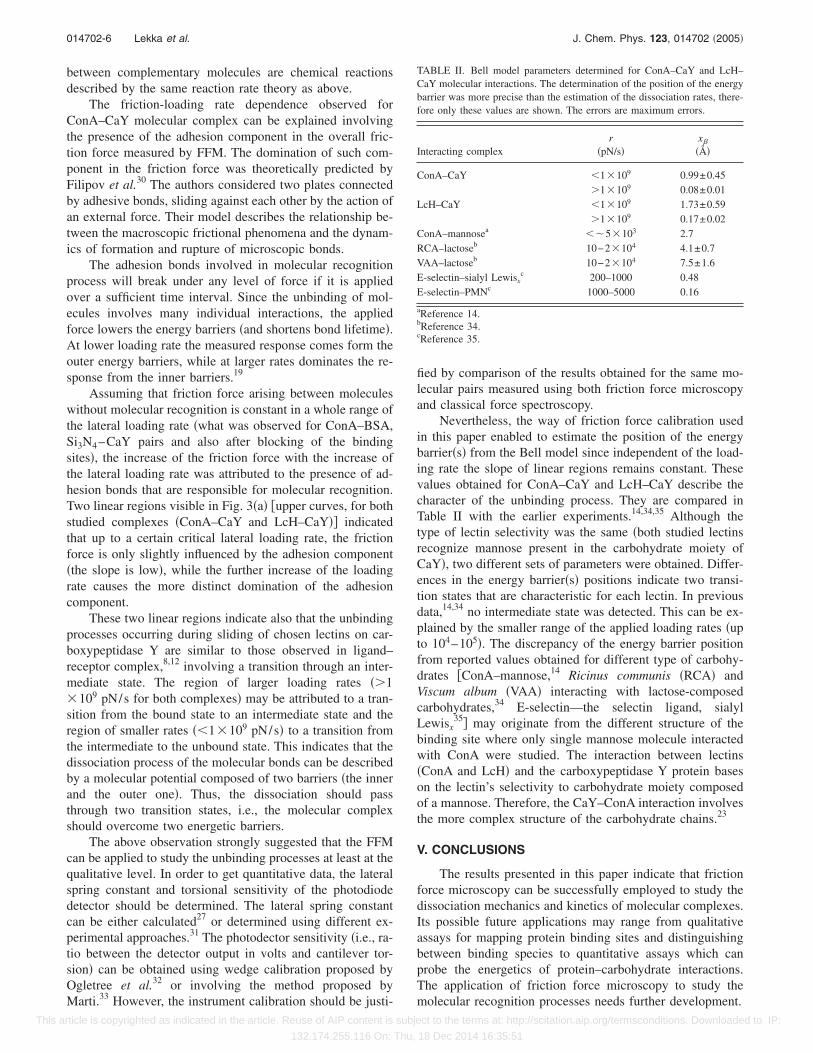
The FFM capability of detection of thermally activatedeffects was the motivation for measurements of interactionforces acting between biological molecules during recogni-tion processes. Similarities of the molecular bond detectionby means of friction and classical force spectroscopy in AFMare schematically shown in Fig. 4. Bonds are formed duringa contact between the tip and surface. Their separation canbe induced by the force applied to the cantilever—either bywithdrawing it vertically �AFM, normal force causes the un-binding of two proteins� or by moving it over the surface�FFM, laterally acting force makes the bonds unbind�. Inclassical force spectroscopy, the dependence between the un-binding force as a function of logarithm of the loading rate is
usually observed when the forces acting between moleculesare investigated. The loading rate is then defined as a productof the normal spring constant �more precisely, the systemspring constant� and a retraction velocity, while the unbind-ing force is directly measured as a force needed to separatetwo molecules. When FFM is involved in such measure-ments, the loading rate �termed here as a lateral loading rate�can be estimated as a product of the lateral spring constantand the scanning velocity.
From a biological point of view, the ConA and CaYmolecules interact in a well-defined and highly specific wayinvolving noncovalent bonds �so-called specific interactionsthat are acting within the binding site�. ConA and BSA donot have such complementariness and their binding strengthstems from forces acting outside the binding site, such aselectrostatic, hydrophobic forces, etc. It has been alreadydemonstrated by classical force spectroscopy that the mo-lecular unbinding process manifests itself in a characteristicdependence on the loading rate.13 As mentioned before, theloading rate is usually determined as a product of the retrac-tion velocity and the system spring constant �in normal di-rection�. In case of friction force, the loading rate can beestimated by the product of the lateral spring constant andthe scan velocity. Using such approach, the dependency ofthe friction force on the lateral loading rate was determinedfor all investigated cases.
The results suggest that the measured friction force wasinfluenced by a component originating from molecularbonds. This relation was similar to the results obtained usingthe classical force spectroscopy.12–15 Such effect is not sur-prising, because in most of commercially available micro-scopes the AFM probe is not mounted exactly perpendicu-larly to the investigated surface. As a consequence, duringwithdrawing of the tip from the surface both forces �normaland lateral� influence the unbinding process.
It has been already reported that the friction force de-pends linearly on the logarithm of the sliding velocity �whichis, in fact, proportional to the logarithm of lateral loadingrate�. The relationship delivered for solid surfaces was ex-plained taking into account the effects of thermal activations,described by the Tomlinson model and the reaction ratetheory.21,22 The binding and unbinding processes occurring
FIG. 3. �a� Lateral loading rate dependence measured in TBS buffer for alectin-functionalized �� ConA and � LcH� tip and a CaY modified surface.The specific interaction was inhibited by adding lectins �1 mg/ml� to thesolution ��, � for ConA and LcH, respectively�. After 30 min of incubationthe unbound or loosely bound lectins were removed by washing in TBSbuffer. �b� Friction force map recorded after inhibition of CaY binding siteswith ConA.
FIG. 4. The schematic idea of the unbinding events measured using thepull-off force �left, AFM� and friction force �right, FFM�.
014702-5 Friction force microscopy to probe interactions J. Chem. Phys. 123, 014702 �2005�
This article is copyrighted as indicated in the article. Reuse of AIP content is subject to the terms at: http://scitation.aip.org/termsconditions. Downloaded to IP:
132.174.255.116 On: Thu, 18 Dec 2014 16:35:51
between complementary molecules are chemical reactionsdescribed by the same reaction rate theory as above.
The friction-loading rate dependence observed forConA–CaY molecular complex can be explained involvingthe presence of the adhesion component in the overall fric-tion force measured by FFM. The domination of such com-ponent in the friction force was theoretically predicted byFilipov et al.30 The authors considered two plates connectedby adhesive bonds, sliding against each other by the action ofan external force. Their model describes the relationship be-tween the macroscopic frictional phenomena and the dynam-ics of formation and rupture of microscopic bonds.
The adhesion bonds involved in molecular recognitionprocess will break under any level of force if it is appliedover a sufficient time interval. Since the unbinding of mol-ecules involves many individual interactions, the appliedforce lowers the energy barriers �and shortens bond lifetime�.At lower loading rate the measured response comes form theouter energy barriers, while at larger rates dominates the re-sponse from the inner barriers.19
Assuming that friction force arising between moleculeswithout molecular recognition is constant in a whole range ofthe lateral loading rate �what was observed for ConA–BSA,Si3N4–CaY pairs and also after blocking of the bindingsites�, the increase of the friction force with the increase ofthe lateral loading rate was attributed to the presence of ad-hesion bonds that are responsible for molecular recognition.Two linear regions visible in Fig. 3�a� �upper curves, for bothstudied complexes �ConA–CaY and LcH–CaY�� indicatedthat up to a certain critical lateral loading rate, the frictionforce is only slightly influenced by the adhesion component�the slope is low�, while the further increase of the loadingrate causes the more distinct domination of the adhesioncomponent.
These two linear regions indicate also that the unbindingprocesses occurring during sliding of chosen lectins on car-boxypeptidase Y are similar to those observed in ligand–receptor complex,8,12 involving a transition through an inter-mediate state. The region of larger loading rates ��1�109 pN/s for both complexes� may be attributed to a tran-sition from the bound state to an intermediate state and theregion of smaller rates ��1�109 pN/s� to a transition fromthe intermediate to the unbound state. This indicates that thedissociation process of the molecular bonds can be describedby a molecular potential composed of two barriers �the innerand the outer one�. Thus, the dissociation should passthrough two transition states, i.e., the molecular complexshould overcome two energetic barriers.
The above observation strongly suggested that the FFMcan be applied to study the unbinding processes at least at thequalitative level. In order to get quantitative data, the lateralspring constant and torsional sensitivity of the photodiodedetector should be determined. The lateral spring constantcan be either calculated27 or determined using different ex-perimental approaches.31 The photodector sensitivity �i.e., ra-tio between the detector output in volts and cantilever tor-sion� can be obtained using wedge calibration proposed byOgletree et al.32 or involving the method proposed byMarti.33 However, the instrument calibration should be justi-
fied by comparison of the results obtained for the same mo-lecular pairs measured using both friction force microscopyand classical force spectroscopy.
Nevertheless, the way of friction force calibration usedin this paper enabled to estimate the position of the energybarrier�s� from the Bell model since independent of the load-ing rate the slope of linear regions remains constant. Thesevalues obtained for ConA–CaY and LcH–CaY describe thecharacter of the unbinding process. They are compared inTable II with the earlier experiments.14,34,35 Although thetype of lectin selectivity was the same �both studied lectinsrecognize mannose present in the carbohydrate moiety ofCaY�, two different sets of parameters were obtained. Differ-ences in the energy barrier�s� positions indicate two transi-tion states that are characteristic for each lectin. In previousdata,14,34 no intermediate state was detected. This can be ex-plained by the smaller range of the applied loading rates �upto 104–105�. The discrepancy of the energy barrier positionfrom reported values obtained for different type of carbohy-drates �ConA–mannose,14 Ricinus communis �RCA� andViscum album �VAA� interacting with lactose-composedcarbohydrates,34 E-selectin—the selectin ligand, sialylLewisx
35� may originate from the different structure of thebinding site where only single mannose molecule interactedwith ConA were studied. The interaction between lectins�ConA and LcH� and the carboxypeptidase Y protein baseson the lectin’s selectivity to carbohydrate moiety composedof a mannose. Therefore, the CaY–ConA interaction involvesthe more complex structure of the carbohydrate chains.23
V. CONCLUSIONS
The results presented in this paper indicate that frictionforce microscopy can be successfully employed to study thedissociation mechanics and kinetics of molecular complexes.Its possible future applications may range from qualitativeassays for mapping protein binding sites and distinguishingbetween binding species to quantitative assays which canprobe the energetics of protein–carbohydrate interactions.The application of friction force microscopy to study themolecular recognition processes needs further development.
TABLE II. Bell model parameters determined for ConA–CaY and LcH–CaY molecular interactions. The determination of the position of the energybarrier was more precise than the estimation of the dissociation rates, there-fore only these values are shown. The errors are maximum errors.
Interacting complexr
�pN/s�x�
��
ConA–CaY �1�109 0.99±0.45�1�109 0.08±0.01
LcH–CaY �1�109 1.73±0.59�1�109 0.17±0.02
ConA–mannosea ��5�103 2.7RCA–lactoseb 10−2�104 4.1±0.7VAA–lactoseb 10−2�104 7.5±1.6E-selectin–sialyl Lewisx
c 200–1000 0.48E-selectin–PMNc 1000–5000 0.16
aReference 14.bReference 34.cReference 35.
014702-6 Lekka et al. J. Chem. Phys. 123, 014702 �2005�
This article is copyrighted as indicated in the article. Reuse of AIP content is subject to the terms at: http://scitation.aip.org/termsconditions. Downloaded to IP:
132.174.255.116 On: Thu, 18 Dec 2014 16:35:51
ACKNOWLEDGMENTS
This work was partially supported by the NATO GrantNo. LST.CLG.980477. The research in Lausanne was sup-ported by the NCCR “Nanoscale Science” of the Swiss Na-tional Science Foundation. We thank M. Lieberman forstamp master.
1 R. Merkel, P. Nassoy, A. Leung, K. Ritchie, and E. Evans, Nature�London� 397, 50 �1999�.
2 A. Pierres, D. Touchard, A. M. Benoliel, and P. Bongrand, Biophys. J.82, 3214 �2002�.
3 E. Fallman, S. Schedin, J. Jass, M. Andersson, B. E. Uhlin, and O. Axner,Biosens. Bioelectron. 19, 1429 �2004�.
4 E. Evans, Annu. Rev. Biophys. Biomol. Struct. 30, 105 �2001�.5 O. Marti and M. Amrein, STM and SFM in Biology �Academic, SanDiego, 1993�.
6 A. S. Duvez, U. Jonas, and H. Klein, ChemPhysChem 4, 1107 �2003�.7 J. Zlatanova, S. M. Linsday, and S. H. Leuba, Prog. Biophys. Mol. Biol.
74, 37 �2000�.8 E. L. Florin, V. T. Moy, and H. E. Gaub, Science 264, 415 �1994�.9 P. Hinterdorfer, W. Baumgartner, H. J. Gruber, K. Schilcher, and H.Schindler, Proc. Natl. Acad. Sci. U.S.A. 93, 3477 �1996�.
10 I. Schumakovitch, W. Grange, T. Strunz, P. Bertoncini, H. J. Guntherodt,and M. Hegner, Biophys. J. 82, 517 �2002�.
11 Y. S. Lo, N. D. Huefner, W. S. Chan, F. Stevens, J. M. Harris, and T. P.Beebe, Langmuir 15, 1373 �1999�.
12 V. T. Moy, E. L. Florin, and H. E. Gaub, Science 266, 257 �1994�.13 F. Li, S. D. Redick, H. P. Erickson, and V. T. Moy, Biophys. J. 84, 1252
�2003�.14 A. Chen and V. T. Moy, Biophys. J. 78, 2814 �2000�.15 W. Baumgartner, P. Hinterdorfer, W. Ness, A. Raab, D. Vestweber, H.
Schindler, and D. Drenckhahn, Proc. Natl. Acad. Sci. U.S.A. 97, 4005�2000�.
16 P. Hänggi, P. Talkner, and M. Borkovec, Rev. Mod. Phys. 62, 251 �1990�.17 H. Lodish, Molecular Cell Biology �Freeman, New York, 2003�.18 G. I. Bell, Science 200, 618 �1978�.19 E. Evans and K. Ritchie, Biophys. J. 72, 1541 �1997�.20 N. Sharon and H. Lis, J. Agric. Food Chem. 50, 6586 �2002�.21 E. Gnecco, R. Bennewitz, T. Gyalog, C. Loppacher, M. Bammerlin, E.
Meyer, and H. Guntherodt, Phys. Rev. Lett. 84, 1172 �2000�.22 E. Riedo and E. Gnecco, Nanotechnology 15, S288 �2004�.23 C. Hashimoto, E. R. Cohen, W. J. Zhang, and C. E. Ballou, Proc. Natl.
Acad. Sci. U.S.A. 78, 2244 �1981�.24 M. Lekka, P. Laidler, J. Dulinska, M. Labedz, and G. Pyka, Eur. Biophys.
J. 33, 664 �2004�.25 N. Wang, E. Ostuni, G. M. Whitesides, and D. E. Ingber, Cell Motil.
Cytoskeleton 52, 97 �2002�.26 A. Bernard, J. P. Renault, B. Michel, H. R. Bosshard, and E. Delamarche,
Adv. Mater. �Weinheim, Ger.� 12, 1067 �2000�.27 J. M. Neumeister and W. A. Ducker, Rev. Sci. Instrum. 65, 2527 �1994�.28 O. Marti, J. Colchero, and J. Mlynek, Nanotechnology 1, 141 �1990�.29 R. Lüthi, E. Meyer, H. Haefke, L. Howald, W. Gutmannsbauer, M. Gug-
gisberg, M. Bammerlin, and H. J. Güntherodt, Surf. Sci. 338, 247 �1995�.30 A. E. Filipov, J. Klafter, and M. Urbakh, Phys. Rev. Lett. 92, 135503
�2004�.31 Ch. P. Green, H. Lioe, J. P. Cleveland, R. Proksch, P. Mulvaney, and J. E.
Sader, Rev. Sci. Instrum. 75, 1988 �2004�.32 D. F. Ogletree, R. W. Carpick, and M. Salmeron, Rev. Sci. Instrum. 67,
3298 �1996�.33 O. Marti, Phys. Scr., T T49, 599 �1993�.34 W. Dettmann, M. Grandbois, S. Andre, M. Benoit, A. K. Wehle, H.
Kaltner, H. J. Gabius, and H. E. Gaub, Arch. Biochem. Biophys. 383,157 �2000�.
35 F. J. Tees, R. E. Waugh, and D. A. Hammer, Biophys. J. 80, 668 �2001�.
014702-7 Friction force microscopy to probe interactions J. Chem. Phys. 123, 014702 �2005�
This article is copyrighted as indicated in the article. Reuse of AIP content is subject to the terms at: http://scitation.aip.org/termsconditions. Downloaded to IP:
132.174.255.116 On: Thu, 18 Dec 2014 16:35:51


![Zinc Sorption on Modified Waste Poly(methyl methacrylate) · also requires additional purification and stabilization of the obtained methyl methacrylate [4]. In our alternative strategy,](https://static.fdocuments.pl/doc/165x107/5e1b3fb5dd23dd4a0a10145b/zinc-sorption-on-modified-waste-polymethyl-methacrylate-also-requires-additional.jpg)