![Wole guzowate olbrzymie – opis przypadku Giant …cejsh.icm.edu.pl/.../c/08_.pdfNodular goitre is 4-5 times more common in women than in men [5]. In Poland the obligatory iodine](https://static.fdocuments.pl/doc/165x107/5e403e521e099c466b433c3d/wole-guzowate-olbrzymie-a-opis-przypadku-giant-cejshicmeduplc08pdf.jpg)
Damage detection in composite materialsComposite materials in the form of fibre reinforced polymers...
10
Damage detection in composite materials Tomasz WANDOWSKI 1 , Pawel KUDELA 1 , Pawel MALINOWSKI 1 , Lukasz SARNIAK 2 , Radoslaw KARCZEWSKI 2 , Wieslaw OSTACHOWICZ 1,3 1 Institute of Fluid–Flow Machinery, PAS, Fiszera 14 St. Gdansk 80-231 POLAND [email protected] ; [email protected] ; [email protected] ; [email protected] 2 Materials Engineers Group Sp. z o. o. Woloska 141 St. Warsaw 02-507 POLAND [email protected] ; [email protected] 3 Faculty of Automotive and Construction Machinery, Warsaw University of Technology, Narbutta 84 St., Warsaw 02-524 POLAND Key words: Composite materials, NDT, Guided waves, Mode conversion, Scanning Laser Doppler Vibrometry SLDV, Delamination. Abstract In this paper damage detection method for composite materials is presented. This method is based on phenomenon of guided waves propagation. Guided waves are generated by piezoelectric transducer and registered by Scanning Laser Doppler Vibrometer (SLDV). Signal processing is based on the full wave-field measurements where signals representing propagation of elastic waves are gathered from dense mesh of points that span over investigated area of composite part. This approach allows to animate the guided wave propagation. It is also suitable for analysis of interaction of guided waves with different discontinuities located in composite material. Research presented in this paper is also focused on the analysis of phenomenon of guided wave mode conversion and its potential for damage detection. Moreover, results of classical ultrasonic inspection method are presented. Delamination was simulated by teflon insert located between layers of composite sample. In this paper experimental findings are supported by numerical simulations by using the Spectral Element Method (SEM) in time domain. 1 INTRODUCTION Composite materials in the form of fibre reinforced polymers are more and more utilized in many branches of industry. Most popular are carbon fibre reinforced polymers CFRPs and glass fibre reinforced polymers GFRPs. Very important is problem of damage detection that can initiate and grow in composite structural elements. Most common type of damage in composite materials is delamination. There are many non-destructive testing NDT techniques that can be utilized for damage detection and localization in fibre reinforced polymers FRPs. In this purpose such NDT techniques like ultrasound testing UT [1],[2], active infrared thermography [2], Eddy currents [3], X-ray tomography [4], terahertz spectroscopy [1],[5] and guided waves GW are utilized. In this paper authors focused attention on guided wave propagation method and full wavefield approach using scanning laser Doppler vibrometry SLDV. In this approach waves are excited using piezoelectric transducers whereas wave sensing process is realized utilizing SLDV. Laser vibrometry is noncontact measurement technique. Full wavefield measurement More info about this article:http://www.ndt.net/?id=19974
Transcript of Damage detection in composite materialsComposite materials in the form of fibre reinforced polymers...
Damage detection in composite materials Tomasz WANDOWSKI 1, Pawel KUDELA 1, Pawel MALINOWSKI 1, Lukasz SARNIAK 2,
Radoslaw KARCZEWSKI 2, Wieslaw OSTACHOWICZ
1,3
1 Institute of Fluid–Flow Machinery, PAS, Fiszera 14 St. Gdansk 80-231 POLAND
[email protected]; [email protected]; [email protected]; [email protected] 2 Materials Engineers Group Sp. z o. o. Woloska 141 St. Warsaw 02-507 POLAND
[email protected]; [email protected] 3 Faculty of Automotive and Construction Machinery, Warsaw University of Technology,
Narbutta 84 St., Warsaw 02-524 POLAND
Key words: Composite materials, NDT, Guided waves, Mode conversion, Scanning Laser
Doppler Vibrometry SLDV, Delamination.
Abstract In this paper damage detection method for composite materials is presented. This method
is based on phenomenon of guided waves propagation. Guided waves are generated
by piezoelectric transducer and registered by Scanning Laser Doppler Vibrometer (SLDV).
Signal processing is based on the full wave-field measurements where signals representing
propagation of elastic waves are gathered from dense mesh of points that span over
investigated area of composite part. This approach allows to animate the guided wave
propagation. It is also suitable for analysis of interaction of guided waves with different
discontinuities located in composite material. Research presented in this paper is also
focused on the analysis of phenomenon of guided wave mode conversion and its potential
for damage detection. Moreover, results of classical ultrasonic inspection method are
presented. Delamination was simulated by teflon insert located between layers of composite
sample. In this paper experimental findings are supported by numerical simulations by using
the Spectral Element Method (SEM) in time domain.
1 INTRODUCTION
Composite materials in the form of fibre reinforced polymers are more and more utilized
in many branches of industry. Most popular are carbon fibre reinforced polymers CFRPs and
glass fibre reinforced polymers GFRPs. Very important is problem of damage detection that
can initiate and grow in composite structural elements. Most common type of damage in
composite materials is delamination.
There are many non-destructive testing NDT techniques that can be utilized for damage
detection and localization in fibre reinforced polymers FRPs. In this purpose such NDT
techniques like ultrasound testing UT [1],[2], active infrared thermography [2], Eddy currents [3], X-ray tomography [4], terahertz spectroscopy [1],[5] and guided waves GW are utilized.
In this paper authors focused attention on guided wave propagation method and full wavefield approach using scanning laser Doppler vibrometry SLDV. In this approach waves
are excited using piezoelectric transducers whereas wave sensing process is realized utilizing SLDV. Laser vibrometry is noncontact measurement technique. Full wavefield measurement
Mor
e in
fo a
bout
this
art
icle
: http
://w
ww
.ndt
.net
/?id
=19
974
2
approach based on SLDV allows to visualize and analyse guided wave propagation complex structures. Beside this detailed analysis of GW propagation in frequency-wavenumber
domain in the purpose of damage detection can be performed [6], [7]. In the papers [8], [9] approach for damage detection based on local wavenumber analysis was proposed. Problem
of delamination localization using full wavefield approach was for example investigated in papers [9], [10]. Authors of papers [11], [12], [13] focused attention on wave trapping effect
in the delaminated region. SLDV technique can be also utilized for analysis of mode conversion phenomenon [14].
2 ANALYSIS OF GUIDED WAVE INTERACTION WITH DELAMINATION
In this section results of numerical study of interaction of GW with delamination are
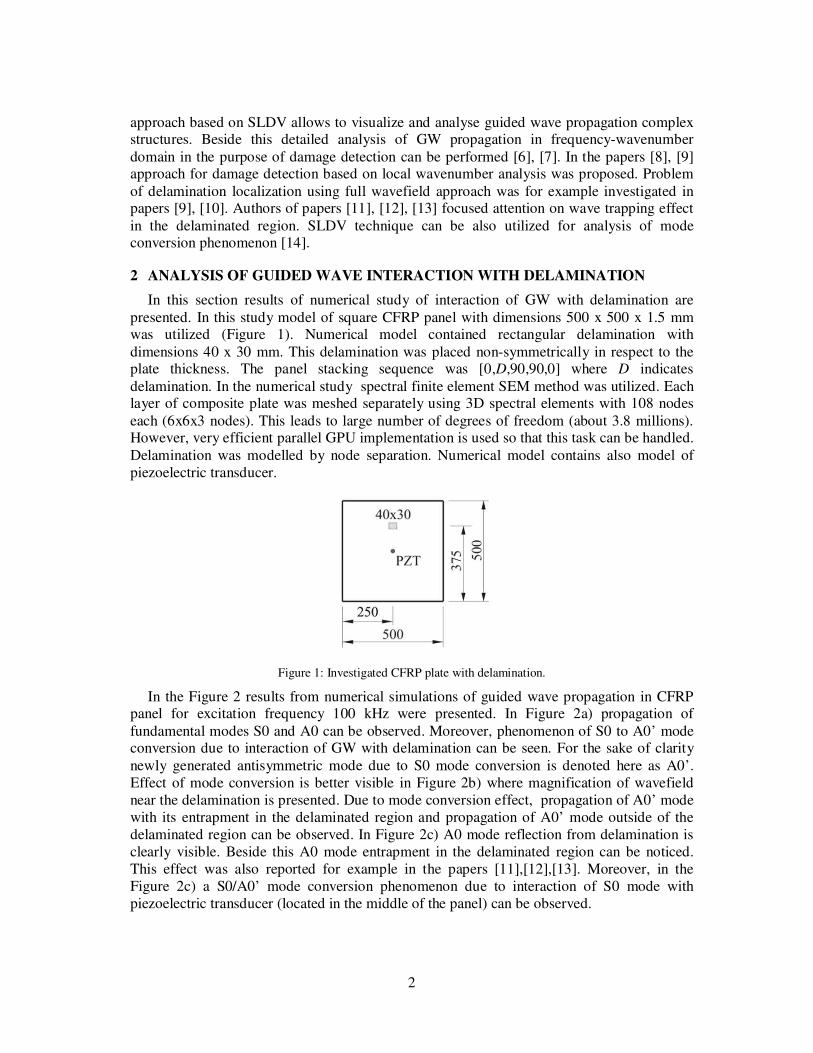
presented. In this study model of square CFRP panel with dimensions 500 x 500 x 1.5 mm was utilized (Figure 1). Numerical model contained rectangular delamination with
dimensions 40 x 30 mm. This delamination was placed non-symmetrically in respect to the plate thickness. The panel stacking sequence was [0,D,90,90,0] where D indicates
delamination. In the numerical study spectral finite element SEM method was utilized. Each layer of composite plate was meshed separately using 3D spectral elements with 108 nodes
each (6x6x3 nodes). This leads to large number of degrees of freedom (about 3.8 millions). However, very efficient parallel GPU implementation is used so that this task can be handled.
Delamination was modelled by node separation. Numerical model contains also model of
piezoelectric transducer.
Figure 1: Investigated CFRP plate with delamination.
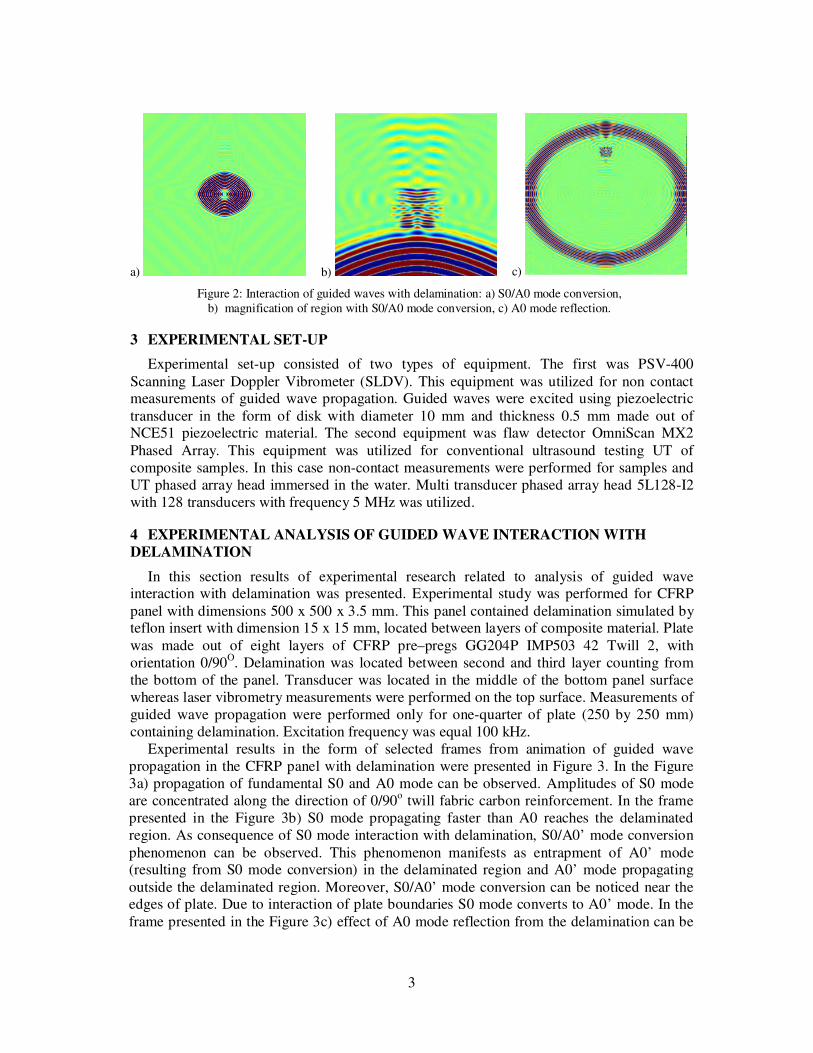
In the Figure 2 results from numerical simulations of guided wave propagation in CFRP panel for excitation frequency 100 kHz were presented. In Figure 2a) propagation of
fundamental modes S0 and A0 can be observed. Moreover, phenomenon of S0 to A0’ mode conversion due to interaction of GW with delamination can be seen. For the sake of clarity
newly generated antisymmetric mode due to S0 mode conversion is denoted here as A0’.
Effect of mode conversion is better visible in Figure 2b) where magnification of wavefield
near the delamination is presented. Due to mode conversion effect, propagation of A0’ mode
with its entrapment in the delaminated region and propagation of A0’ mode outside of the
delaminated region can be observed. In Figure 2c) A0 mode reflection from delamination is
clearly visible. Beside this A0 mode entrapment in the delaminated region can be noticed.
This effect was also reported for example in the papers [11],[12],[13]. Moreover, in the
Figure 2c) a S0/A0’ mode conversion phenomenon due to interaction of S0 mode with
piezoelectric transducer (located in the middle of the panel) can be observed.
3
a) b) c)
Figure 2: Interaction of guided waves with delamination: a) S0/A0 mode conversion,
b) magnification of region with S0/A0 mode conversion, c) A0 mode reflection.
3 EXPERIMENTAL SET-UP
Experimental set-up consisted of two types of equipment. The first was PSV-400
Scanning Laser Doppler Vibrometer (SLDV). This equipment was utilized for non contact measurements of guided wave propagation. Guided waves were excited using piezoelectric
transducer in the form of disk with diameter 10 mm and thickness 0.5 mm made out of NCE51 piezoelectric material. The second equipment was flaw detector OmniScan MX2
Phased Array. This equipment was utilized for conventional ultrasound testing UT of
composite samples. In this case non-contact measurements were performed for samples and
UT phased array head immersed in the water. Multi transducer phased array head 5L128-I2
with 128 transducers with frequency 5 MHz was utilized.
4 EXPERIMENTAL ANALYSIS OF GUIDED WAVE INTERACTION WITH
DELAMINATION
In this section results of experimental research related to analysis of guided wave interaction with delamination was presented. Experimental study was performed for CFRP
panel with dimensions 500 x 500 x 3.5 mm. This panel contained delamination simulated by teflon insert with dimension 15 x 15 mm, located between layers of composite material. Plate
was made out of eight layers of CFRP pre–pregs GG204P IMP503 42 Twill 2, with
orientation 0/90O. Delamination was located between second and third layer counting from
the bottom of the panel. Transducer was located in the middle of the bottom panel surface
whereas laser vibrometry measurements were performed on the top surface. Measurements of
guided wave propagation were performed only for one-quarter of plate (250 by 250 mm)
containing delamination. Excitation frequency was equal 100 kHz.
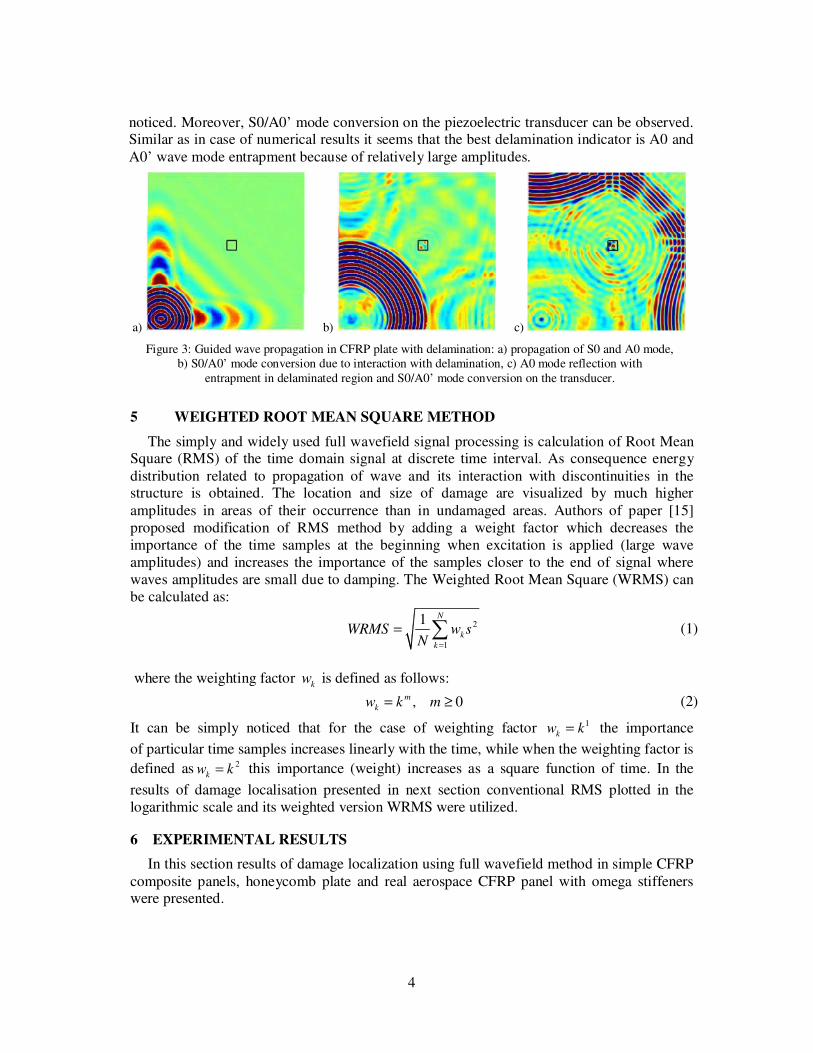
Experimental results in the form of selected frames from animation of guided wave
propagation in the CFRP panel with delamination were presented in Figure 3. In the Figure
3a) propagation of fundamental S0 and A0 mode can be observed. Amplitudes of S0 mode
are concentrated along the direction of 0/90o twill fabric carbon reinforcement. In the frame
presented in the Figure 3b) S0 mode propagating faster than A0 reaches the delaminated
region. As consequence of S0 mode interaction with delamination, S0/A0’ mode conversion
phenomenon can be observed. This phenomenon manifests as entrapment of A0’ mode (resulting from S0 mode conversion) in the delaminated region and A0’ mode propagating
outside the delaminated region. Moreover, S0/A0’ mode conversion can be noticed near the edges of plate. Due to interaction of plate boundaries S0 mode converts to A0’ mode. In the
frame presented in the Figure 3c) effect of A0 mode reflection from the delamination can be
4
noticed. Moreover, S0/A0’ mode conversion on the piezoelectric transducer can be observed. Similar as in case of numerical results it seems that the best delamination indicator is A0 and
A0’ wave mode entrapment because of relatively large amplitudes.
a) b) c)
Figure 3: Guided wave propagation in CFRP plate with delamination: a) propagation of S0 and A0 mode,
b) S0/A0’ mode conversion due to interaction with delamination, c) A0 mode reflection with
entrapment in delaminated region and S0/A0’ mode conversion on the transducer.
5 WEIGHTED ROOT MEAN SQUARE METHOD
The simply and widely used full wavefield signal processing is calculation of Root Mean Square (RMS) of the time domain signal at discrete time interval. As consequence energy
distribution related to propagation of wave and its interaction with discontinuities in the structure is obtained. The location and size of damage are visualized by much higher
amplitudes in areas of their occurrence than in undamaged areas. Authors of paper [15]
proposed modification of RMS method by adding a weight factor which decreases the
importance of the time samples at the beginning when excitation is applied (large wave
amplitudes) and increases the importance of the samples closer to the end of signal where
waves amplitudes are small due to damping. The Weighted Root Mean Square (WRMS) can
be calculated as:
2
1
1 N
k
k
WRMS w sN
=
= ∑ (1)
where the weighting factor k
w is defined as follows:
, 0m
kw k m= ≥ (2)
It can be simply noticed that for the case of weighting factor 1
kw k= the importance
of particular time samples increases linearly with the time, while when the weighting factor is
defined as 2
kw k= this importance (weight) increases as a square function of time. In the
results of damage localisation presented in next section conventional RMS plotted in the
logarithmic scale and its weighted version WRMS were utilized.
6 EXPERIMENTAL RESULTS
In this section results of damage localization using full wavefield method in simple CFRP
composite panels, honeycomb plate and real aerospace CFRP panel with omega stiffeners were presented.
5
6.1 CFRP panel
In the first case simple CFRP panel with the same dimensions and layer orientation like in
the section 4 were utilized. However, here panels with different delamination sizes were
investigated: 10 by 10 mm, 15 by 15 mm and 20 by 20 mm. Experimental research started
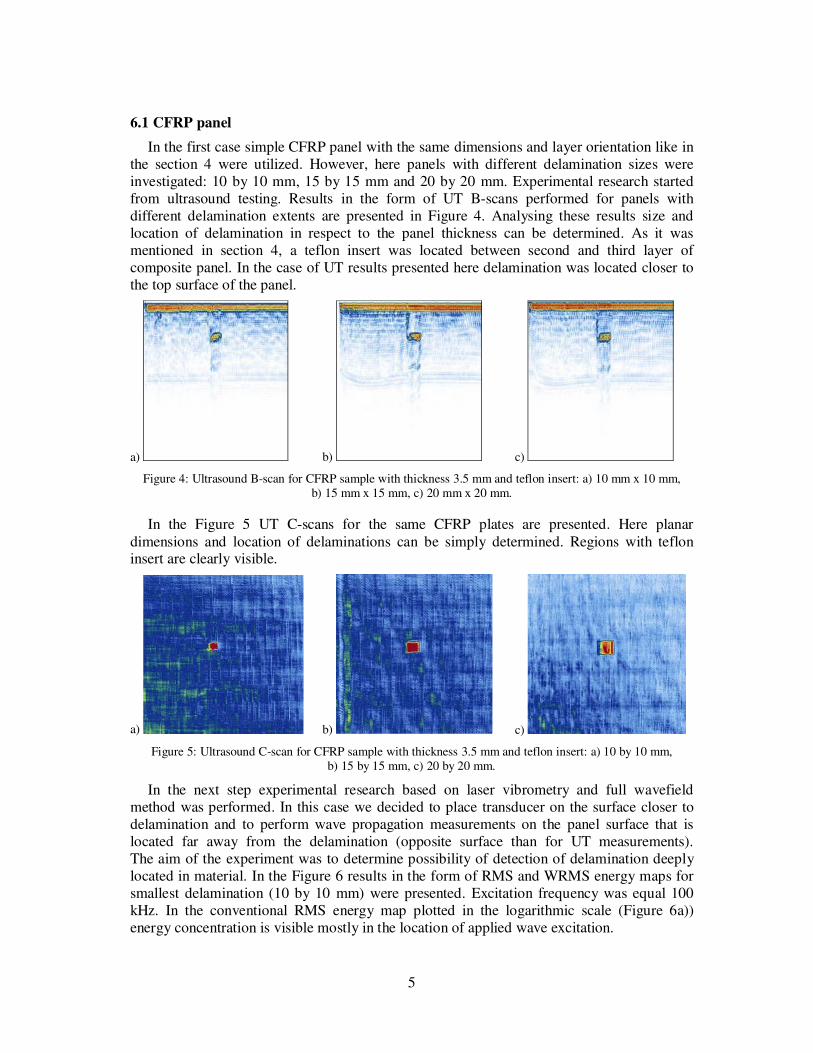
from ultrasound testing. Results in the form of UT B-scans performed for panels with
different delamination extents are presented in Figure 4. Analysing these results size and
location of delamination in respect to the panel thickness can be determined. As it was
mentioned in section 4, a teflon insert was located between second and third layer of
composite panel. In the case of UT results presented here delamination was located closer to
the top surface of the panel.
a) b) c)
Figure 4: Ultrasound B-scan for CFRP sample with thickness 3.5 mm and teflon insert: a) 10 mm x 10 mm,
b) 15 mm x 15 mm, c) 20 mm x 20 mm.
In the Figure 5 UT C-scans for the same CFRP plates are presented. Here planar
dimensions and location of delaminations can be simply determined. Regions with teflon insert are clearly visible.
a) b) c)
Figure 5: Ultrasound C-scan for CFRP sample with thickness 3.5 mm and teflon insert: a) 10 by 10 mm,
b) 15 by 15 mm, c) 20 by 20 mm.
In the next step experimental research based on laser vibrometry and full wavefield
method was performed. In this case we decided to place transducer on the surface closer to
delamination and to perform wave propagation measurements on the panel surface that is
located far away from the delamination (opposite surface than for UT measurements).
The aim of the experiment was to determine possibility of detection of delamination deeply
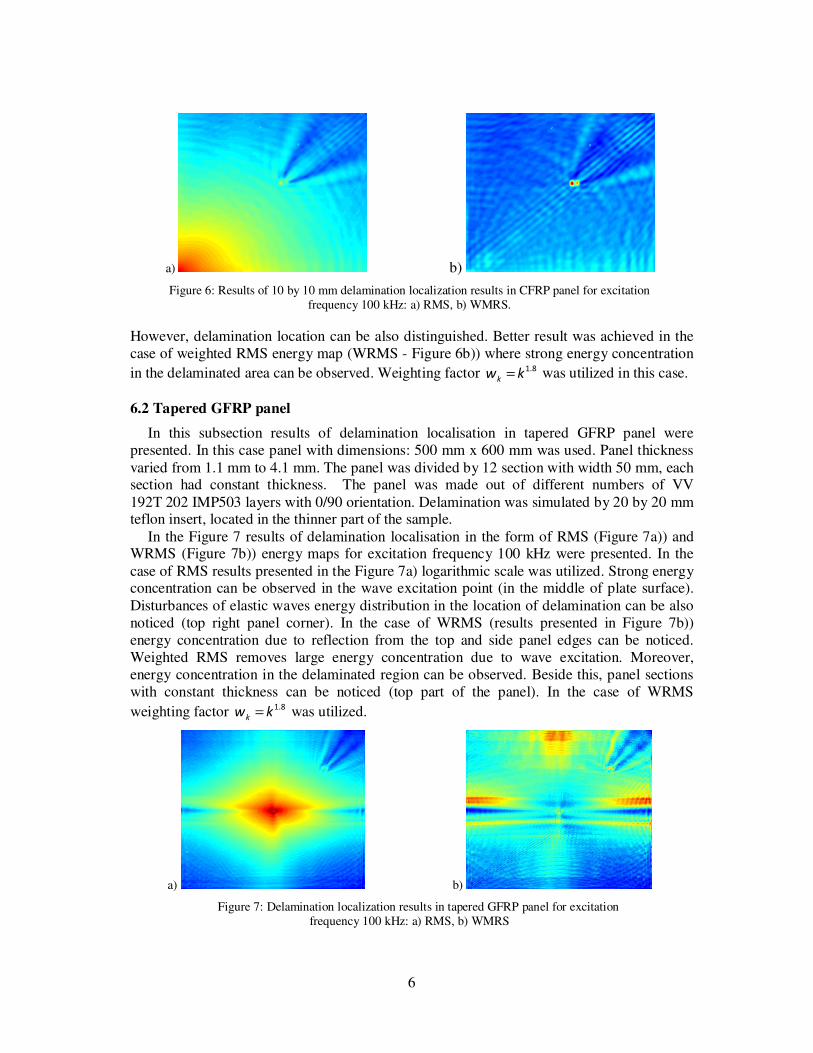
located in material. In the Figure 6 results in the form of RMS and WRMS energy maps for
smallest delamination (10 by 10 mm) were presented. Excitation frequency was equal 100
kHz. In the conventional RMS energy map plotted in the logarithmic scale (Figure 6a))
energy concentration is visible mostly in the location of applied wave excitation.
6
a) b)
Figure 6: Results of 10 by 10 mm delamination localization results in CFRP panel for excitation
frequency 100 kHz: a) RMS, b) WMRS.
However, delamination location can be also distinguished. Better result was achieved in the
case of weighted RMS energy map (WRMS - Figure 6b)) where strong energy concentration
in the delaminated area can be observed. Weighting factor 8.1kw
k= was utilized in this case.
6.2 Tapered GFRP panel
In this subsection results of delamination localisation in tapered GFRP panel were
presented. In this case panel with dimensions: 500 mm x 600 mm was used. Panel thickness
varied from 1.1 mm to 4.1 mm. The panel was divided by 12 section with width 50 mm, each section had constant thickness. The panel was made out of different numbers of VV
192T 202 IMP503 layers with 0/90 orientation. Delamination was simulated by 20 by 20 mm teflon insert, located in the thinner part of the sample.
In the Figure 7 results of delamination localisation in the form of RMS (Figure 7a)) and WRMS (Figure 7b)) energy maps for excitation frequency 100 kHz were presented. In the
case of RMS results presented in the Figure 7a) logarithmic scale was utilized. Strong energy concentration can be observed in the wave excitation point (in the middle of plate surface).
Disturbances of elastic waves energy distribution in the location of delamination can be also
noticed (top right panel corner). In the case of WRMS (results presented in Figure 7b))
energy concentration due to reflection from the top and side panel edges can be noticed.
Weighted RMS removes large energy concentration due to wave excitation. Moreover,
energy concentration in the delaminated region can be observed. Beside this, panel sections
with constant thickness can be noticed (top part of the panel). In the case of WRMS
weighting factor 8.1kw
k= was utilized.
a) b)
Figure 7: Delamination localization results in tapered GFRP panel for excitation
frequency 100 kHz: a) RMS, b) WMRS
7
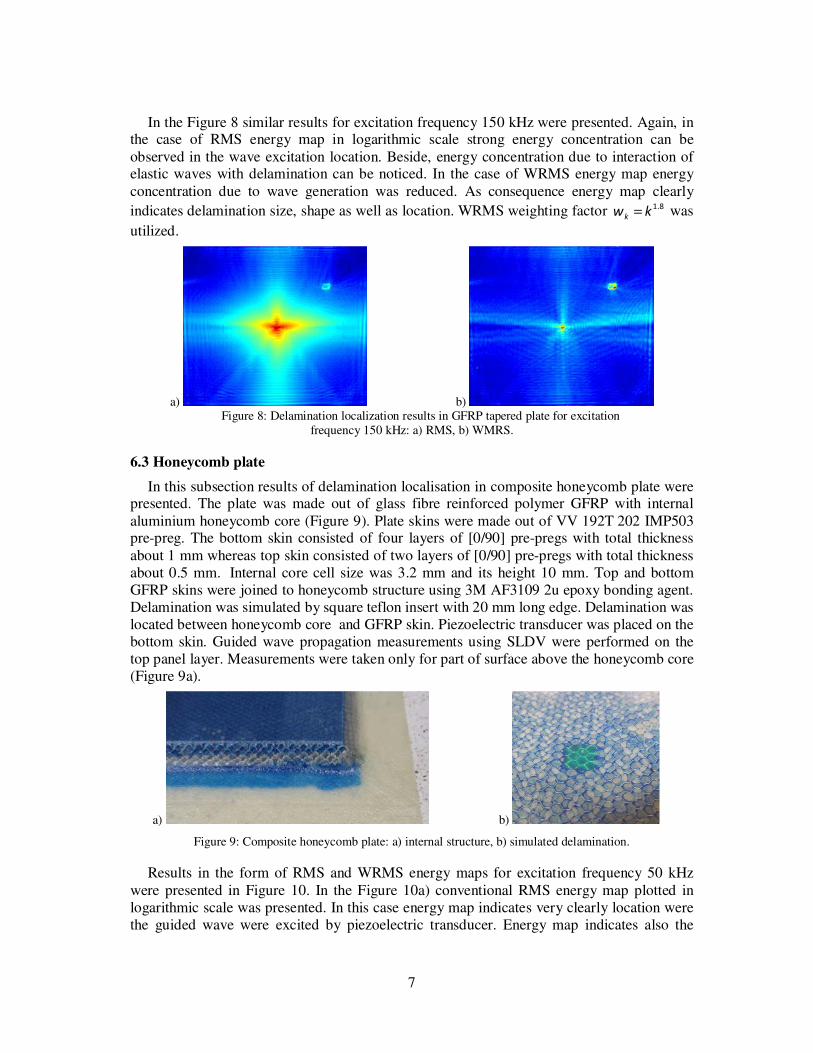
In the Figure 8 similar results for excitation frequency 150 kHz were presented. Again, in the case of RMS energy map in logarithmic scale strong energy concentration can be
observed in the wave excitation location. Beside, energy concentration due to interaction of elastic waves with delamination can be noticed. In the case of WRMS energy map energy
concentration due to wave generation was reduced. As consequence energy map clearly
indicates delamination size, shape as well as location. WRMS weighting factor 8.1kw
k= was
utilized.
a) b) Figure 8: Delamination localization results in GFRP tapered plate for excitation
frequency 150 kHz: a) RMS, b) WMRS.
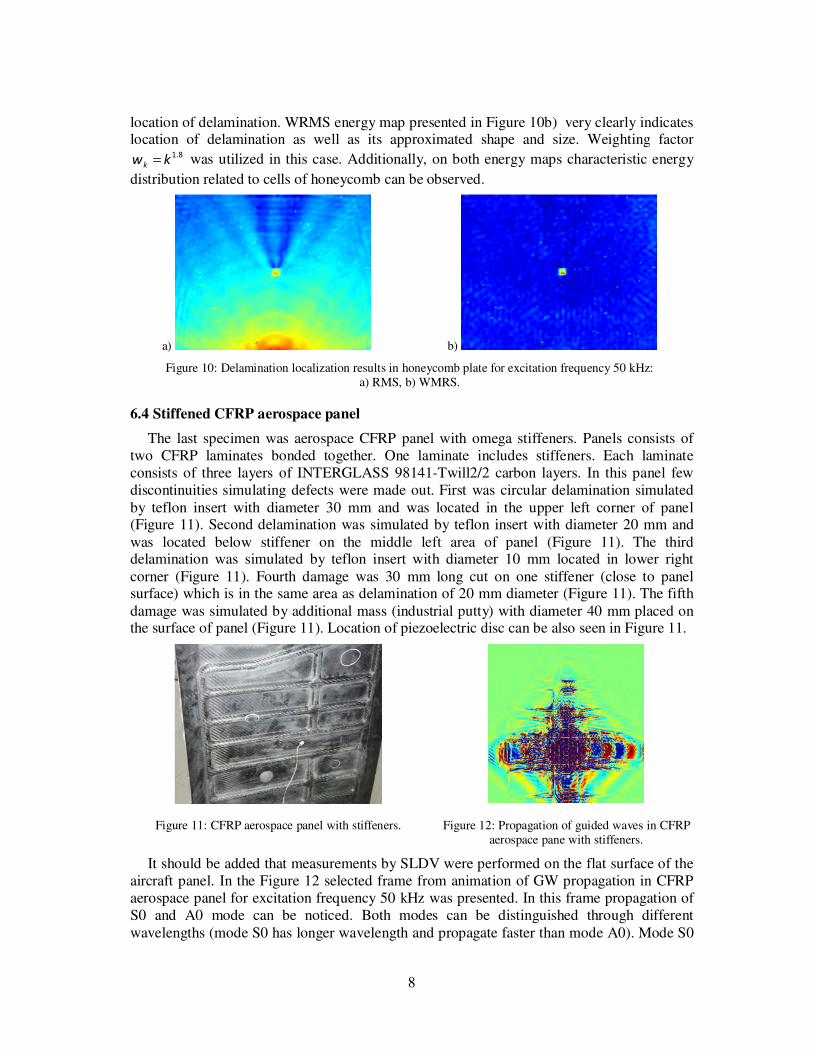
6.3 Honeycomb plate
In this subsection results of delamination localisation in composite honeycomb plate were presented. The plate was made out of glass fibre reinforced polymer GFRP with internal
aluminium honeycomb core (Figure 9). Plate skins were made out of VV 192T 202 IMP503 pre-preg. The bottom skin consisted of four layers of [0/90] pre-pregs with total thickness
about 1 mm whereas top skin consisted of two layers of [0/90] pre-pregs with total thickness
about 0.5 mm. Internal core cell size was 3.2 mm and its height 10 mm. Top and bottom
GFRP skins were joined to honeycomb structure using 3M AF3109 2u epoxy bonding agent.
Delamination was simulated by square teflon insert with 20 mm long edge. Delamination was
located between honeycomb core and GFRP skin. Piezoelectric transducer was placed on the
bottom skin. Guided wave propagation measurements using SLDV were performed on the
top panel layer. Measurements were taken only for part of surface above the honeycomb core
(Figure 9a).
a) b)
Figure 9: Composite honeycomb plate: a) internal structure, b) simulated delamination.
Results in the form of RMS and WRMS energy maps for excitation frequency 50 kHz
were presented in Figure 10. In the Figure 10a) conventional RMS energy map plotted in
logarithmic scale was presented. In this case energy map indicates very clearly location were
the guided wave were excited by piezoelectric transducer. Energy map indicates also the
8
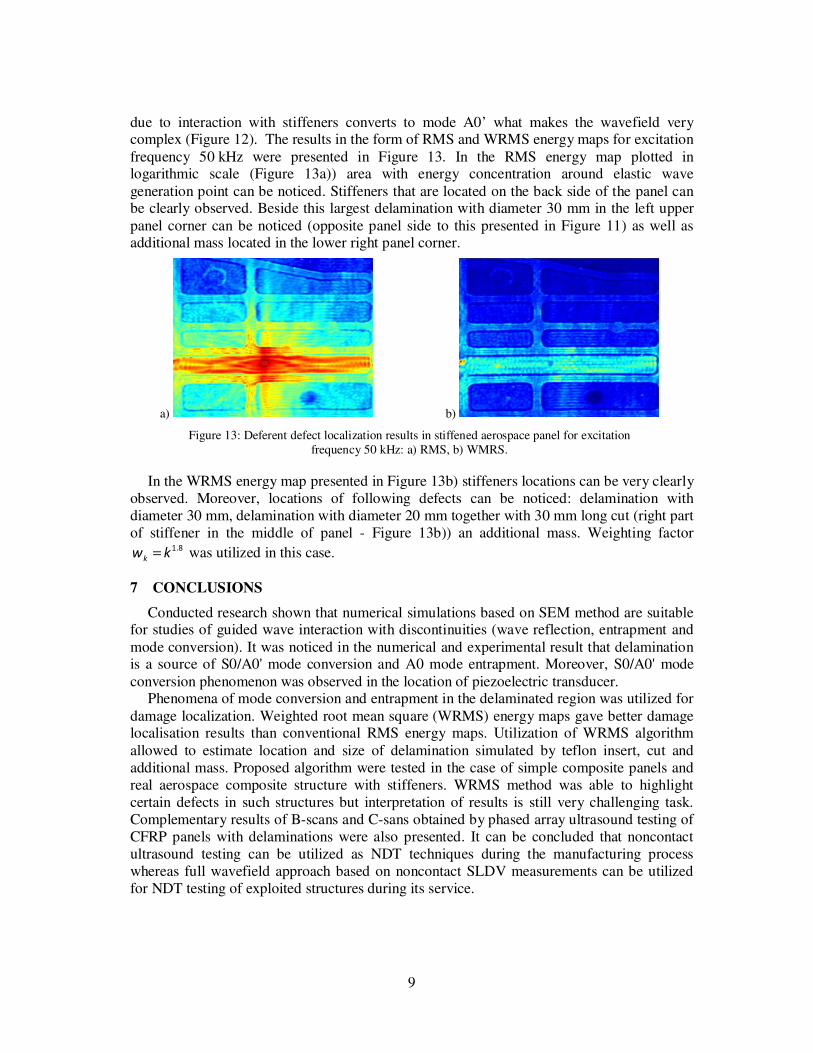
location of delamination. WRMS energy map presented in Figure 10b) very clearly indicates location of delamination as well as its approximated shape and size. Weighting factor
8.1kw
k= was utilized in this case. Additionally, on both energy maps characteristic energy
distribution related to cells of honeycomb can be observed.
a) b)
Figure 10: Delamination localization results in honeycomb plate for excitation frequency 50 kHz:
a) RMS, b) WMRS.
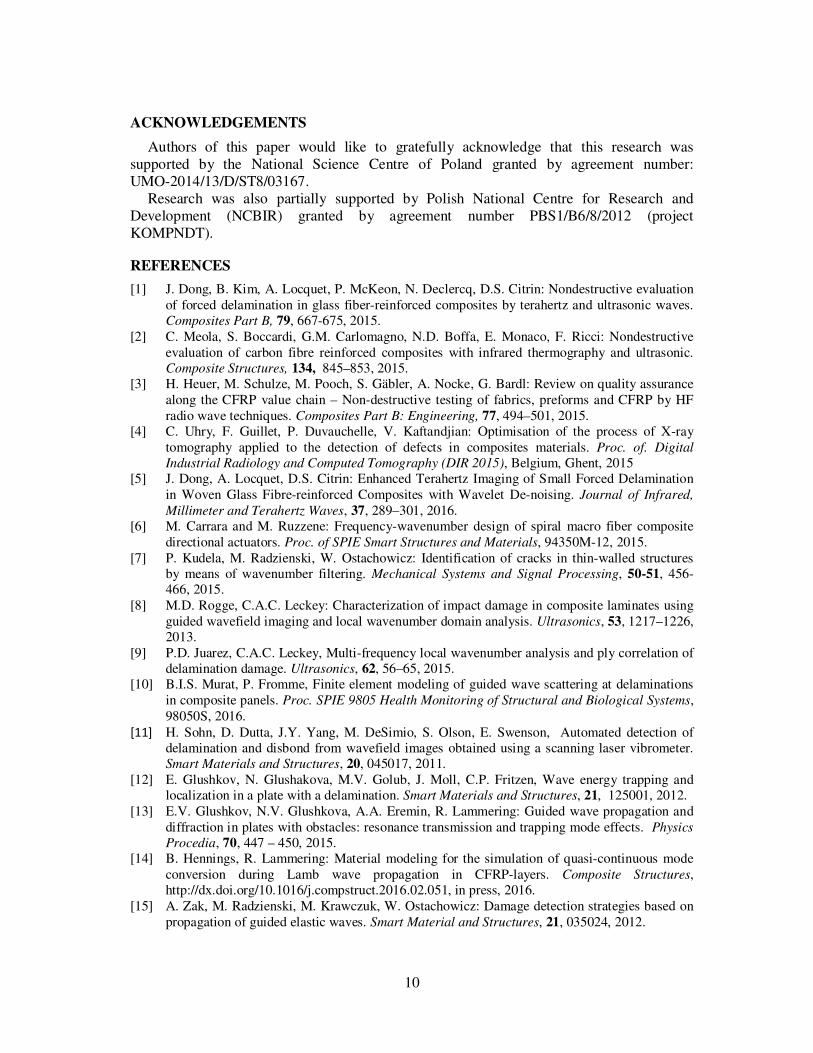
6.4 Stiffened CFRP aerospace panel
The last specimen was aerospace CFRP panel with omega stiffeners. Panels consists of
two CFRP laminates bonded together. One laminate includes stiffeners. Each laminate
consists of three layers of INTERGLASS 98141-Twill2/2 carbon layers. In this panel few
discontinuities simulating defects were made out. First was circular delamination simulated
by teflon insert with diameter 30 mm and was located in the upper left corner of panel (Figure 11). Second delamination was simulated by teflon insert with diameter 20 mm and
was located below stiffener on the middle left area of panel (Figure 11). The third delamination was simulated by teflon insert with diameter 10 mm located in lower right
corner (Figure 11). Fourth damage was 30 mm long cut on one stiffener (close to panel surface) which is in the same area as delamination of 20 mm diameter (Figure 11). The fifth
damage was simulated by additional mass (industrial putty) with diameter 40 mm placed on the surface of panel (Figure 11). Location of piezoelectric disc can be also seen in Figure 11.
Figure 11: CFRP aerospace panel with stiffeners. Figure 12: Propagation of guided waves in CFRP
aerospace pane with stiffeners.
It should be added that measurements by SLDV were performed on the flat surface of the
aircraft panel. In the Figure 12 selected frame from animation of GW propagation in CFRP
aerospace panel for excitation frequency 50 kHz was presented. In this frame propagation of
S0 and A0 mode can be noticed. Both modes can be distinguished through different
wavelengths (mode S0 has longer wavelength and propagate faster than mode A0). Mode S0
9
due to interaction with stiffeners converts to mode A0’ what makes the wavefield very complex (Figure 12). The results in the form of RMS and WRMS energy maps for excitation
frequency 50 kHz were presented in Figure 13. In the RMS energy map plotted in logarithmic scale (Figure 13a)) area with energy concentration around elastic wave
generation point can be noticed. Stiffeners that are located on the back side of the panel can be clearly observed. Beside this largest delamination with diameter 30 mm in the left upper
panel corner can be noticed (opposite panel side to this presented in Figure 11) as well as additional mass located in the lower right panel corner.
a) b)
Figure 13: Deferent defect localization results in stiffened aerospace panel for excitation
frequency 50 kHz: a) RMS, b) WMRS.
In the WRMS energy map presented in Figure 13b) stiffeners locations can be very clearly
observed. Moreover, locations of following defects can be noticed: delamination with
diameter 30 mm, delamination with diameter 20 mm together with 30 mm long cut (right part
of stiffener in the middle of panel - Figure 13b)) an additional mass. Weighting factor 8.1
kwk
= was utilized in this case.
7 CONCLUSIONS
Conducted research shown that numerical simulations based on SEM method are suitable for studies of guided wave interaction with discontinuities (wave reflection, entrapment and
mode conversion). It was noticed in the numerical and experimental result that delamination is a source of S0/A0' mode conversion and A0 mode entrapment. Moreover, S0/A0' mode
conversion phenomenon was observed in the location of piezoelectric transducer. Phenomena of mode conversion and entrapment in the delaminated region was utilized for
damage localization. Weighted root mean square (WRMS) energy maps gave better damage localisation results than conventional RMS energy maps. Utilization of WRMS algorithm
allowed to estimate location and size of delamination simulated by teflon insert, cut and
additional mass. Proposed algorithm were tested in the case of simple composite panels and
real aerospace composite structure with stiffeners. WRMS method was able to highlight
certain defects in such structures but interpretation of results is still very challenging task.
Complementary results of B-scans and C-sans obtained by phased array ultrasound testing of
CFRP panels with delaminations were also presented. It can be concluded that noncontact
ultrasound testing can be utilized as NDT techniques during the manufacturing process
whereas full wavefield approach based on noncontact SLDV measurements can be utilized
for NDT testing of exploited structures during its service.
10
ACKNOWLEDGEMENTS
Authors of this paper would like to gratefully acknowledge that this research was
supported by the National Science Centre of Poland granted by agreement number:
UMO-2014/13/D/ST8/03167.
Research was also partially supported by Polish National Centre for Research and
Development (NCBIR) granted by agreement number PBS1/B6/8/2012 (project
KOMPNDT).
REFERENCES
[1] J. Dong, B. Kim, A. Locquet, P. McKeon, N. Declercq, D.S. Citrin: Nondestructive evaluation
of forced delamination in glass fiber-reinforced composites by terahertz and ultrasonic waves.
Composites Part B, 79, 667-675, 2015.
[2] C. Meola, S. Boccardi, G.M. Carlomagno, N.D. Boffa, E. Monaco, F. Ricci: Nondestructive
evaluation of carbon fibre reinforced composites with infrared thermography and ultrasonic.
Composite Structures, 134, 845–853, 2015.
[3] H. Heuer, M. Schulze, M. Pooch, S. Gäbler, A. Nocke, G. Bardl: Review on quality assurance
along the CFRP value chain – Non-destructive testing of fabrics, preforms and CFRP by HF
radio wave techniques. Composites Part B: Engineering, 77, 494–501, 2015.
[4] C. Uhry, F. Guillet, P. Duvauchelle, V. Kaftandjian: Optimisation of the process of X-ray
tomography applied to the detection of defects in composites materials. Proc. of. Digital
Industrial Radiology and Computed Tomography (DIR 2015), Belgium, Ghent, 2015
[5] J. Dong, A. Locquet, D.S. Citrin: Enhanced Terahertz Imaging of Small Forced Delamination
in Woven Glass Fibre-reinforced Composites with Wavelet De-noising. Journal of Infrared,
Millimeter and Terahertz Waves, 37, 289–301, 2016.
[6] M. Carrara and M. Ruzzene: Frequency-wavenumber design of spiral macro fiber composite
directional actuators. Proc. of SPIE Smart Structures and Materials, 94350M-12, 2015.
[7] P. Kudela, M. Radzienski, W. Ostachowicz: Identification of cracks in thin-walled structures
by means of wavenumber filtering. Mechanical Systems and Signal Processing, 50-51, 456-
466, 2015.
[8] M.D. Rogge, C.A.C. Leckey: Characterization of impact damage in composite laminates using
guided wavefield imaging and local wavenumber domain analysis. Ultrasonics, 53, 1217–1226,
2013.
[9] P.D. Juarez, C.A.C. Leckey, Multi-frequency local wavenumber analysis and ply correlation of
delamination damage. Ultrasonics, 62, 56–65, 2015.
[10] B.I.S. Murat, P. Fromme, Finite element modeling of guided wave scattering at delaminations
in composite panels. Proc. SPIE 9805 Health Monitoring of Structural and Biological Systems,
98050S, 2016.
[11] H. Sohn, D. Dutta, J.Y. Yang, M. DeSimio, S. Olson, E. Swenson, Automated detection of
delamination and disbond from wavefield images obtained using a scanning laser vibrometer.
Smart Materials and Structures, 20, 045017, 2011.
[12] E. Glushkov, N. Glushakova, M.V. Golub, J. Moll, C.P. Fritzen, Wave energy trapping and
localization in a plate with a delamination. Smart Materials and Structures, 21, 125001, 2012.
[13] E.V. Glushkov, N.V. Glushkova, A.A. Eremin, R. Lammering: Guided wave propagation and
diffraction in plates with obstacles: resonance transmission and trapping mode effects. Physics
Procedia, 70, 447 – 450, 2015.
[14] B. Hennings, R. Lammering: Material modeling for the simulation of quasi-continuous mode
conversion during Lamb wave propagation in CFRP-layers. Composite Structures,
http://dx.doi.org/10.1016/j.compstruct.2016.02.051, in press, 2016.
[15] A. Zak, M. Radzienski, M. Krawczuk, W. Ostachowicz: Damage detection strategies based on
propagation of guided elastic waves. Smart Material and Structures, 21, 035024, 2012.