Alessandro Vespignani (CNRS, LPT-Paris). Alain Barrat (CNRS, LPT-Paris) Yamir Moreno (University of...
50
Alessandro Vespignani (CNRS, LPT-Paris)
-
Upload
brett-daniel -
Category
Documents
-
view
215 -
download
1
Transcript of Alessandro Vespignani (CNRS, LPT-Paris). Alain Barrat (CNRS, LPT-Paris) Yamir Moreno (University of...
Alessandro Vespignani (CNRS, LPT-Paris)
•Alain Barrat (CNRS, LPT-Paris)
•Yamir Moreno (University of Saragoza)
•Alexei Vazquez (University of Notre Dame)
•Romualdo Pastor-Satorras (UPC -Barcelona)
•Roberto Percacci (INFN)
•Marc Barthelemy (CEA-Paris)
•Luca Dall’Asta (CNRS, LPT-Paris)
•Ignacio Alvarez Hamelin (CNRS, LPT-Paris)
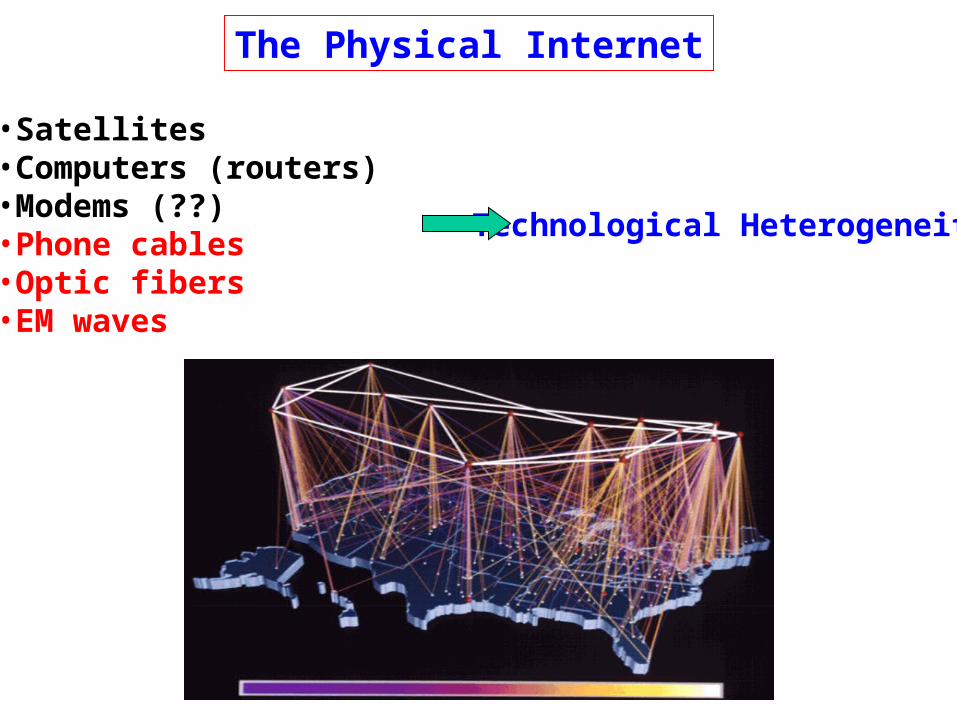
The Physical Internet
•Satellites•Computers (routers)•Modems (??)•Phone cables•Optic fibers•EM waves
Technological Heterogeneity
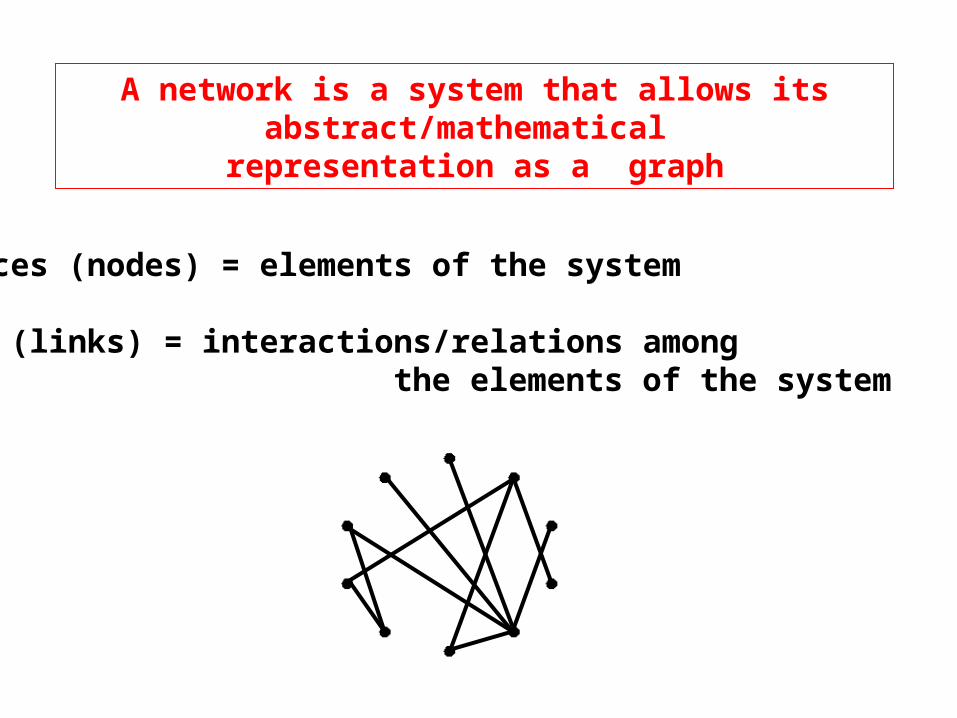
A network is a system that allows its abstract/mathematical representation as a graph
Vertices (nodes) = elements of the system
Edges (links) = interactions/relations among the elements of the system
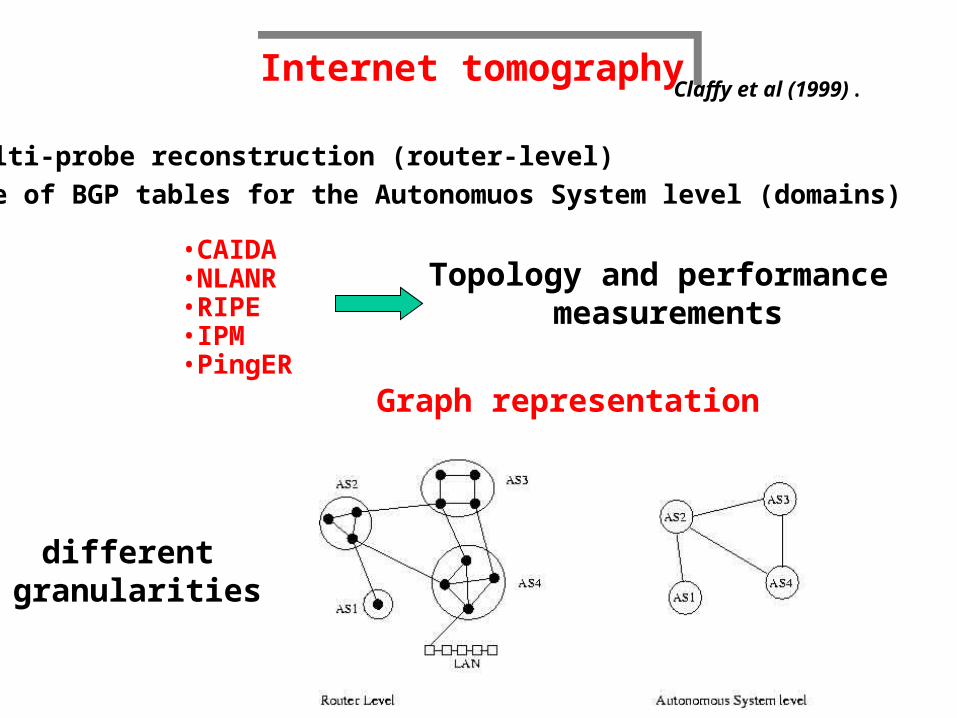
Internet tomographyInternet tomography
•Multi-probe reconstruction (router-level)•Use of BGP tables for the Autonomuos System level (domains)
•CAIDA•NLANR•RIPE•IPM •PingER
Claffy et al (1999).
Topology and performance measurements
Graph representation
different granularities
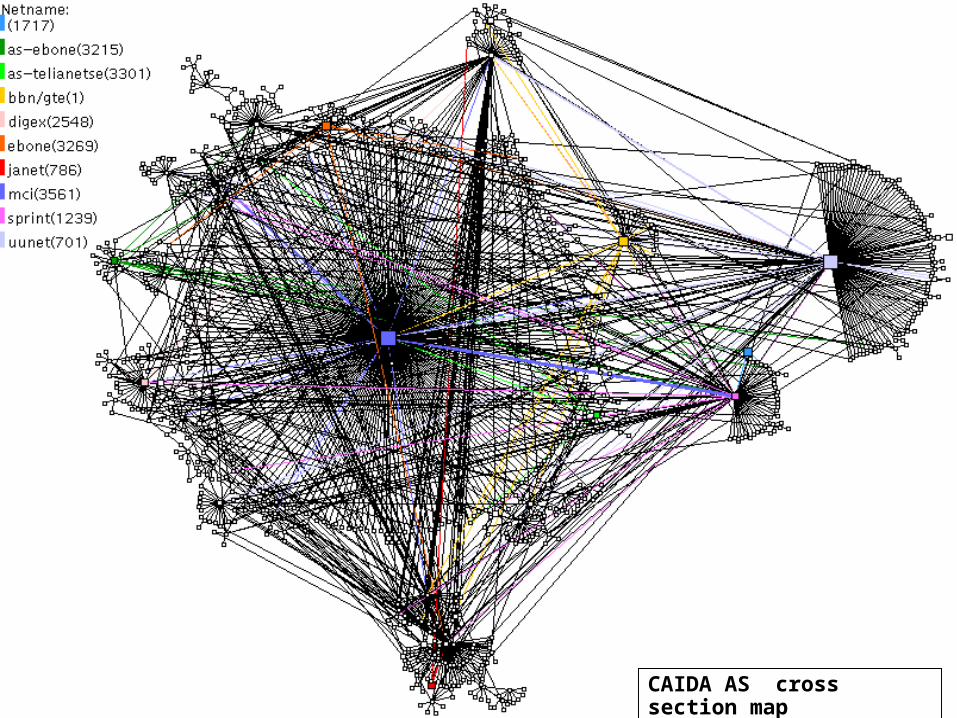
CAIDA AS cross section map
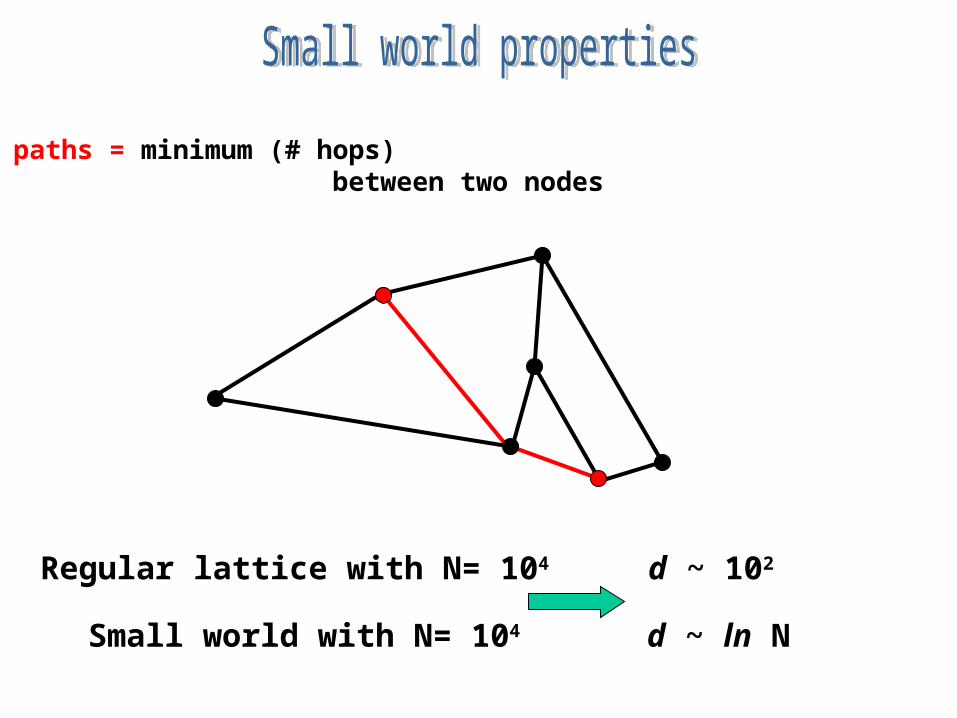
Shortest paths = minimum (# hops) between two nodes
Regular lattice with N= 104 d ~ 102
Small world with N= 104 d ~ ln N
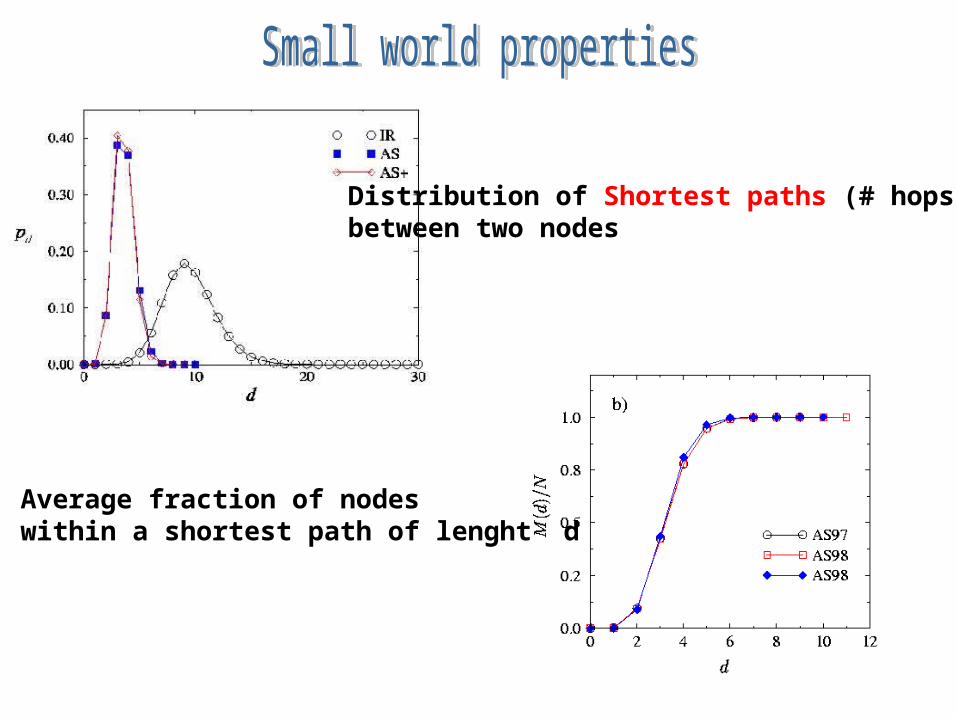
Average fraction of nodes within a shortest path of lenght d
Distribution of Shortest paths (# hops) between two nodes
Haphazard set of points and linesRandomness
This does not imply complexity!!
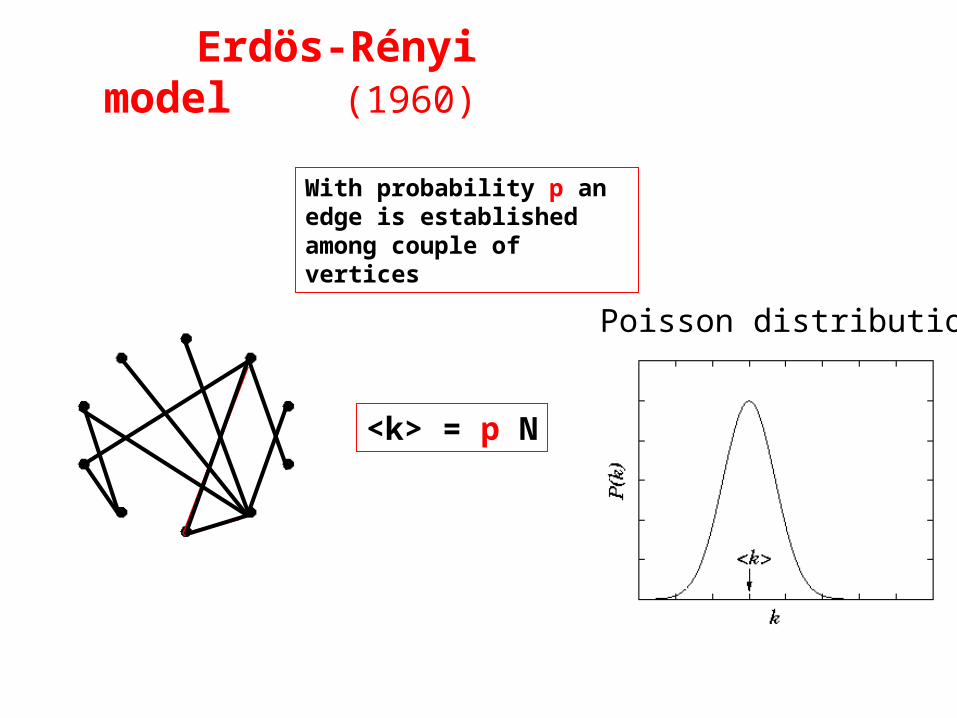
Erdös-Rényi model (1960)
Poisson distribution
With probability p an edge is established among couple of vertices
<k> = p N
Where “the complications” are ??
(Late 90s large networks graphs and data become available)
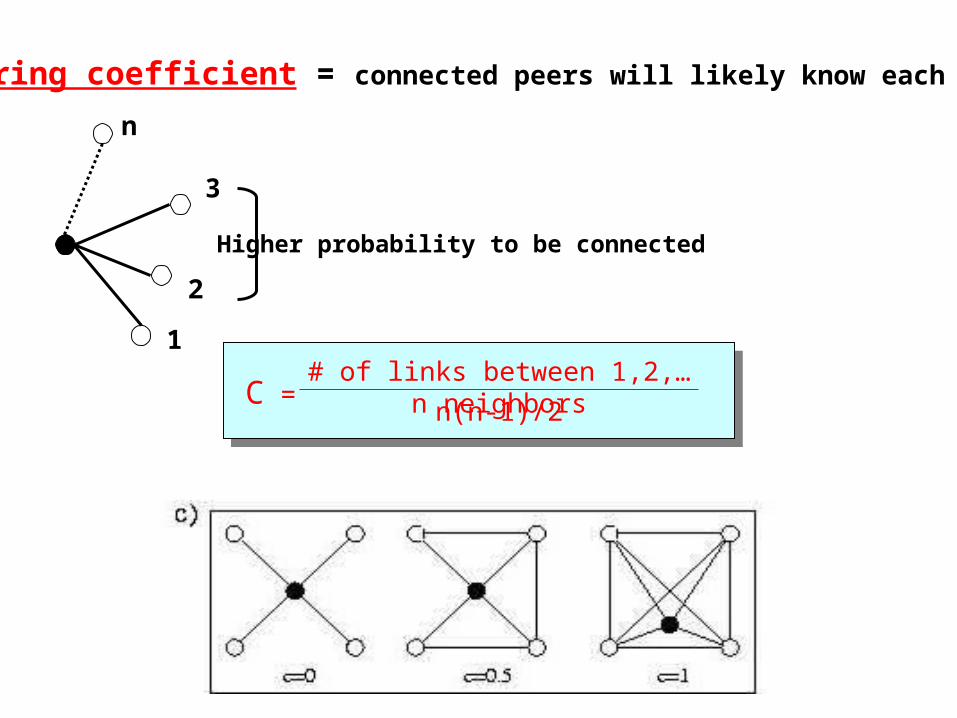
Clustering coefficient = connected peers will likely know each other
C =# of links between 1,2,…n neighbors
n(n-1)/2
1
2
3
n
Higher probability to be connected
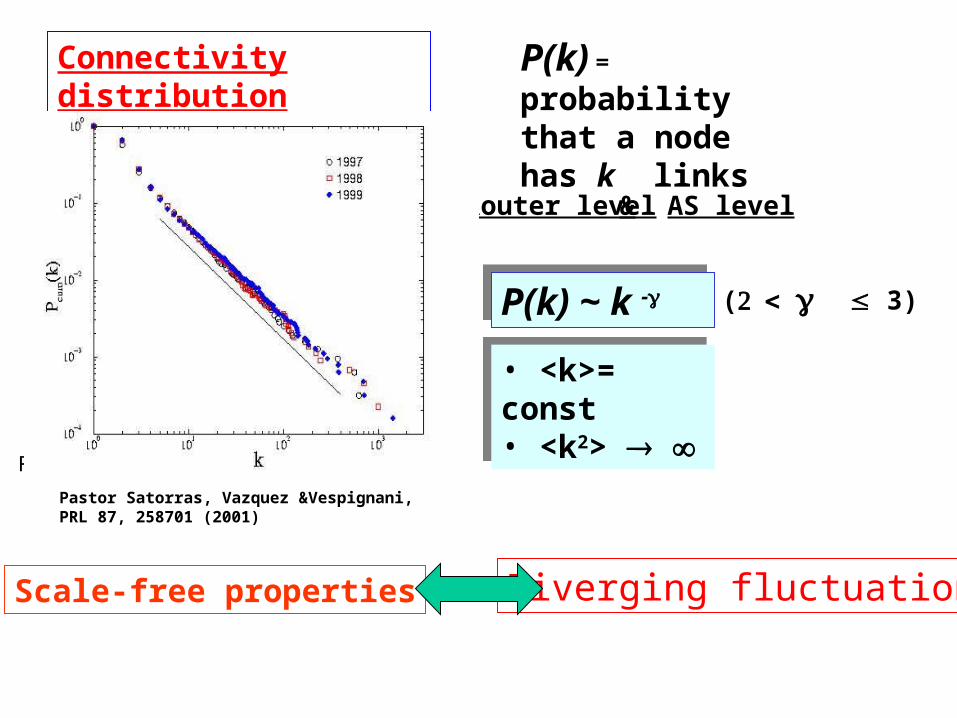
Connectivity distribution
Scale-free properties
P(k) = probability that a node has k links
P(k) ~ k -P(k) ~ k - ( 3)
• <k>= const• <k2> • <k>= const• <k2>
Diverging fluctuations
Faloutsos et al. 1999
•Router level & AS level
Pastor Satorras, Vazquez &Vespignani, PRL 87, 258701 (2001)
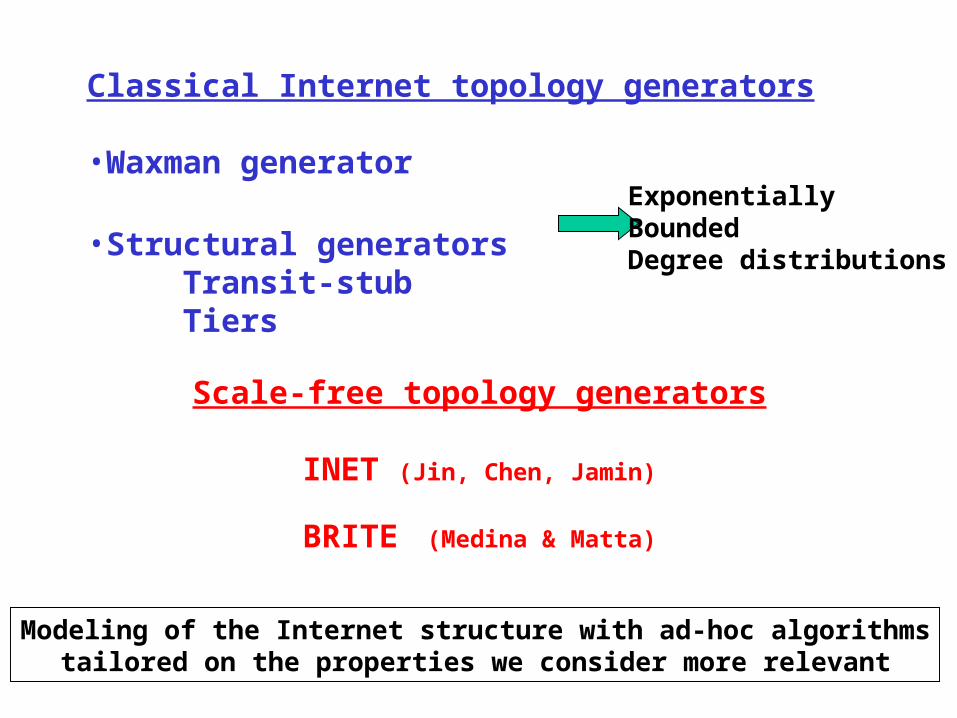
Scale-free topology generators
INET (Jin, Chen, Jamin)
BRITE (Medina & Matta)
Classical Internet topology generators
•Waxman generator
•Structural generatorsTransit-stubTiers
ExponentiallyBoundedDegree distributions
Modeling of the Internet structure with ad-hoc algorithmstailored on the properties we consider more relevant
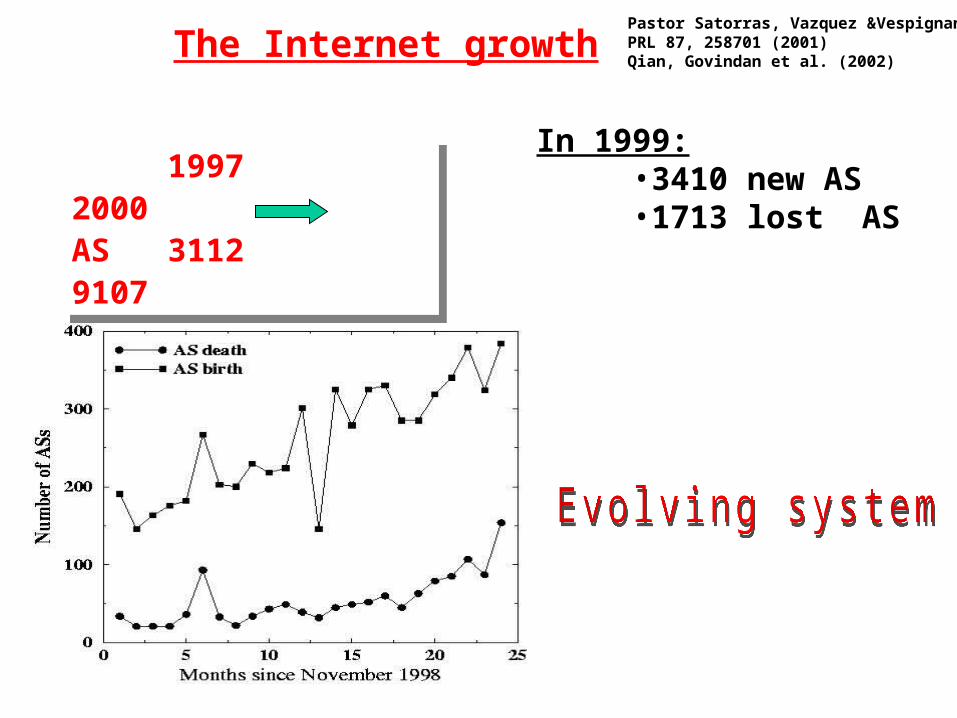
The Internet growth
1997 2000AS 3112 9107
1997 2000AS 3112 9107
In 1999:•3410 new AS•1713 lost AS
Pastor Satorras, Vazquez &Vespignani, PRL 87, 258701 (2001)Qian, Govindan et al. (2002)
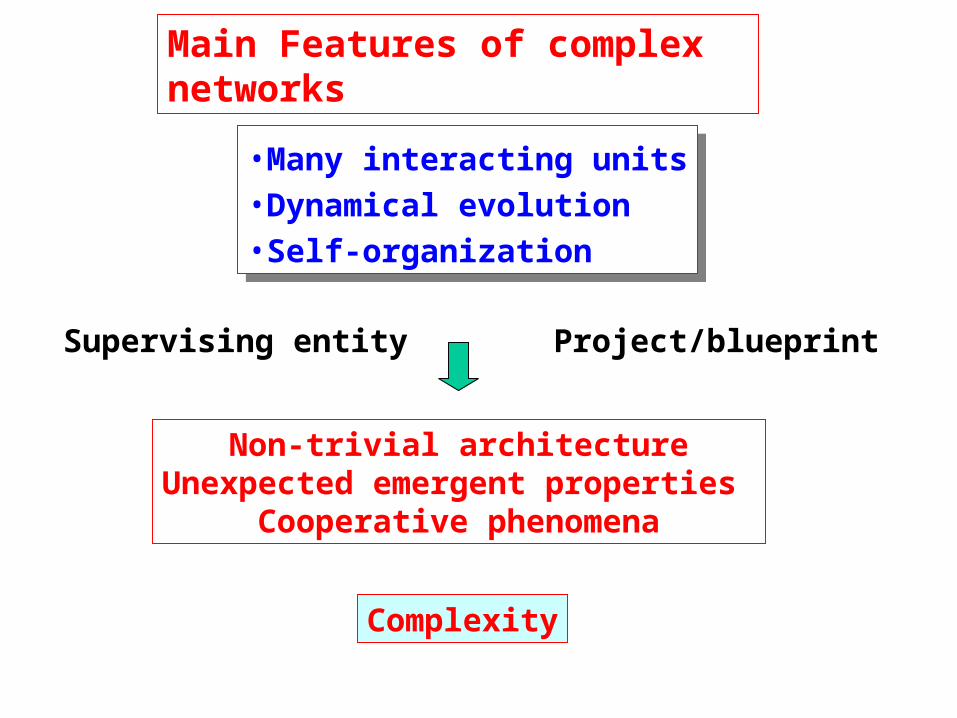
Main Features of complex networks
•Many interacting units•Dynamical evolution•Self-organization
•Many interacting units•Dynamical evolution•Self-organization
Non-trivial architectureUnexpected emergent properties
Cooperative phenomena
Complexity
Supervising entity Project/blueprint
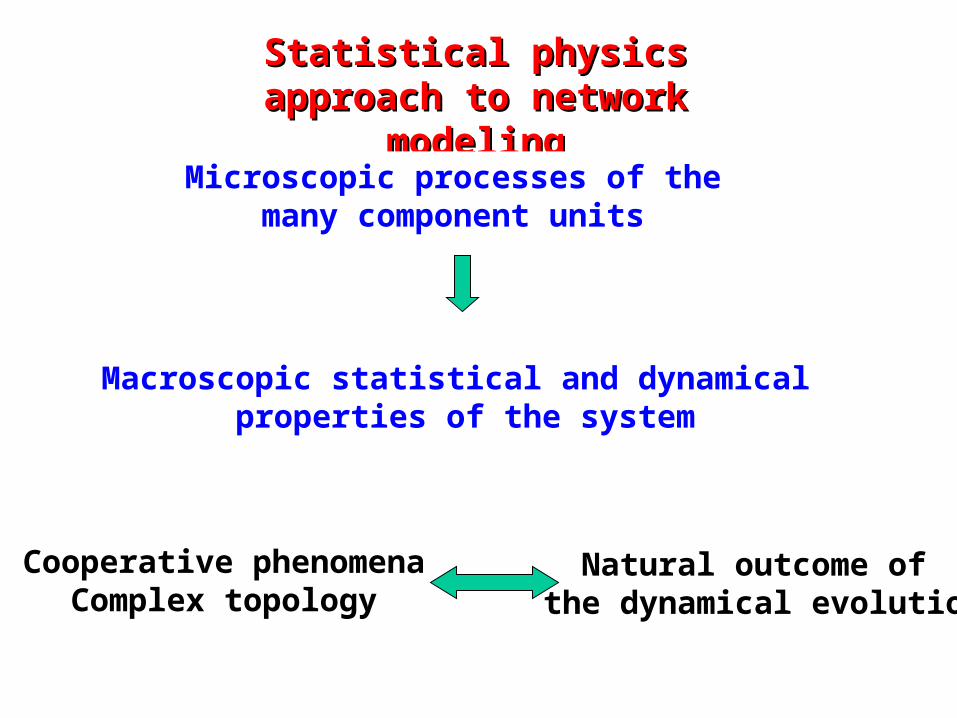
StatisticalStatistical physics approach to physics approach to network modelingnetwork modeling
Microscopic processes of the many component units
Macroscopic statistical and dynamical properties of the system
Cooperative phenomenaComplex topology
Natural outcome of the dynamical evolution
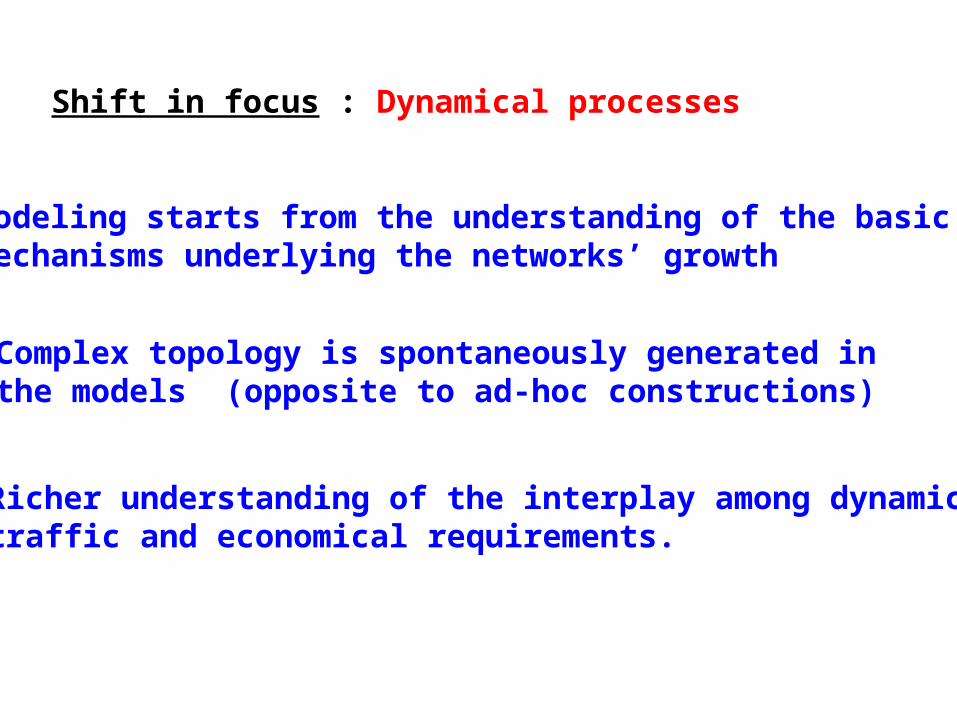
Shift in focus : Dynamical processes
Modeling starts from the understanding of the basic mechanisms underlying the networks’ growth
Complex topology is spontaneously generated in the models (opposite to ad-hoc constructions)
Richer understanding of the interplay among dynamics,traffic and economical requirements.
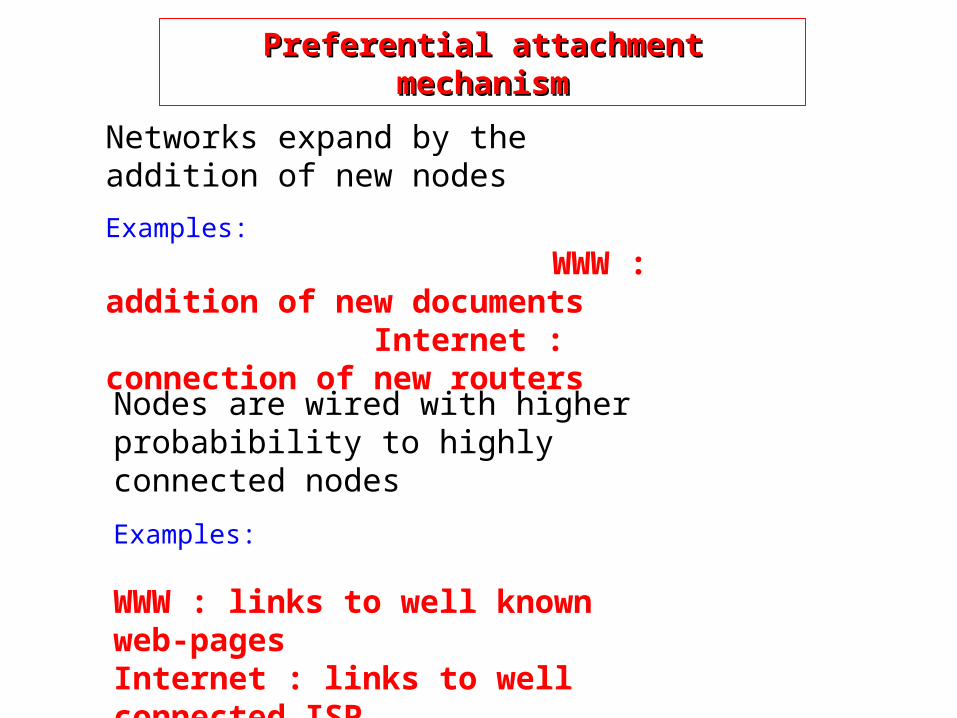
Preferential attachmentPreferential attachment mechanismmechanism
Networks expand by the addition of new nodes
Examples:
WWW : addition of new documents Internet : connection of new routers
Nodes are wired with higher probabibility to highly connected nodes
Examples:
WWW : links to well known web-pages Internet : links to well connected ISP
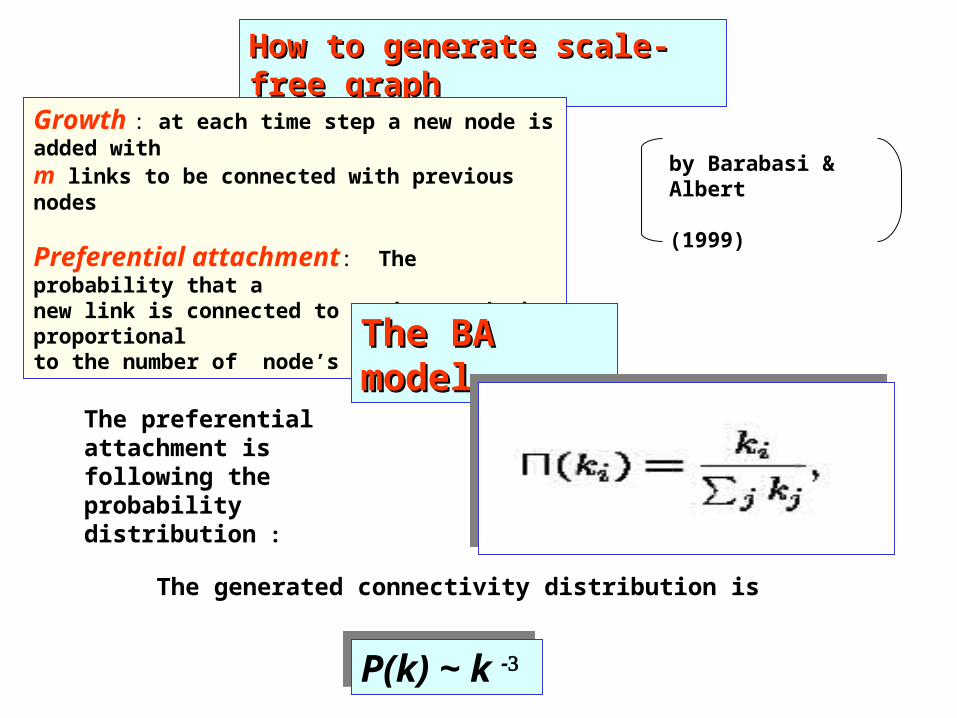
How to generate scale-free graphHow to generate scale-free graph
Growth : at each time step a new node is added with m links to be connected with previous nodes
Preferential attachment: The probability that a new link is connected to a given node is proportional to the number of node’s links.
by Barabasi & Albert (1999)
The BA modelThe BA model
The preferential attachment is following the probability distribution :
The generated connectivity distribution is
P(k) ~ k -P(k) ~ k -
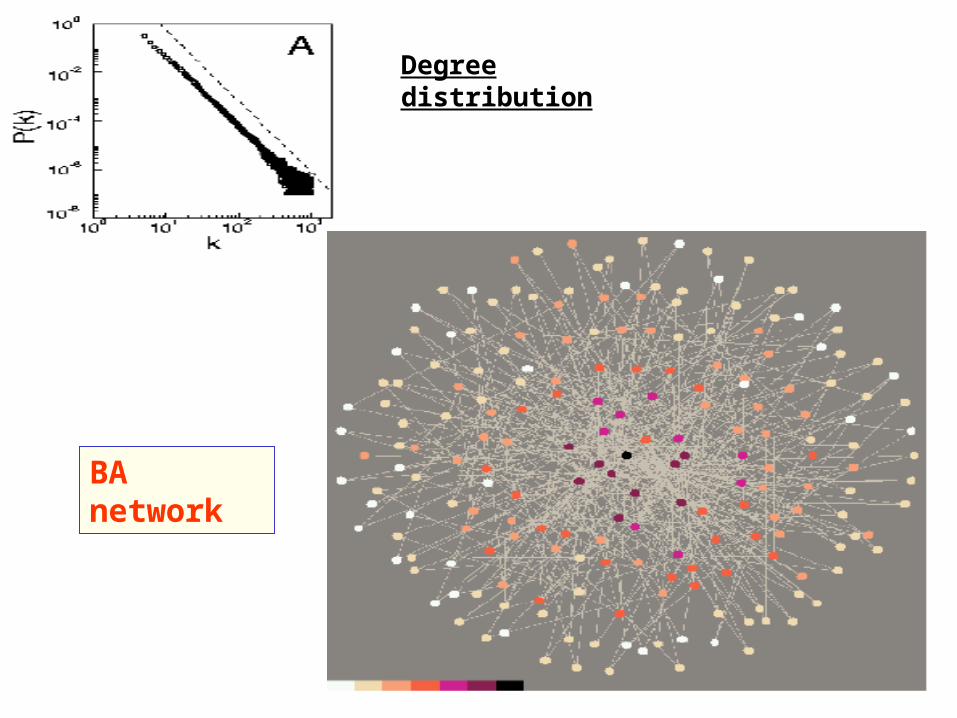
BA network
Degree distribution
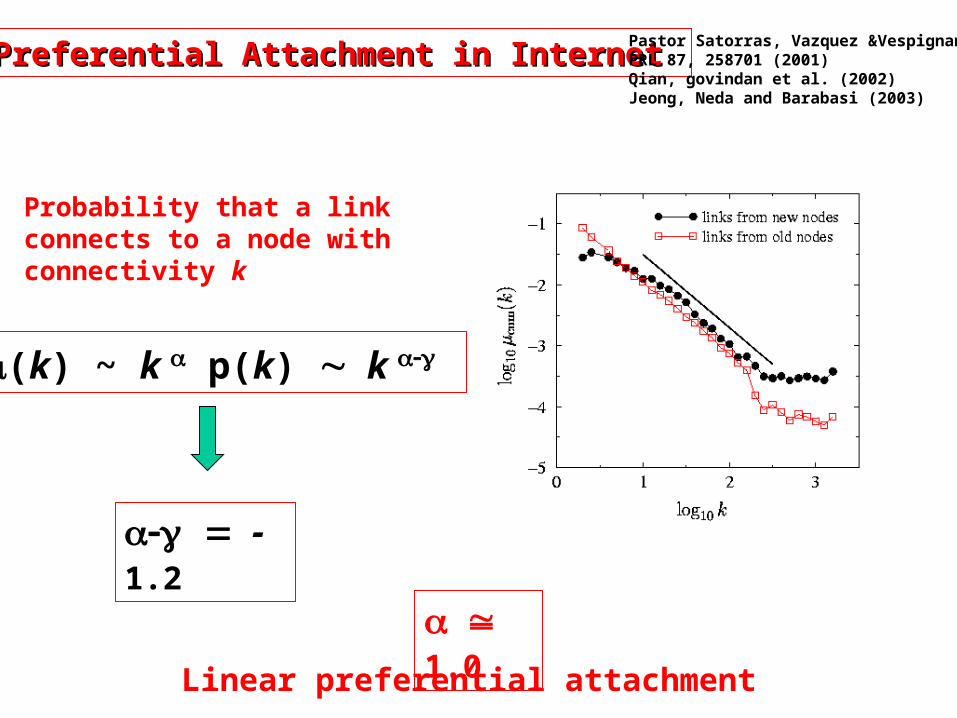
Preferential Attachment in InternetPreferential Attachment in Internet
Probability that a link connects to a node with connectivity k
(k) ~ k p(k) k
-1.2
1
.0 Linear preferential attachment
Pastor Satorras, Vazquez &Vespignani, PRL 87, 258701 (2001)Qian, govindan et al. (2002)Jeong, Neda and Barabasi (2003)
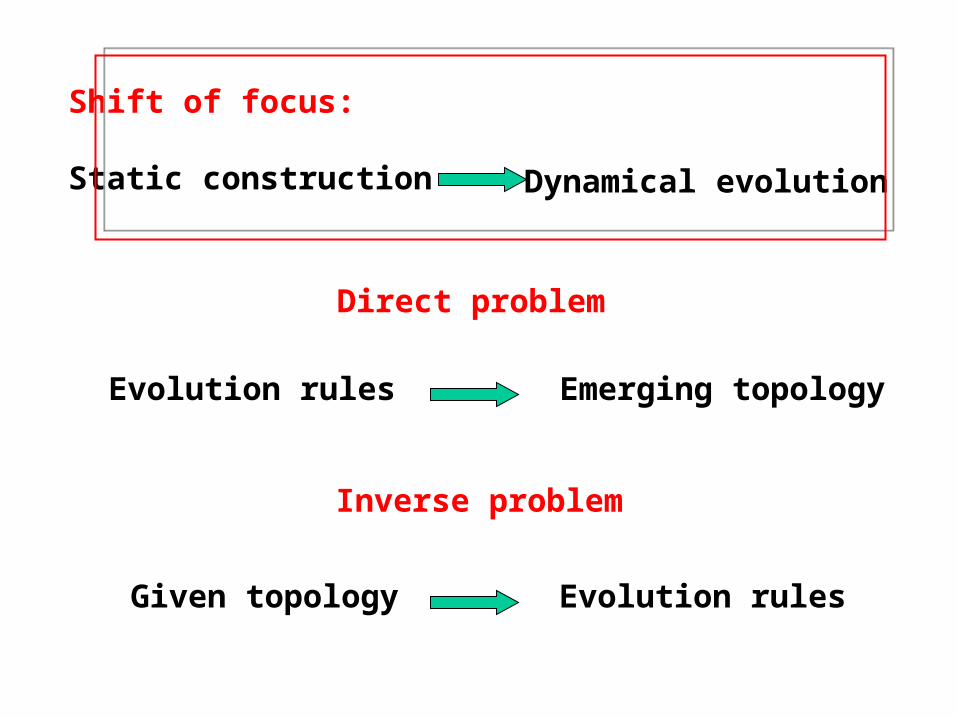
Shift of focus:
Static construction Dynamical evolution
Direct problem
Evolution rules Emerging topology
Inverse problem
Given topology Evolution rules
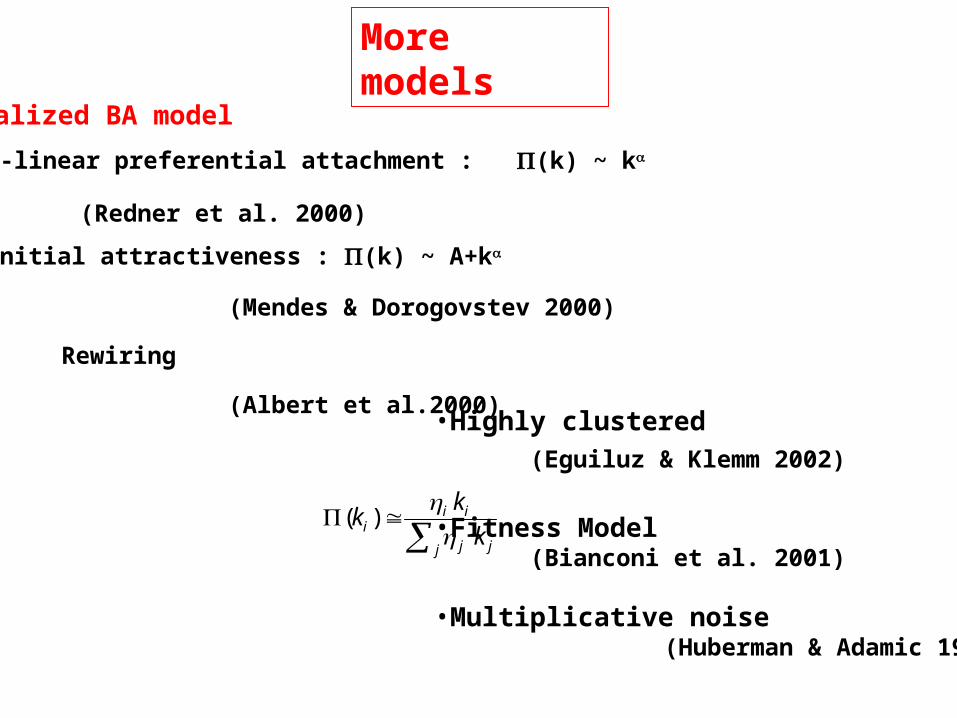
More models
•Generalized BA model
(Redner et al. 2000)
(Mendes & Dorogovstev 2000)
(Albert et al.2000)
j jj
iii k
kk
)(
Non-linear preferential attachment : (k) ~ k
Initial attractiveness : (k) ~ A+k
Rewiring
•Highly clustered
(Eguiluz & Klemm 2002)
•Fitness Model (Bianconi et al. 2001)
•Multiplicative noise (Huberman & Adamic 1999)
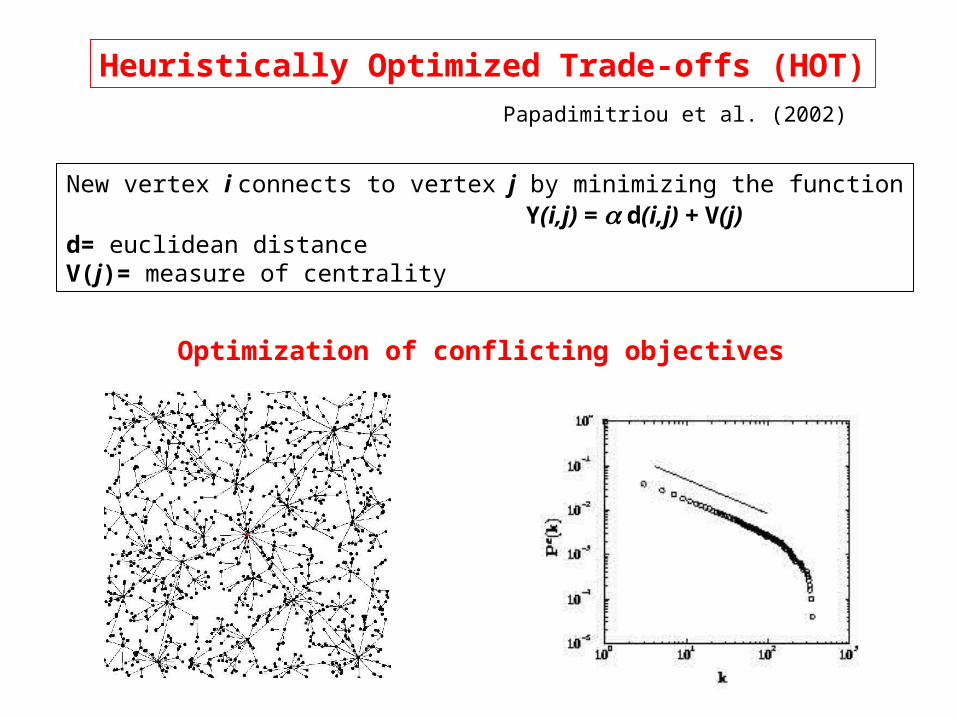
Heuristically Optimized Trade-offs (HOT)
Papadimitriou et al. (2002)
New vertex i connects to vertex j by minimizing the function Y(i,j) = d(i,j) + V(j)d= euclidean distanceV(j)= measure of centrality
Optimization of conflicting objectives
What else……
•Hierarchies and correlations (architecture)
•Robustness and resilience
•Spreading phenomena
•Routing and database updating
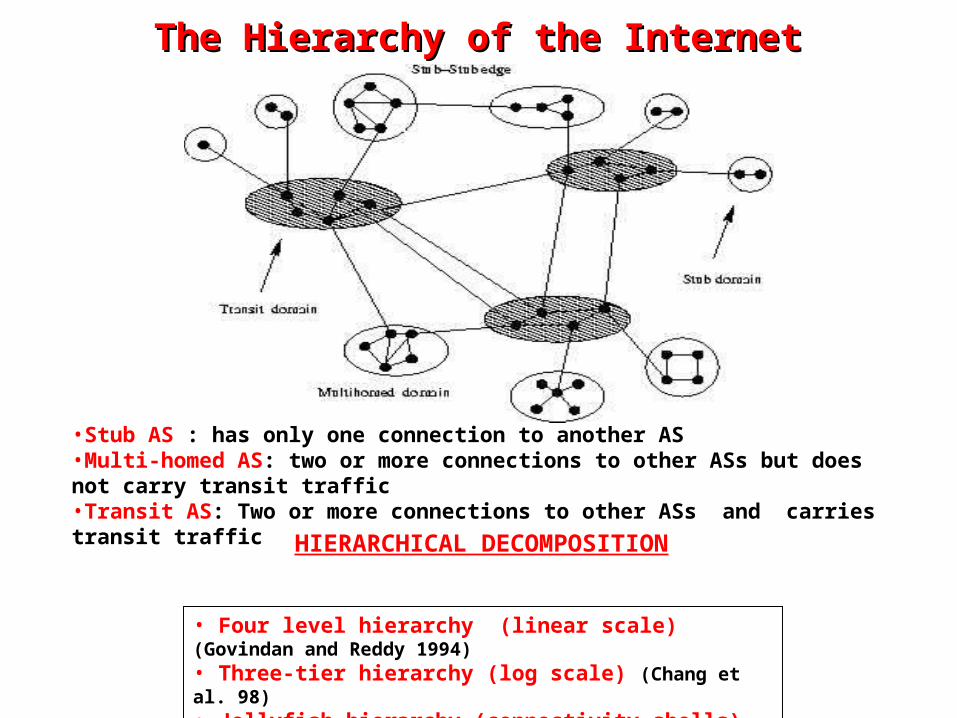
The Hierarchy of the InternetThe Hierarchy of the Internet
•Stub AS : has only one connection to another AS•Multi-homed AS: two or more connections to other ASs but does not carry transit traffic•Transit AS: Two or more connections to other ASs and carries transit traffic
HIERARCHICAL DECOMPOSITION
• Four level hierarchy (linear scale) (Govindan and Reddy 1994)• Three-tier hierarchy (log scale) (Chang et al. 98)• Jellyfish hierarchy (connectivity shells) (Tauro et al. 2001)
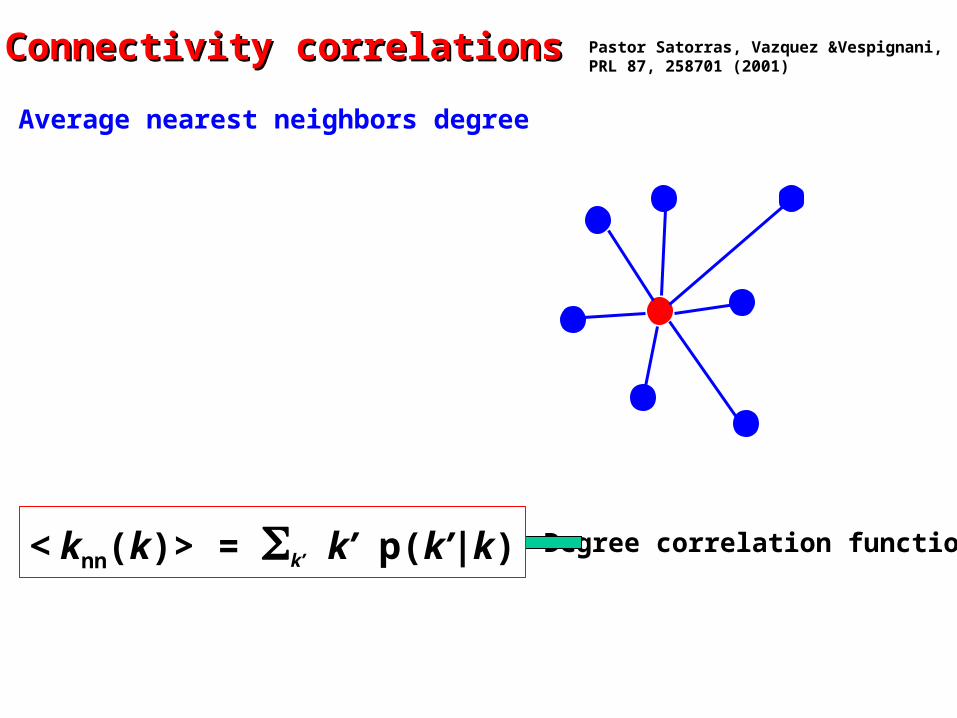
Connectivity correlations Connectivity correlations
Degree correlation function< knn(k)> = k’ k’ p(k’|k)
Average nearest neighbors degree
Pastor Satorras, Vazquez &Vespignani, PRL 87, 258701 (2001)
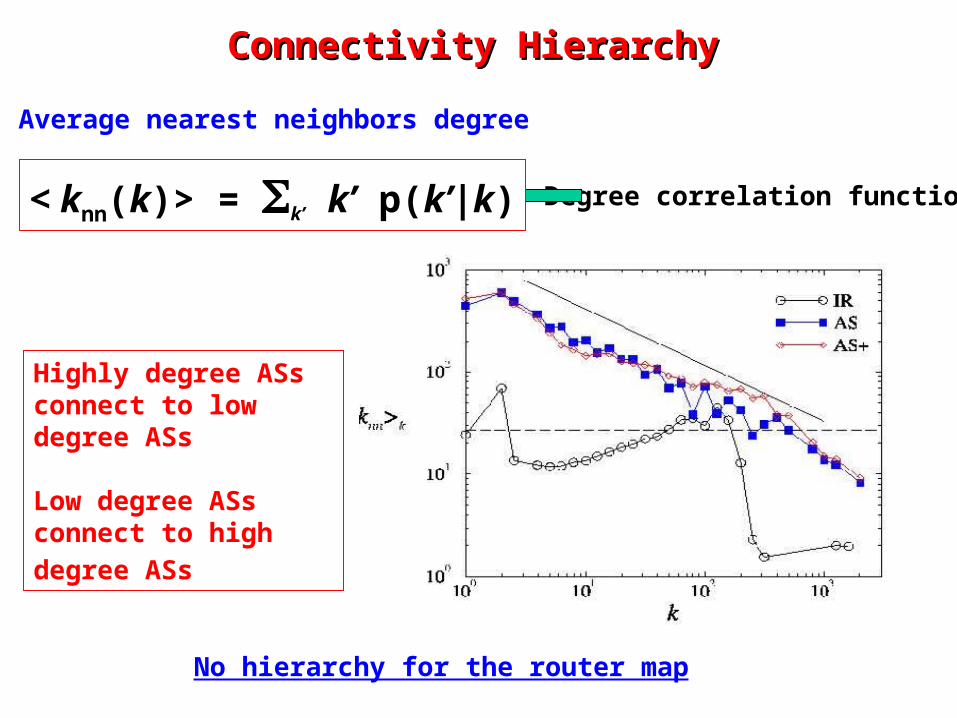
Connectivity Hierarchy Connectivity Hierarchy
Degree correlation function< knn(k)> = k’ k’ p(k’|k)
Average nearest neighbors degree
Highly degree ASs connect to low degree ASs
Low degree ASs connect
to high degree ASs
No hierarchy for the router map
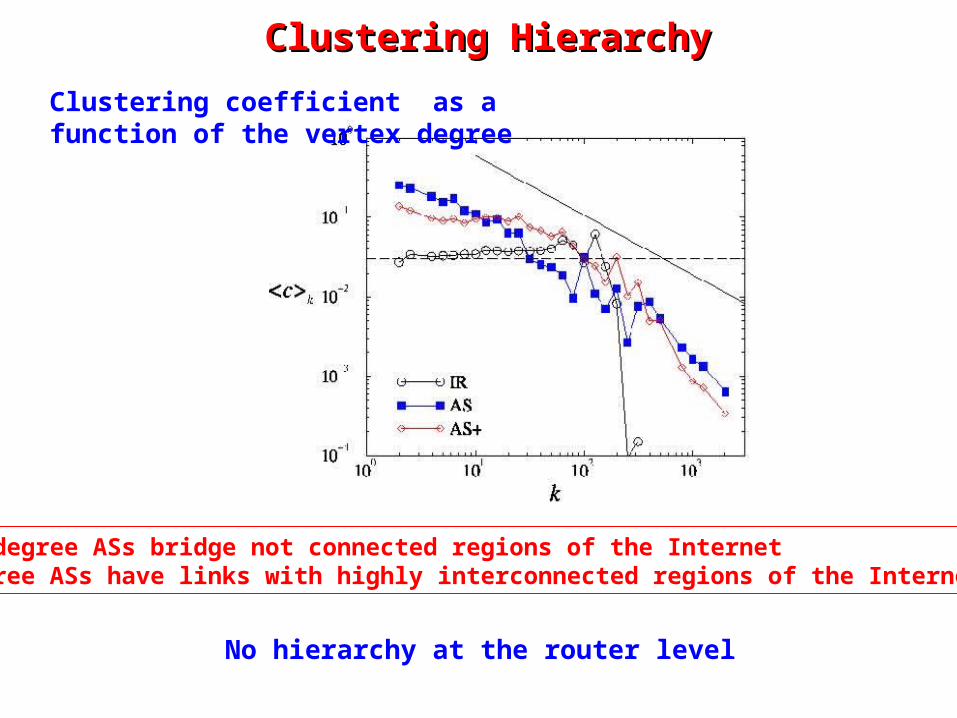
Clustering HierarchyClustering Hierarchy
Clustering coefficient as a function of the vertex degree
Highly degree ASs bridge not connected regions of the Internet Low degree ASs have links with highly interconnected regions of the Internet
No hierarchy at the router level
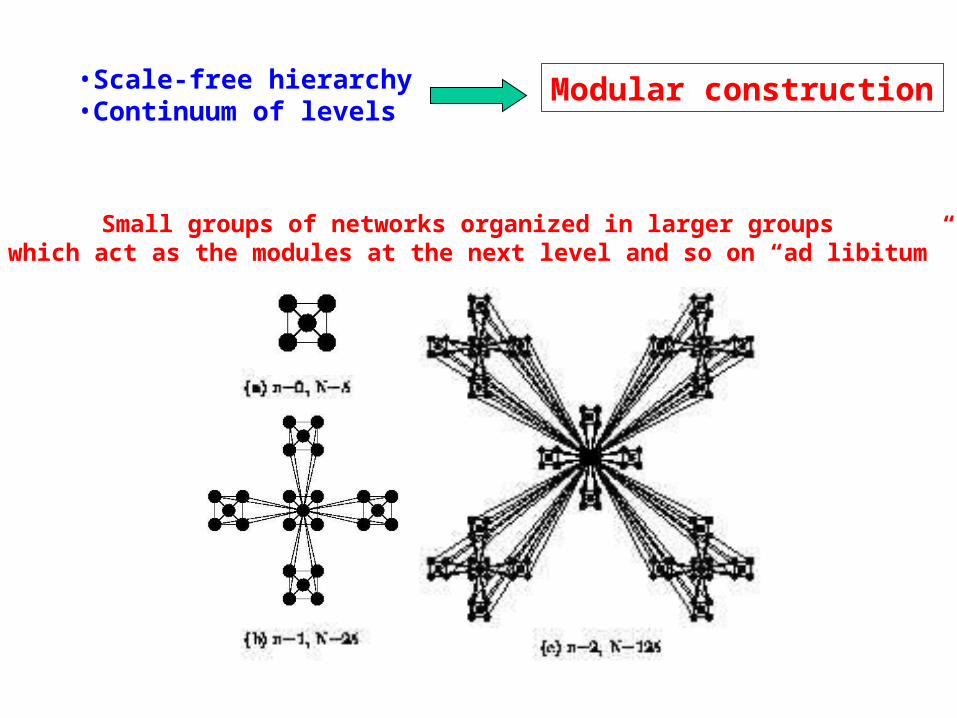
•Scale-free hierarchy•Continuum of levels
Modular construction
Small groups of networks organized in larger groups which act as the modules at the next level and so on “ad libitum”
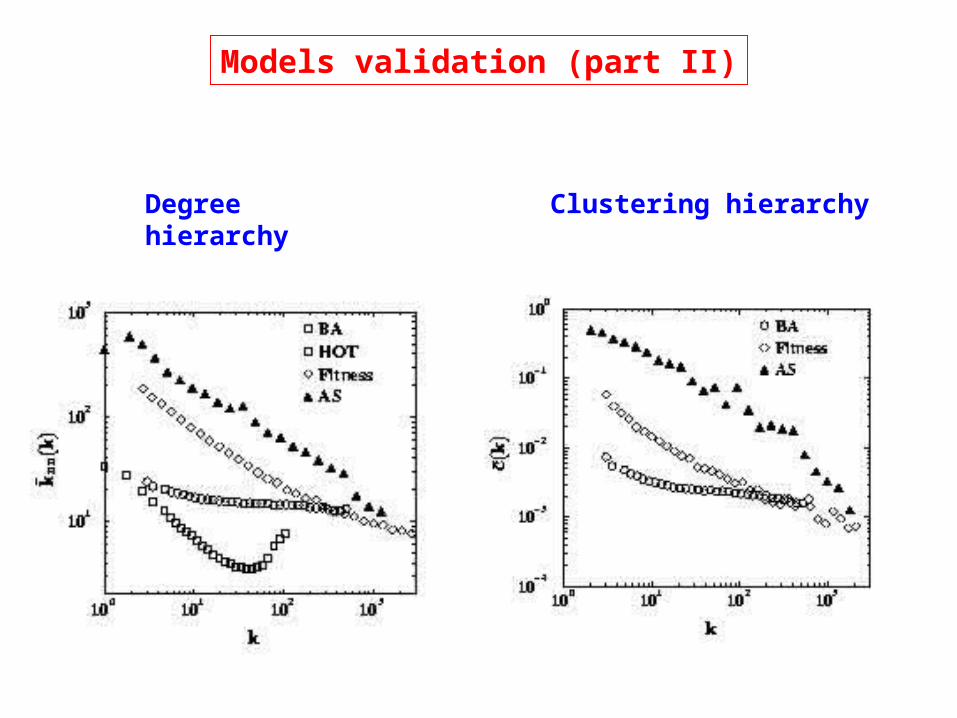
Models validation (part II)
Clustering hierarchyDegree hierarchy
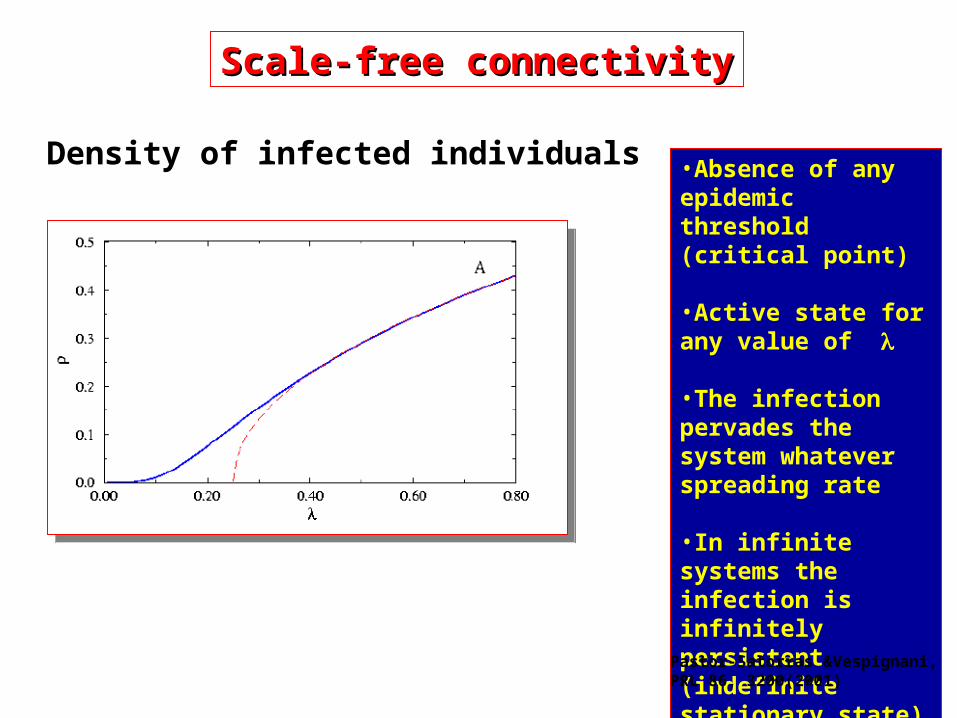
•Absence of any epidemic threshold (critical point)
•Active state for any value of
•The infection pervades the system whatever spreading rate
•In infinite systems the infection is infinitely persistent (indefinite stationary state)
Density of infected individuals
Scale-free connectivityScale-free connectivity
Pastor-Satorras &Vespignani, PRL 86, 3200(2001)
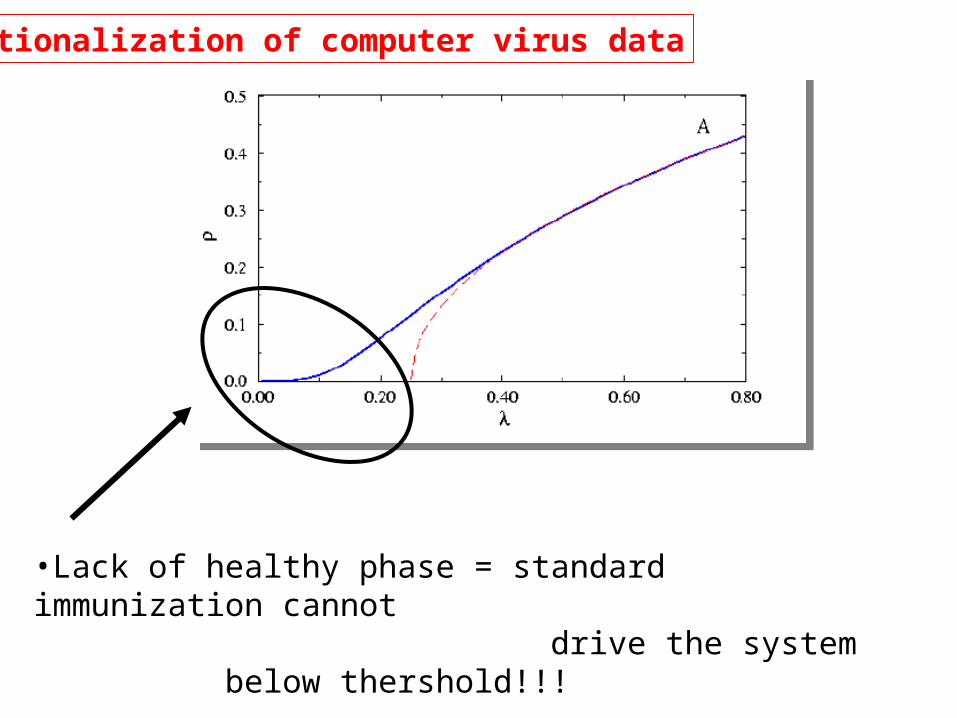
Rationalization of computer virus data
•Lack of healthy phase = standard immunization cannot drive the system below thershold!!!
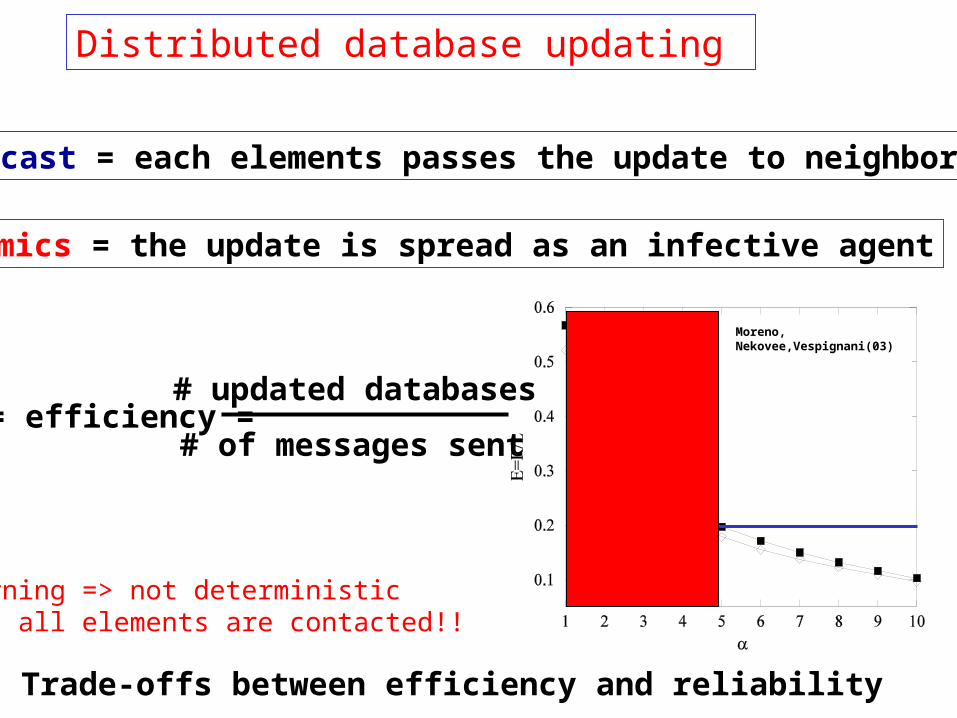
Distributed database updating
Broadcast = each elements passes the update to neighbors
Epidemics = the update is spread as an infective agent
E= efficiency = # updated databases
# of messages sent
Warning => not deterministicNot all elements are contacted!!
Trade-offs between efficiency and reliability
Moreno, Nekovee,Vespignani(03)
Internet is ever changing at all levels
Is it too ambitious the attempt to have a dynamical theoryof the Internet at the large scale ??
The lesson of statistical physics and cooperative phenomena:Basic symmetry and principles win over the microscopic details when
we look at emergent properties

One step back….
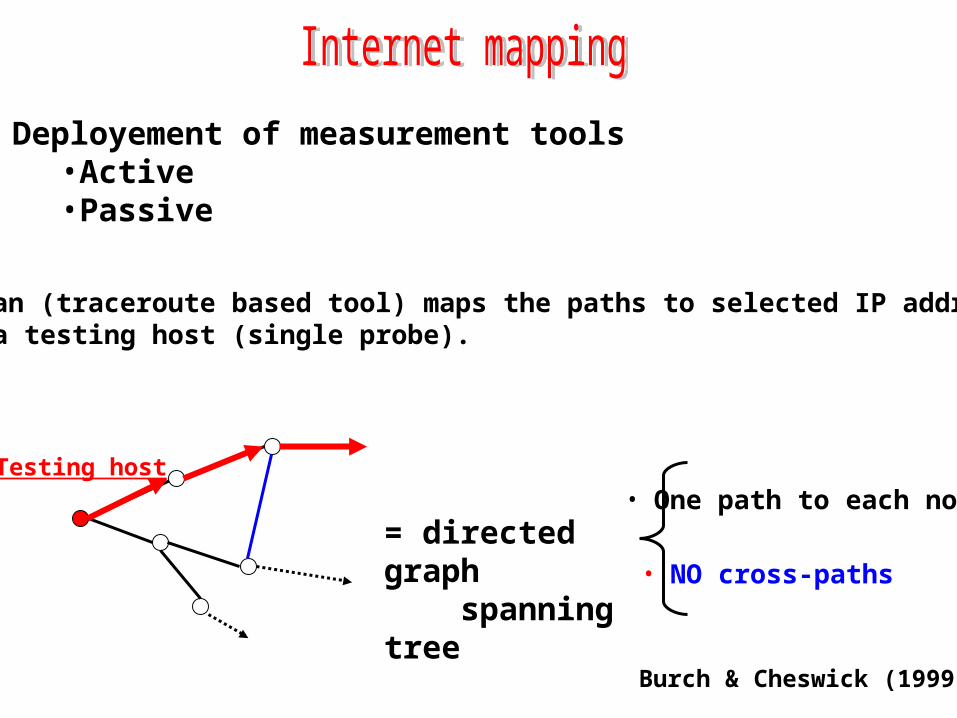
Deployement of measurement tools•Active •Passive
Netscan (traceroute based tool) maps the paths to selected IP addressfrom a testing host (single probe).
Testing host
= directed graph spanning tree
• One path to each node
• NO cross-paths
Burch & Cheswick (1999)
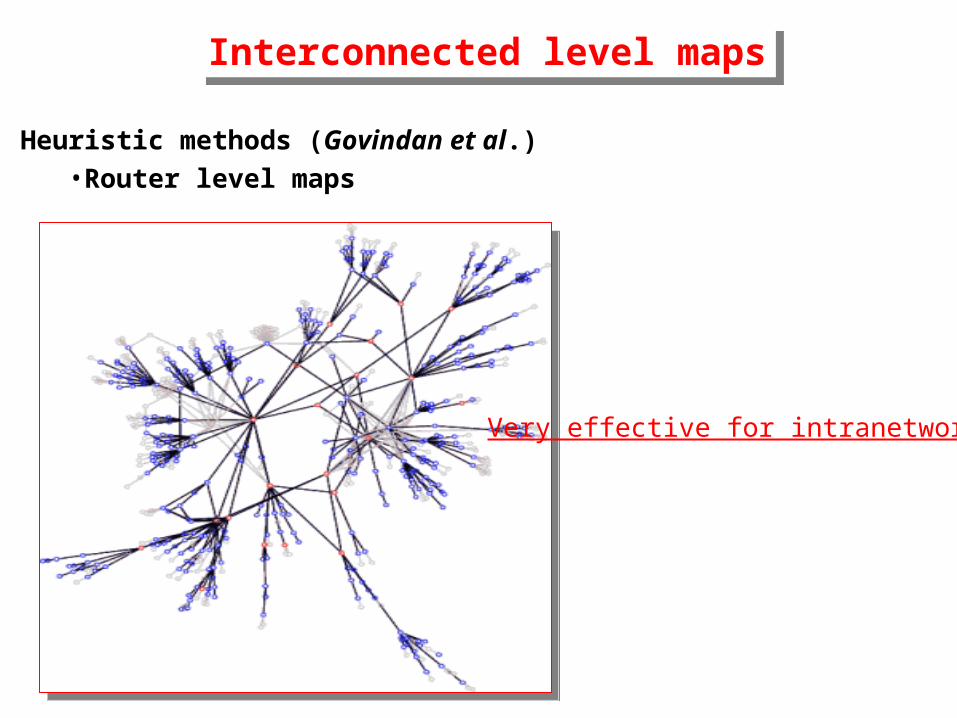
Interconnected level mapsInterconnected level maps
Heuristic methods (Govindan et al.)•Router level maps
Very effective for intranetwork
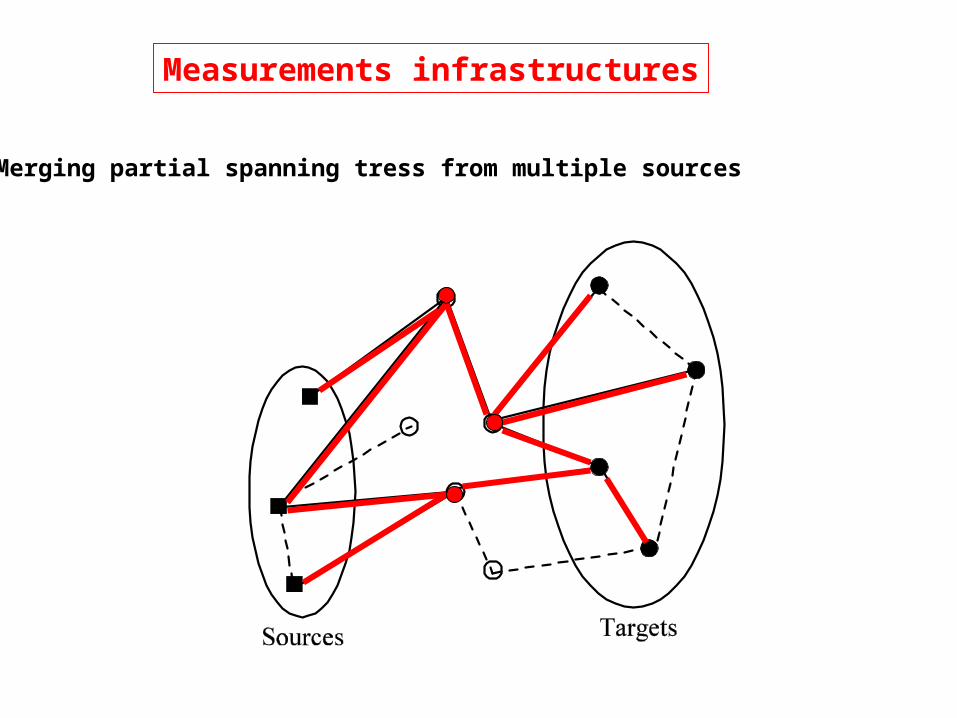
Measurements infrastructures
Merging partial spanning tress from multiple sources
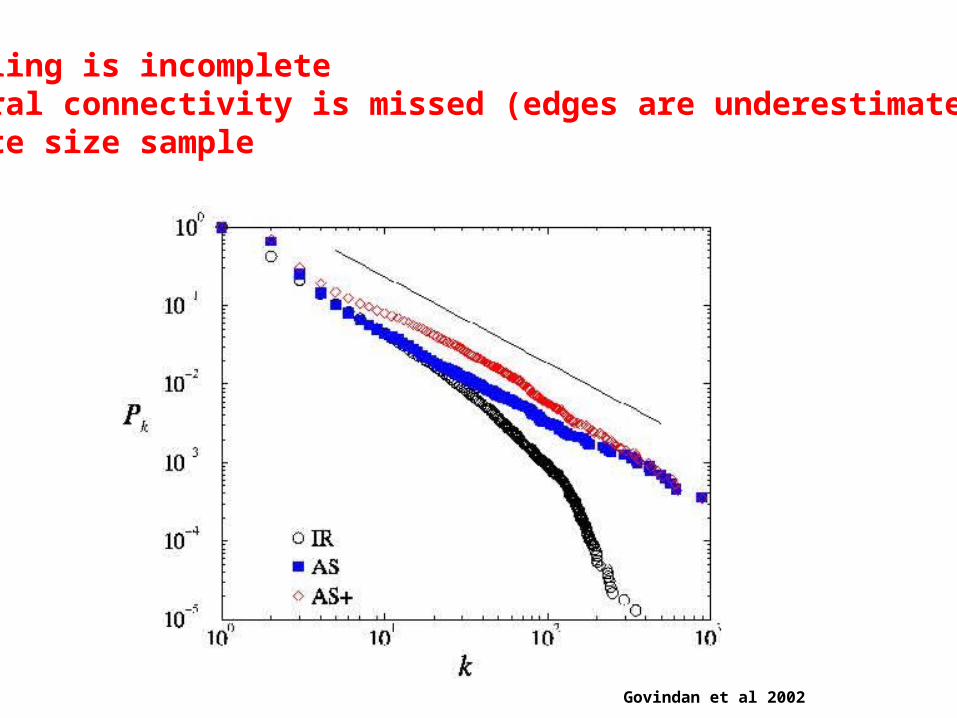
Sampling is incompleteLateral connectivity is missed (edges are underestimated)Finite size sample
Govindan et al 2002
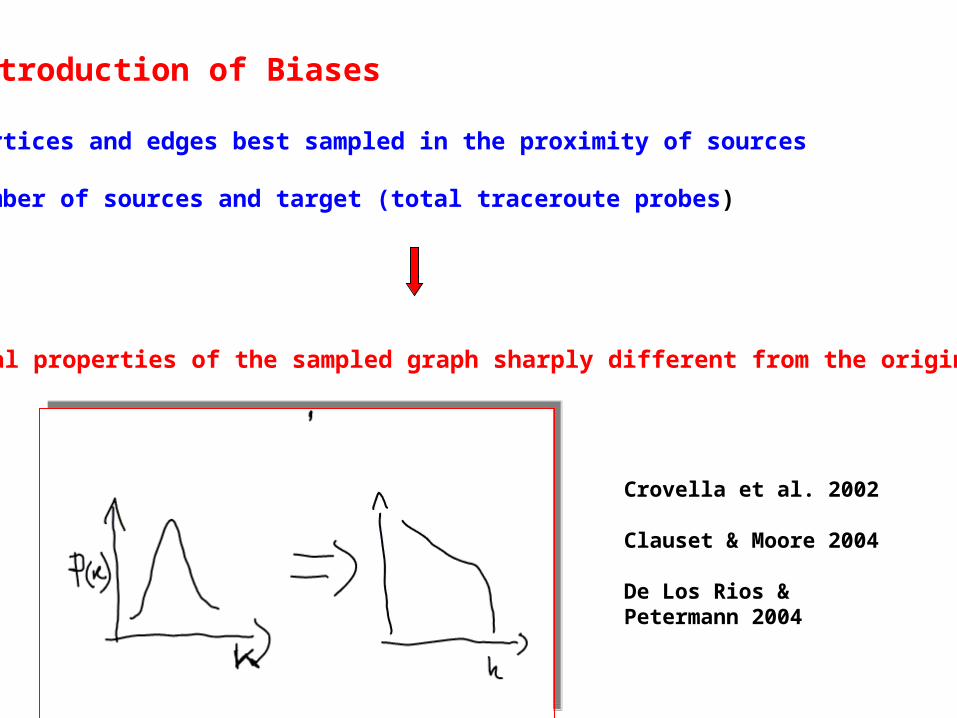
Introduction of Biases
Vertices and edges best sampled in the proximity of sources
Number of sources and target (total traceroute probes)
Statistical properties of the sampled graph sharply different from the original one
Crovella et al. 2002
Clauset & Moore 2004
De Los Rios & Petermann 2004
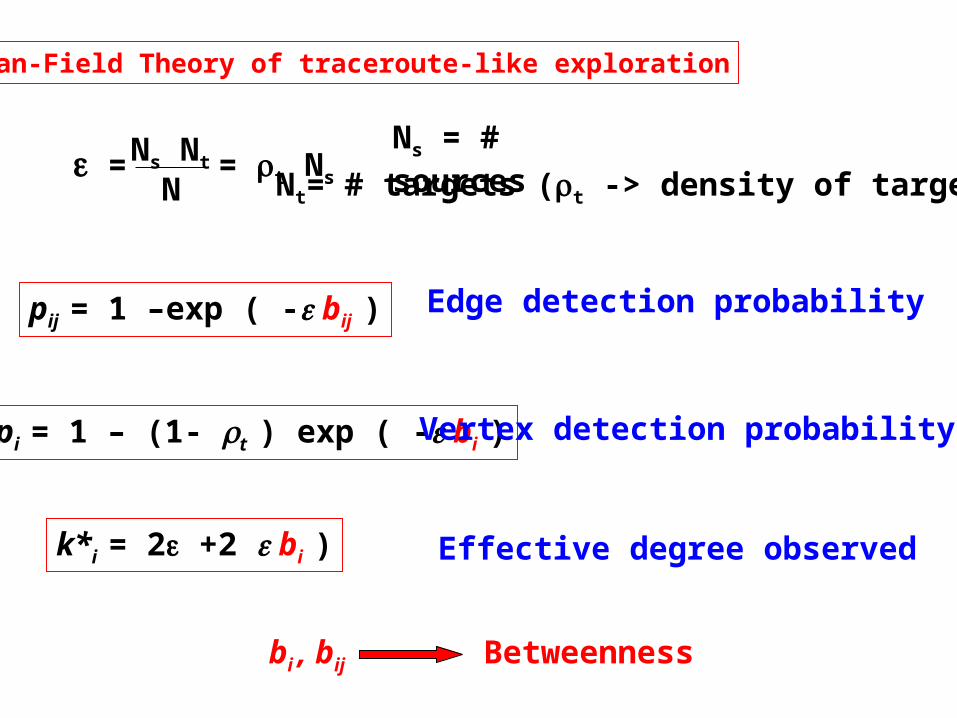
Mean-Field Theory of traceroute-like exploration
= Ns Nt
N Nt= # targets (t -> density of targets)
Ns = # sources
pij = 1 –exp ( - bij )
pi = 1 – (1- t ) exp ( - bi )
= t Ns
k*i = 2 +2 bi )
Edge detection probability
Vertex detection probability
Effective degree observed
bi , bij Betweenness
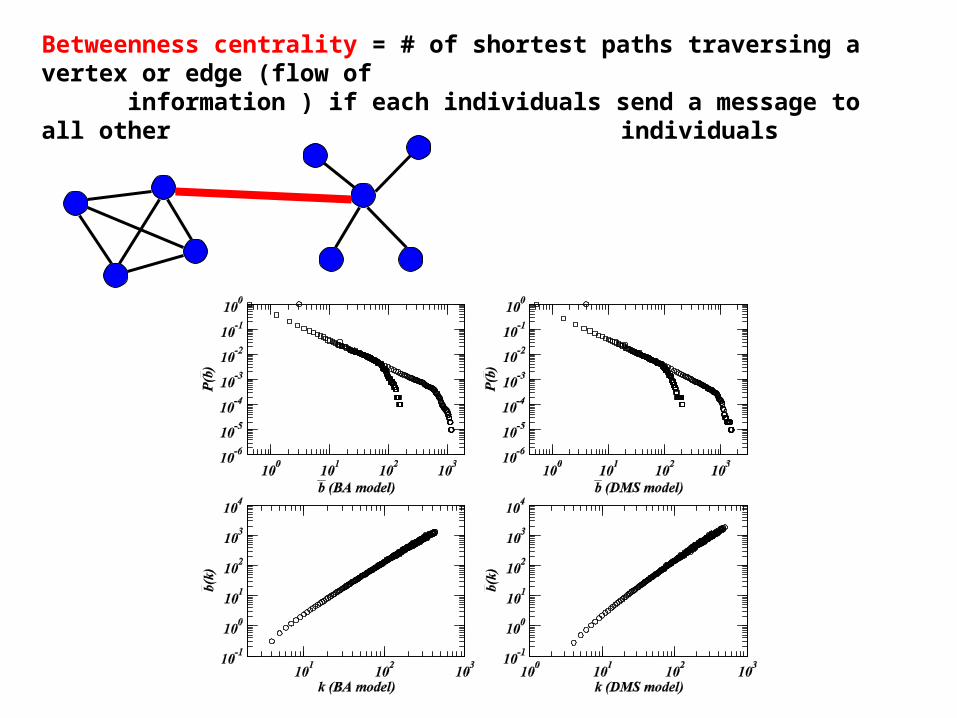
Betweenness centrality = # of shortest paths traversing a vertex or edge (flow of information ) if each individuals send a message to all other
individuals
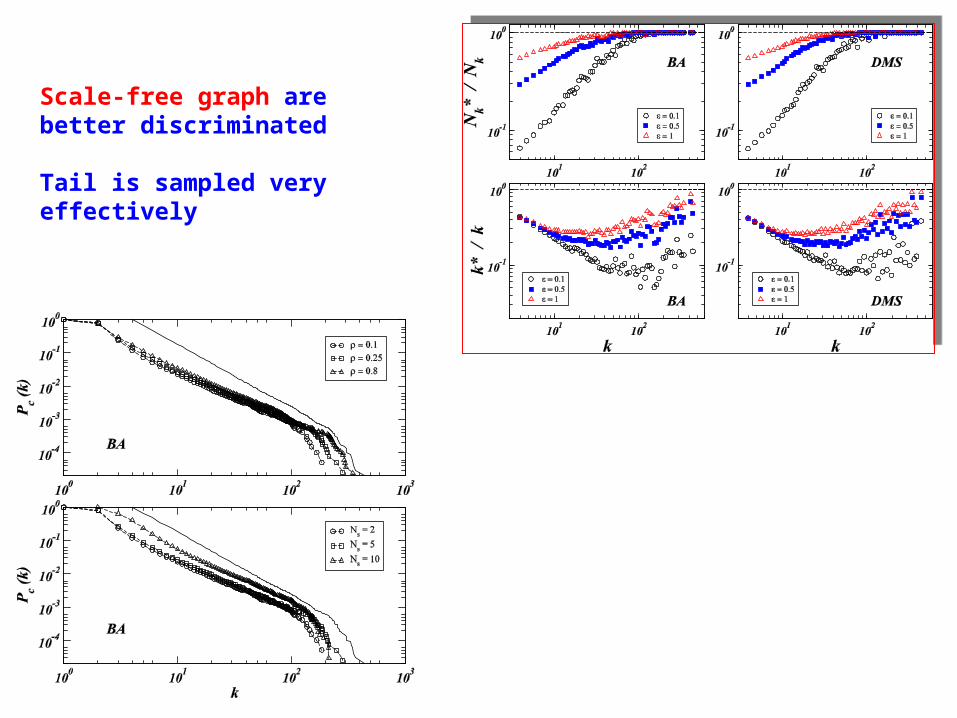
Scale-free graph are better discriminated
Tail is sampled very effectively
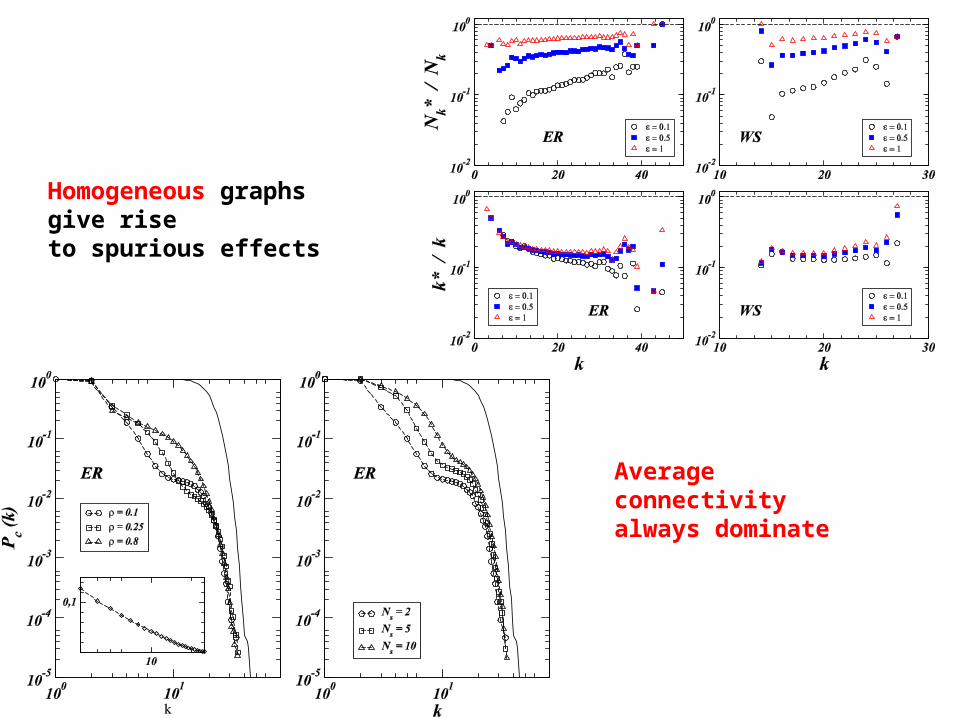
Homogeneous graphs give riseto spurious effects
Average connectivity always dominate
Heavy tails properties are a genuine feature of the Internet
Quantitative analysis might be strongly biased
however
What else….
•Router level very limited maps
•Optimized strategies
•Massive deployement traceroute@home
The dark side of the moon……Traffic and weights
•The internet is a weighted networks bandwidth, traffic, efficiency, routers capacity
•Data are scarse and on limited scale
•Interaction among topology and traffic
•Traffic and routing